Saleh Alomari, Mohammed Shujauddin, Vahid Emamian
Department of Electrical Engineering, St. Mary’s University, Camino Santa Maria, San Antonio Texas, USA
Correspondence to: Saleh Alomari, Department of Electrical Engineering, St. Mary’s University, Camino Santa Maria, San Antonio Texas, USA.
| Email: |  |
Copyright © 2016 Scientific & Academic Publishing. All Rights Reserved.
This work is licensed under the Creative Commons Attribution International License (CC BY).
http://creativecommons.org/licenses/by/4.0/

Abstract
The need of effective method to obtain and analyse electrocardiogram (EKG) signal has inspired This research paper to designed an efficient algorithm that can handle any (EKG), remove the most dominant noises associated with it, and extract the important futures. EKG signal is an electrical signal represents the physical human’s heart activity. Nonetheless, this signal is affected by various noise including baseline wondering and power interference. These noises affect the signal to noise ratio (SNR) especially in P and T waves which have less amplitudes than R peaks. Removing these noises result in cleaner signal that can be conveniently processed to extract important features such as heart health condition. EKG features play the main role in diagnosing the heart rate, normality and abnormality of heart activities, and heart diseases. For a healthy person, one heart beat consists of P, QRS Complex, T, and in some signals U waves. In this paper, a robust and numerically sufficient algorithm is developed to de-nosing EKG signal and extract all major features. For de-nosing EKG signal, FIR Equiripple High pass filter is used. FIR Equiripple Low pass filter follows this filter to remove the power interference noises. Haar wavelet transform is used to accurately detect the R peaks. Haar wavelet is found to be better than other common methods that are used to detect R peaks. Haar wavelet shows high accuracy when it is applied on EKG signal to detect R peaks. In fact, it succeeded to detect all R peaks in hundreds of EKG signals (obtained from Physio net website). All other features are detected based on the R peaks by creating a set of windows which their lengths depend on the maximum normal wave durations and locations. These filters and algorithm have been implemented in Matlab. The algorithm has been applied on 108 EKG signals collected from physionet website and could detect all EKG signals’ heart rates successfully despite the fact that some signals were extremely distorted.
Keywords:
EKG, ECG, Base line noise, Power interference noise, FIR Equiripple High pass filter, FIR Equiripple Low pass filter, Zero phase filter, Haar wavelet transform, QRS complex detection, P wave detection, T wave detection, Matlab
Cite this paper: Saleh Alomari, Mohammed Shujauddin, Vahid Emamian, EKG Signals – De-noising and Features Extraction, American Journal of Biomedical Engineering, Vol. 6 No. 6, 2016, pp. 180-201. doi: 10.5923/j.ajbe.20160606.04.
1. Introduction
The EKG is a graphical record represents the cardiac physical activities which are created by re-polarization and depolarization of atria and ventricular of the heart [1]. Every heart beat consists of P, QRS Complex, T waves. Those waves are extremely important in analysis heart condition, if they are present, they must be within certain amplitude and duration limits. Exceeding these maximum limits or failing to reach these minimum limits indicate illness. Absence of any of these waves is a sign of certain type of heart diseases. Fig (1) shows the typical EKG signal. Feature extraction through accurate waves detection is significant to measure heart rate and find any suspicion of diseases related to arrhythmias such as Heart Rate Variation, Tachycardia, Bradycardia. These diseases can be diagnosed by observing the abnormalities on the heart beats [2]. Nonetheless, detecting EKG waves is not easy due to time-varying morphology of the investigated signal and occurrence of noises. This paper implements a robust and an effective algorithm that is used to detect R peaks and based on that extracts the most important features of EKG signal.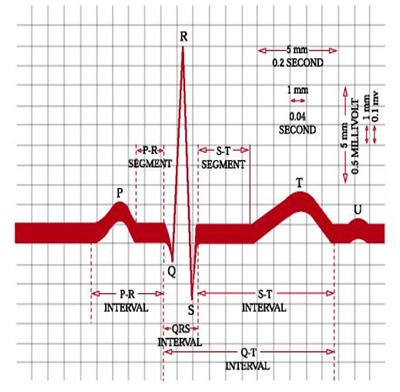 | Figure 1. Normal EKG signal |
2. Methodology
EKG signal holds all major features that can be extracted to diagnose heart condition. Unfortunately, the EKG signal obtained from a patient is corrupted by a lot of noises. Therefore, it must be preprocessed before extracting any feature. The wondering baseline and power interference noises are the main noises that must be removed from the signal. Wondering baseline noise presents due to low frequency produced by patient respiration. This low frequency ranges between 0.05 to 0.5 Hz [3]. Hence, High pass filter is capable to eliminate this noise from EKG signal. Nevertheless, there are enormous type of filters that can be applied. Choosing appropriate filter type is not easy task. Every filter has its own properties, advantages, and drawbacks. Choosing the right filter should be based on the signal that is processed and desired outcomes. For example, IIR filter type capable of removing the baseline noise from the signal. However, this type of filter introduces some distortion of the original signal since this type of filter has nonlinear phase response. Figure 2 shows the typical amplitude and phase response of IIR Butterworth filter. This distortion cannot be tolerated in EKG signal. Distortion means loss of some important information. Thus, FIR filter is proposed to be used. 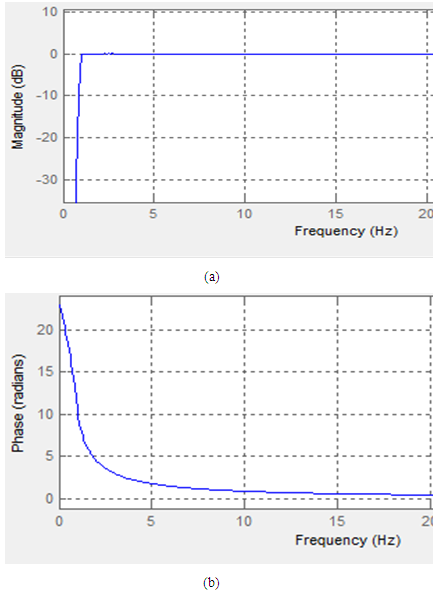 | Figure 2. Amplitude (a) and phase respose (b) For IIR buterworth filter |
Hence, this paper used a very effective filter that has narrow transition width and optimum filter length that meet desired filter specification. After effectively removing all type of noises, the signal is ready to be processed for feature extraction. Haar wavelet transform is used for detecting the R peaks. Based on R peaks, all other features have been extracted using windows with different sizes for every wave. Figure 3 shows the flowchart for the algorithm that is used in this paper to de-noise EKG signal and extract the important features out of it.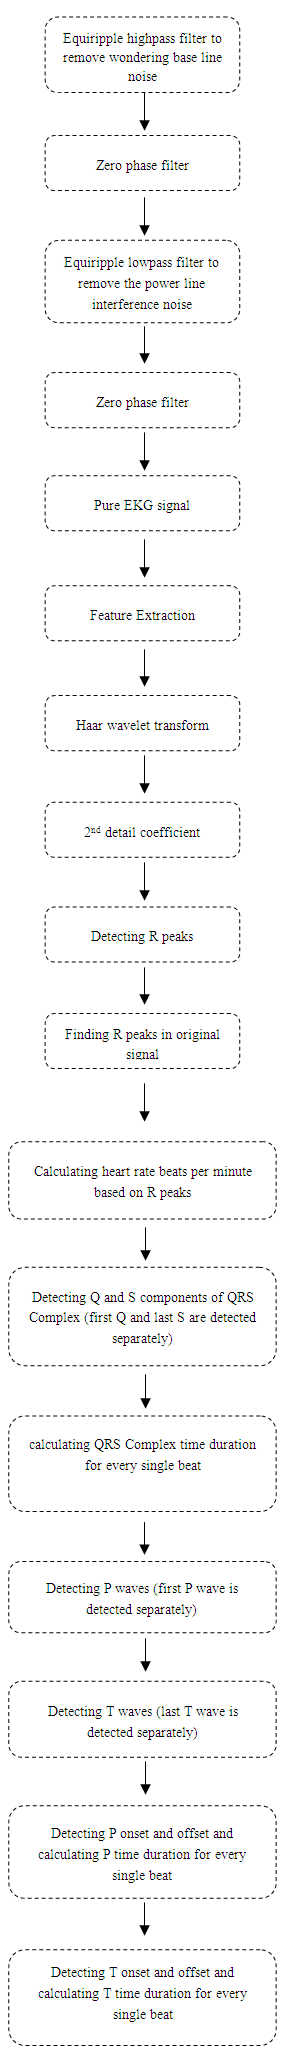 | Figure 3. Flowchart for algorithm used in this paper |
3. Filter Design
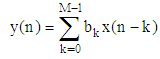
Removing the wandering baseline noise needs a highly efficient filter that has short transition band. This noise corresponds to frequency ranges between 0.15 to 0.5 Hz. This sharp edges mathematically forms discontituaty that can not be implimented in practice. Designning effective filter depends mainly on finding filter with low order whose frequency response efficinetly approximate the desireded specification. Among all type of filters, the Equiripple FIR filter is superior of optimizing the transition width and ripple hight in both stop and pass bands. Equiriplle filter algorithm has been developed by parks and mcclellan. They derived a new algorithm from the general remez exchange algorithm. The parks and mcclellan filter works to minimizing chebychev error [4]. The parks mcclellan algoritnm considers wighted approximation error between designed and intended frequency response which is distributed evenly across passband and stopband minimizing the maximum error. The difference equation for FIR filter design in general is given as: | (1) |
 | (2) |
bk is the filter coefficients, the output can be presented also as a form of input signal convolve with unit response as following: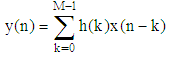 | (3) |
The FIR filter can be described by the system function as following equation: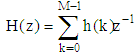 | (4) |
3.1. FIR Filter Designing
To precisely describe Equiripple filter designing, the ripple magnitude that occurs in passband and stopband must be bounded by the following limits [5]: | (5) |
 | (6) |
Where δ1 and δ2 are the ripples in passband and stopband respectively. There are 4 cases that result in a linear FIR filter. These cases can be handled by equiriple filter. Two of these cases are the symmetric unit sample response and the other two are the antisymmetric. In both cases, the filter order can be either even or odd. The following table summarize all cases:Table 1. Frequency response functions for linear phase FIR filters
 |
| |
|
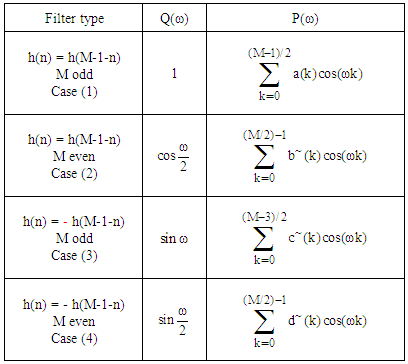
The frequency response H(ω) can be expressed as: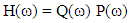 | (7) |
Where 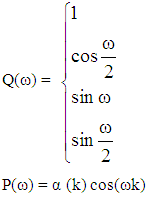 This is a common form of equiriple filter where the length of filter (L) and coefficient α(k) changes based on which linear phase case is presented. Thus, Parks and McClellan algorithm can be implemented by finding symmetric or antisymmetric which minimizes the maximum weighted Chebyshev error as follow:
 | (8) |
Where H(ω) is the actual frequency response, D(ω) is the desired frequency response, W(ω) is the weighted Chebyshev error, and B ranges between [0, π]. Plugging in the equivalent form of H(ω) and manipulating the previous equation results in the final form of the weighted error function: | (9) |
Where 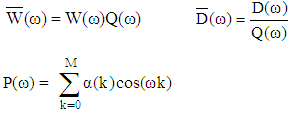 Alteration theorem:
 is the subset of interval [0, π] which consists of frequencies of desired filter in both passband and stopband.
  can be described by the following equation:
 | (10) |
Thus, there are in  at least M+2 extremal points ω1, ……, ωL+2, such that:
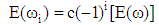 | (11) |
where i = 1, 2, ……..., M+2.|E(ω)| reaches its maximum point at minimum of M+2 points. The error function changes its sign between two successive extremal frequencies from which this theorem takes its name “alteration theorem”. As a result, the weighted error function shows an equiripple manner. Figure 4 describes the Parks McClellan algorithm to design equiripple filter [5].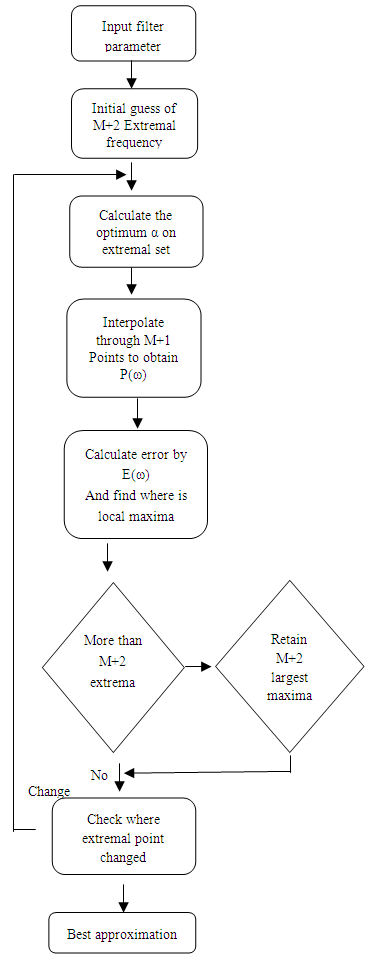 | Figure 4. Flowchart for algorithm used by Parks McClellan |
3.2. Equiripple Highpass Filter Used to Remove Baseline Noise
Baseline noise typically corrupts EKG signal due to patient’s respiration, motion of patient’s body, and electrodes. This noise could mask some important features. Therefore, it is extremely important to remove this noise. Equiripple highpass filter is capable of removing this noise completely without affecting the other important features of the signal. Equiripple highpass filter allows the main components of EKG signal to pass on such as P, QRS complex, and T waves as well as PR segment, PR interval, ST segment and QT interval. All mentioned intervals and segments correspond to certain frequencies. Hence, maintaining important frequencies are crucial. Based on American health association, the smallest component frequency is 0.05 Hz. Nonetheless, in practical, the baseline noise has frequency extend to the value of 1Hz. This means there is some feature that is distorted due to using highpass filter [6]. Nevertheless, the ST segment is not the area of interest in this paper. In fact, among the advantages that Equiripple filter has is the narrow band width that can be built and this feature can be maintained. However, building narrow transition band width that would maintain the ST segment using Equiripple requires filter with high order exceeds 5000. This order prevents us from using the zero phase filter built in as a function in Matlab to eliminate the time delay introduced by high pass filter which is crucial to preserve important feature. As a matter of fact, Matlab does not recognize zero or negative indices value that might be introduced due to time delay. This built-in function (filtfilt) requires the signal length to be more than three times of filter order. The Equiripple highpass filter used has a filter order of 2746, cutoff prequency at 1 Hz, stop frequency at 2 Hz, and stop attenuation of 80 dB. Figure 5,6,7 shows the original EKG signal, FFT of the signal, and EKG after removing baseline nose from the signal. It is so obvious that the baseline noise is completely removed while all features are preserved. After this stage, the DC offset due to baseline noise is successfully and completely removed.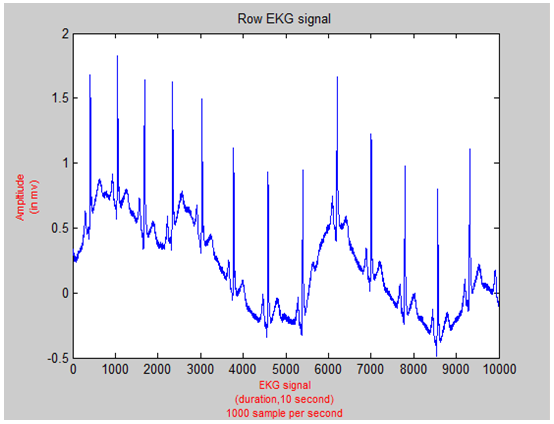 | Figure 5. Row EKG Signal |
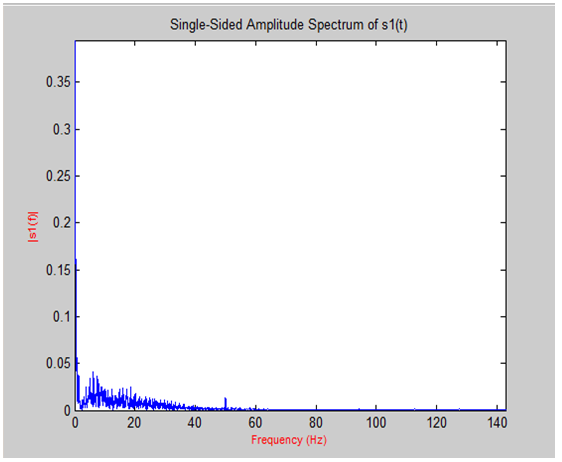 | Figure 6. FFT for the EKG Signal |
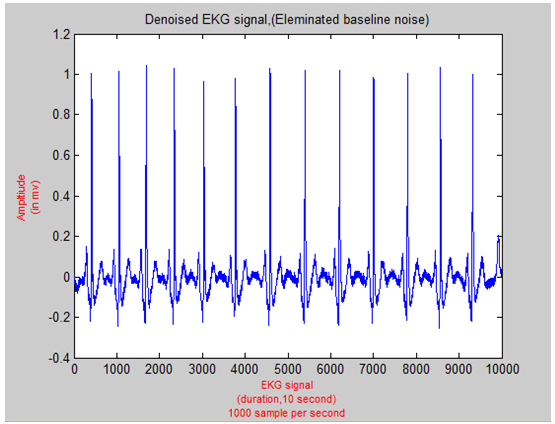 | Figure 7. EKG after completely removing baseline noise |
3.3. Equiripple Lowpass Filter Used to Remove Power Interference Noise
Due to improper grounding, power line noise interferes with EKG signal. This interference adds up 50 or 60 Hz (depends on power frequency standard that is used). The power interference noise appears as spike in frequency components analysis (FFT) Fig.6 at 50 Hz. This frequency component can be removed by using notch filter. However, all other frequency components which exceeds this value (50 Hz) are not important and does not contribute to the important features that we are looking for. Therefore, lowpass filter is adequate for this purpose. FIR equiripple lowpass filter is used with filter order of 506. The cutoff frequency is at 40 Hz. This filter is followed also by another filter with zero phase for avoiding time delay using same Matlab function filtfilt. Fig.8 shows the magnitude (in dB) and phase response of the designed filter. 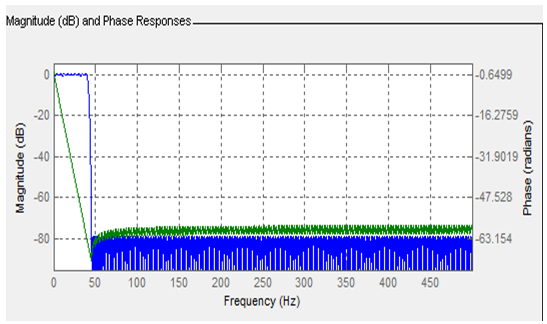 | Figure 8. Magnitude and phase response of the designed equiripple lowpass filter |
Figure 9 shows the resultant signal after removing the power interference noise using FIR Equiripple Lowpass filter. 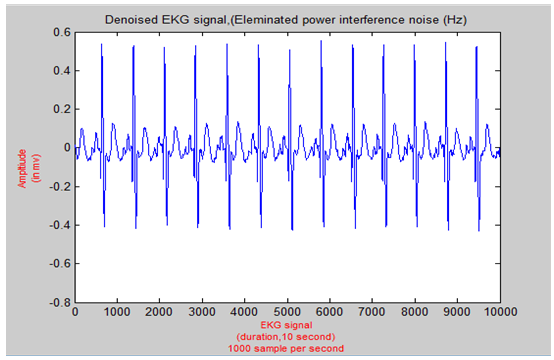 | Figure 9. EKG signal after removing power interference noise |
4. Features Extraction
Now, the EKG signal is ready to be processed for features extraction. In this stage, there are many methods and algorithms can be used to extract the EKG features. Some of these algorithms are easy to be implemented while others are complicated. Nevertheless, Haar wavelet transform is selected to be the method that is used to extract the EKG features. This decision was not arbitrary, in fact, based on many research papers, Haar wavelet is outstanding and promising. It provided high accuracy when it is applied to signals to detect important features.
4.1. Haar Wavelet Transform
Haar wavelet first introduced by Alfred Haar in 1910. Then, many definition and generalization follow it [7]. Haar wavelet is widely used in image coding, edge extraction, and feature extraction. The advantage of wavelet transform over the Fourier transform is that the wavelet transform can keep track of both time and frequency while in Fourier transform the high frequency in a short time is hard to be detected. Haar wavelet decomposes the processed signal into two sub-signals of half of its original length. In fact, there are two main functions that form wavelet analysis. The scaling function  and the wavelet
  Figure 10 shows the basic Haar scaling function.
 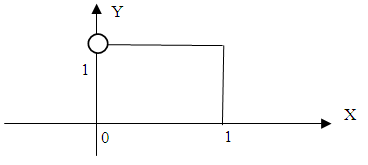 | Figure 10. Haar Scaling Function |
multiresolution analysis. The Haar scaling function as follows [8]: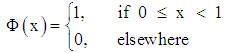 | (12) |
The same signal can be shifted over any finite set of integers. Let V0 is the function that is shifted and scaled as follows (figure 11 shows elements in V0): | (13) |
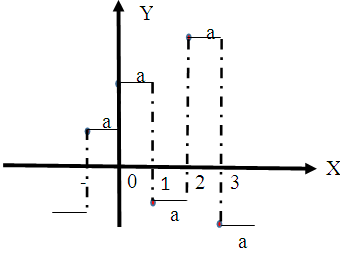 | Figure 11. V0 Components |
4.2. General Form of Haar Wavelet
Assume i is a positive integer, Vi is the space spanned by the following set: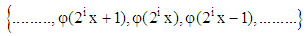 | (14) |
A function in V0 is contained in V1 and so forth. 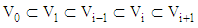 | (15) |
Vi has all information up to scale 2-i. when i become larger, the resolution become finer. The fact that Vi ⊂ Vi+1 indicates that there is no information is missed when the resolution become finer. The representation of  is spike of width (1/2i). Thus, when i is large, the
  is just spike that it might be filtered out if we desired to. For filtering noises, the wavelet
  must be part of Haar wavelet to isolate those spikes that is mentioned previously. The main concept is to decompose the Vi as an orthogonal sum of Vi and its complement. To clarify this, let i = 1. Thus, we have V1 and V0. V0 is found by
  and its shifted form. Therefore, V1 must be orthogonal and generated by the mother function
  function must satisfy certain condition to be valid as a complement for
  must be contained in V1. Hence, it can be expressed as:
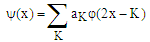 | (16) |
 | (17) |
The simplest  that is satisfy both conditions is the following function:
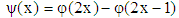 | (18) |
It is obvious that this function satisfies the first condition ( is contained in V1) as well as the second condition (
 is orthogonal to V0) as it is proofed in the following equation:
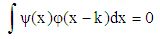
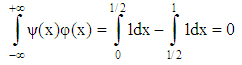 | (19) |
Thus,  is called Haar wavelet. Figure 12 represents haar wavelet that has the amplitude of 1 (a1 = 1) at
  and amplitude of -1 (a2 =-1) at
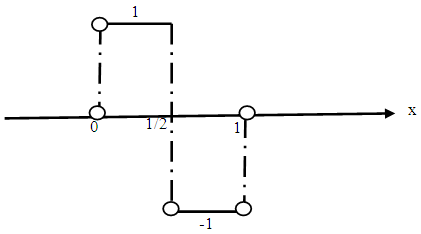 | Figure 12. Haar Wavelet  |
The previous function is a form of Haar wavelet that consists of the wavelet  and the scaling function
  Those two functions used to decompose a given signal and reconstruct it. The scaling function can be controlled to give wider or thiner scale that is called multiresolution analysis of a signal which helps to deeply diagnose the signal and filter out an undesirable component or noise [8].
4.3. Haar Wavelet Decomposition Algorithm
For a given function f, Vi is the nested spaces such that: 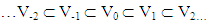 | (20) |
Assume Wi is the orthogonal of Vi with respect to subsequent space Vi+1. Therefore, 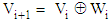 | (21) |
That is, Wi has all missing details from Vi to obtain Vi+1. Therefore, by repetition, any space Vi can be obtain by following formula [9]: | (22) |
Assuming f is a function in Vi, then, f can be decomposed as following equation: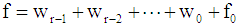 | (23) |
wr denote spikes of (f) that has the width 1/(2j+1).For r large enough, these spikes are narrow enough to represent noise, assume spike of width 0.001 denotes noise; then, 2-10 < 0.001< 2-9. Therefore, any wr with r ≥ 9 denotes noise, to remove these noises, these components (wr) set to zero value. The remaining components represents the signal that is free of noise [8].
5. Detecting Important Features through Applying Haar Wavelet to EKG
In many research papers that compared many methods used for features extraction, wavelet transform in general and Haar wavelet in specific has introduced the highest accuracy. Haar wavelet produce multiresolution analysis for a signal. Using this method, R Peaks detection is easily obtained. Haar wavelet transform generate two coefficients called approximation and detail coefficients. In the second detail coefficient, R peaks are dominant since the QRS complex has a higher frequency in a shorter time.Figure 13 shows the decomposed EKG signal second detail coefficient using Matlab function wavdec and detcoef. Hence, R peaks are easy to be detected using Haar wavelet transform. In this stage, the amplitude threshold is applied. Signal that has at least 60% of the maximum value is maintained and other samples are set to zero (see figure 14).The result was a bunch of values that are adjacent and repeated every period. Those values are representing the R peaks. Nonetheless, R peak should be represented by a unique value not by a bunch of values. Therefore, the highest amplitude value of each bunch of values is selected to be unique R peak. However, R peaks locations might be different in Haar wavelet from locations in the original signal. Therefore, a window of 100 samples of width is used to being searched through in the original signal after each R peaks location is multiplied by 4. This multiplication because in the second detail coefficient, the signal length is reduced by 4; this is the Haar wavelet property. Figure 15 shows the detected R peaks in the original EKG signal. 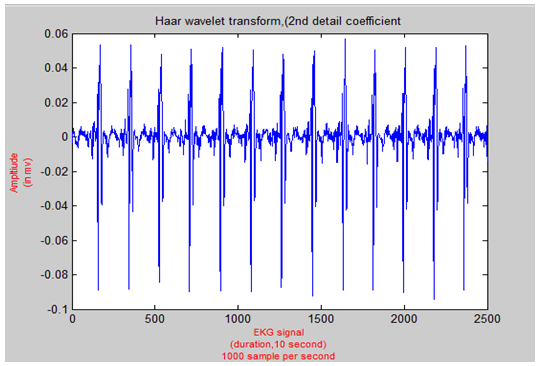 | Figure 13. Haar Wavelet Transform Second Detail Coefficient |
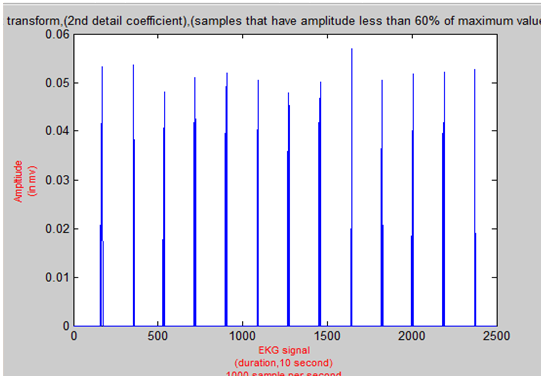 | Figure 14. Detected R Peaks from the Second Detail Coefficient |
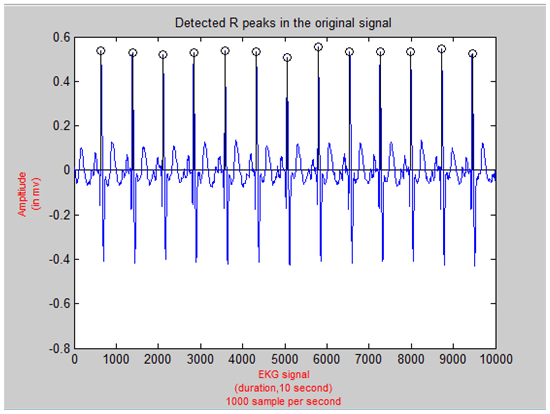 | Figure 15. Detected R peaks in Original EKG Signal |
Based on R peaks which are successfully detected, The P, Q, S, and T waves are being searched for with reference to R peaks locations. The number of beats per minute is calculated using the following formula:Number of beats = R peaks * length of signal (number of samples) / (Fs *60 seconds)Figure 16 shows the successfully detected R peaks with calculated heart rate per minute.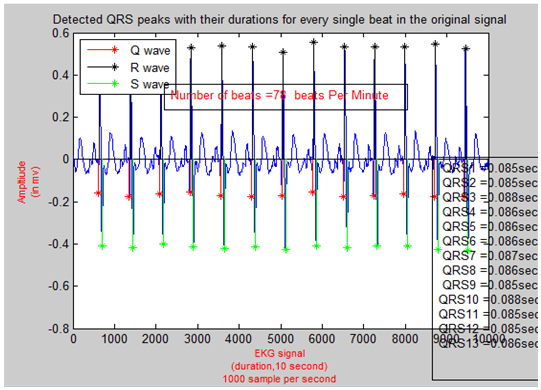 | Figure 16. Calculated Heart Rate Based on Detected R Peaks |
Creating windows and searching within these windows is the method that is used to detect other waves. To detect P peaks location, window of 160 samples is created. This window extends from 200 samples to 60 samples to the left of each R peaks. Within these windows, P peaks are located at the samples that have the maximum amplitude value. The same manner, Q peaks are detected with reference to R peaks locations. Windows of 90 samples extend on ranges start 100 samples on the left side of R peaks location and end 10 samples away from R peaks locations. In these windows, the minimum amplitude values are the Q peaks. S peaks are detected the same way; yet, instead of searching on the right side of R peaks, the left side is searched through windows of 95 samples. These windows start 5 samples on the right of R peaks and end at 100 samples away from R peaks. In these windows, minimum amplitude values are the S peaks. Figure 17 shows detected QRS complex and the time of these complexes for every single beat in EKG signal. T waves are the farthest waves from R peaks. They are detected using windows of 300 samples of width. These windows start at 100 samples on the right of R peaks and end at 400 samples away from R peaks. In these windows the maximum amplitude value are the T waves.  | Figure 17. Detected QRS Complex with Its Time Duration for Every Single Beat |
Thus, all peaks are successfully detected. Figure 18 shows detected T waves.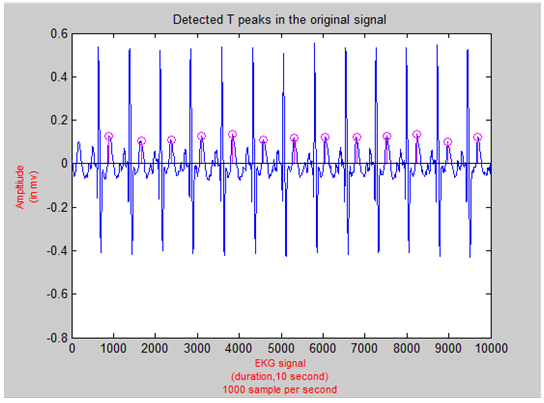 | Figure 18. Detected T Waves in EKG Signal |
However, there was a problem that urged through processing some EKG signals. Location of Windows that are created to detect waves peaks, in some signal, have some of negative values. Those negative values are used as arrays indices. However, Matlab does not allow for zero or negative values as indices. Therefore, some errors appeared with some EKG signals. To overcome this obstacle, the Matlab code that is developed, search the first peak of P wave and Q wave which are on the right side of R peak separately outside the main for loop function that is used for other peaks. If statement is set to measure the length of the first window. Then the minimum location is found. If the minimum location has zero or negative value, the window is narrowed down. Then, it is tested again. If it still has zero or negative value, it is narrowed down again and so forth. This procedure is done iteratively till certain limit. If it still has zero or negative value, the window width is set to zero and consider the first peaks is not existing. As a matter of fact, this is true because in practical it is not guaranteed that the EKG signal which being recorded has the first P or Q peaks. in fact, it might be when the sensor is connected to the patient, the time of recording is exactly at the appearance of R peaks. In this case, the P or Q is not existing. The same method is used with S and T waves which are located on the right-hand side of R peaks. Nonetheless, instead of processing the first peak individually, the last peaks are processed separately and instead of checking for zero or negative indices, the indices that exceed the EKG signal length (10000 sample) is checked using find the maximum value command instead of minimum. This strict algorithm, searching windows that are always within the range. The algorithm and matlab code being smart and able to handle any EKG signal regardless of how and when the signals are recorded. After all, waves and peaks are found. The code measures the QRS complex duration, P wave duration and T wave duration. To have these waves duration measured, onset and offset for every single wave should be found. Using if condition nested inside for loop for every type of wave (P, QRS, T), the onset and offset are found. If condition checks for sample that proceed the sample which is bigger than zero and follow sample which is less than zero. The search for every peak duration starts from the peaks itself. For peaks onset, windows are created to the right of peaks. Within each window, the value that is satisfy the if statement condition is consider the wave onset. However, in some waves, sample that satisfy if condition is not unique. Hence, the first sample that satisfy if condition is considered and ignore other samples with help of break command. In fact, the closest sample to the wave peak is considered. That is, the first zero crossing sample is considered to be onset. The same way that offset for every single wave is measured; yet, instead of searching to the left side of the peak, the right side of the peak is the point of interest. Having all peaks of waves onset and offset measured, subtracting the offset from onset for every single wave result in the duration (in many samples) for every single wave. To convert the duration to be in time (seconds), the following formula is used:Duration in samples = offset - onsetDuration in time = (Duration in samples * 1)/FsFs is the sampling frequency. The same method is used for both P and T wave durations. Figure 19 and 20 show the P and T waves onset and offset detection and duration respectively.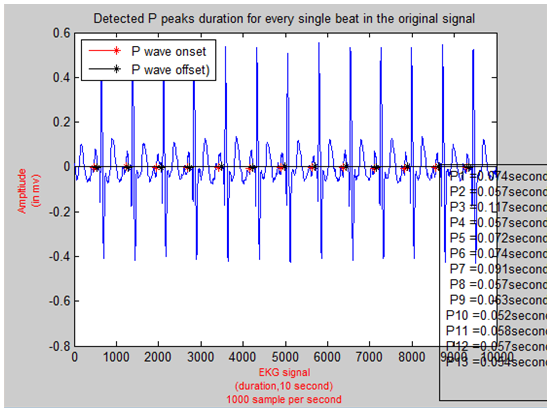 | Figure 19. Detected P Waves and Their Duration |
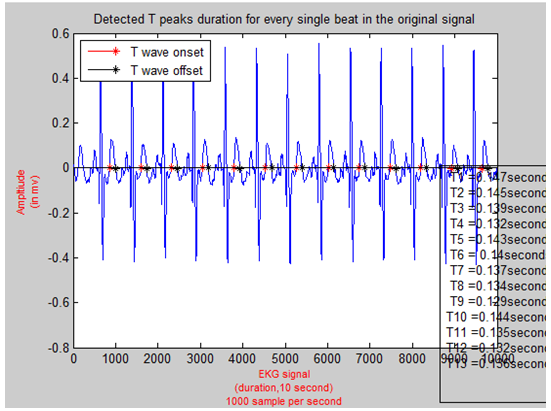 | Figure 20. Detected T Waves and Their Duration |
6. Conclusions
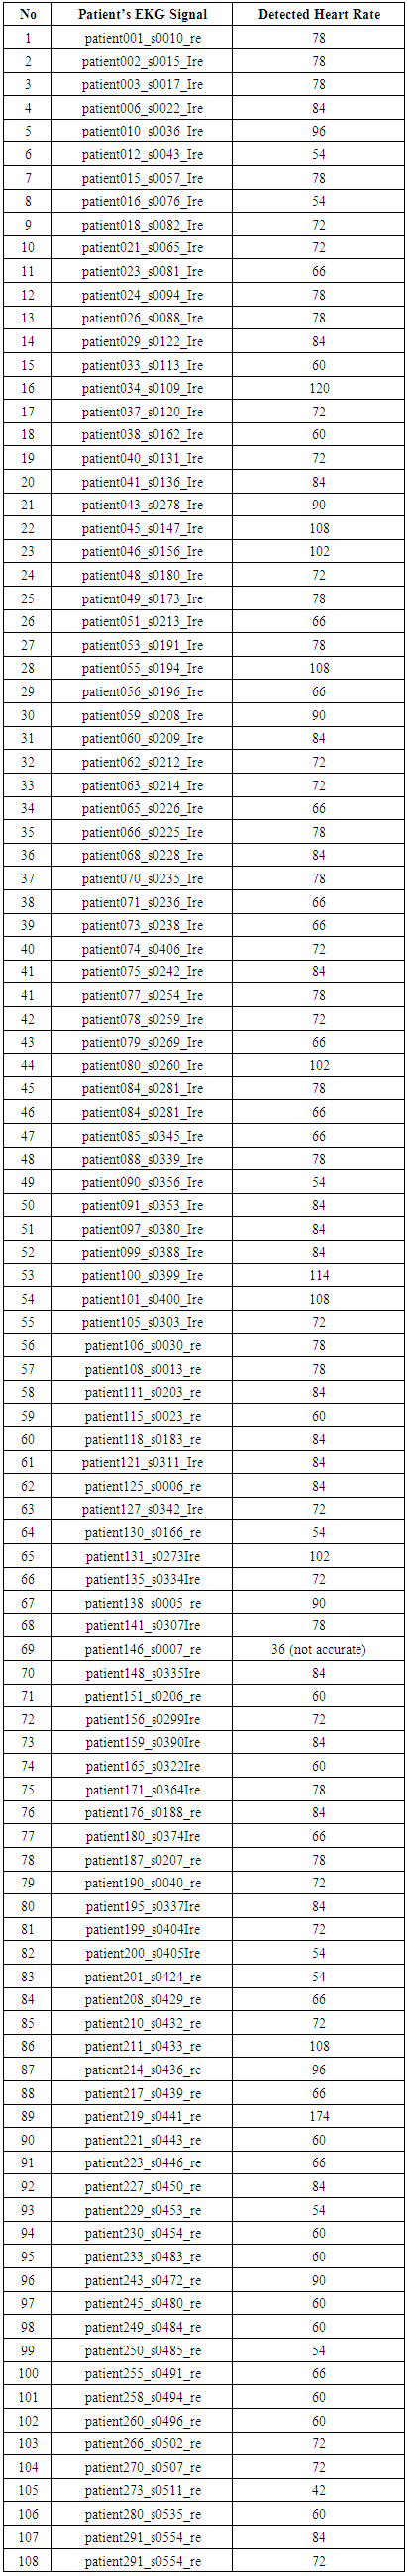
This algorithm has been tested on 108 EKG signals obtained from physionet website. Those signals are real signals collected from patients for research aim. The algorithm succeeded to detects all R peaks in each signal and all other important waves. In addition, the heart rate, the duration of P, QRS Complex, and T waves have been successfully and accurately calculated. The only wave that the algorithm fails to detect R peaks in it is the EKG obtained from the patient 146. This signal is extremely distorted. Table 2 shows the heart rate calculated for different patients.Table 2. Measured Heart rate for Some Patient’s EKG Signals’
 |
| |
|
6.1. Enhancement Work
This algorithm search for peaks in a designed window and assume that the waves (P, QRS complex, and T) are always existing. It does not take into consideration that the disappearance of some waves is possible due to any kind of disease or even dysfunctionality of hardware devises. This algorithm can be smarter by applying another threshold for peaks amplitude so that even if the peak is found, it does not consider as a peak till satisfy the threshold condition. In addition, the PQ segment and ST segment is not calculated which can be easily detected using same window method.
Appendix A
 | Matlab code that is used to de-noise EKG signal and extract the various features. |
References
| [1] | S. Z. Mahmoodabadi, A. Ahmadian, and M. D. Abolhasani, "ECG Feature Extraction using Daubechies Wavelets," in Proceedings of the fifth IASTED International conference on Visualization, Imaging and Image Processing, 2005. |
| [2] | R. J. Huzar, "Basic Dysrhythmias, Interpretation and Management," 1988. |
| [3] | G. K. Singh, A. Sharma, S. Velusami, "A Research Review on Analysis and Interpretation of Arrhythmias using ECG Signals," ’ISSN: 0974-5343 IJMST, pp. pp::37-55, 2009. |
| [4] | Vijay K. Madisetti , Douglas B. Williams, Digital Signal Processing Handbook, Boca Raton: CRC Press LLC, 1999. |
| [5] | John G. Proakis, Dimitris G. Manolakis, "Digital Signal Processing"," Principles, Algorithms, and Applications", Third Edition ed., PRENTICE-HALL INTERNATIONAL, INC., 1996. |
| [6] | Yurong Luo, Rosalyn H. Hargraves, Ou Bai, Kevin R. Ward, "A Hierarchical Method for Removal of Baseline Drift from Biomedical Signals Application in ECG Analysis," The Scientific World Journal, vol. Volume 2013, p. 1:2, 2013. |
| [7] | Radomir S. Stankovic, Bogdan J. Falkowski, "The Haar wavelet transform its status and achievements," p. 25:44, 2003. |
| [8] | Albert Boggess, Francis J. Narcowich, A first course in wavelets with fourier analysis, 6th Edition ed., U. S. River, Ed., Prentice Hall, 2001, p. 155:221. |
| [9] | Michael F. Cohen, Tony D. DeRose, Alain Fournier, Michael Lounsbery, Leena-Maija Reissell, Peter Schroder, Wim Sweldens, Wavelets and their Applications in Computer Graphics. |

 Abstract
 Reference
 Full-Text PDF
 Full-text HTML