-
Paper Information
- Next Paper
- Paper Submission
-
Journal Information
- About This Journal
- Editorial Board
- Current Issue
- Archive
- Author Guidelines
- Contact Us
American Journal of Biomedical Engineering
p-ISSN: 2163-1050 e-ISSN: 2163-1077
2016; 6(3): 78-85
doi:10.5923/j.ajbe.20160603.02

Automatic Grading of Premenstrual Syndrome: Simulating the Manual Diagnosis Process
 Abstract
 Reference
 Full-Text PDF
 Full-text HTML
Subhagata Chattopadhyay, Sangeeta Bhanja Chaudhuri
Dept. of Computer Science and Engineering, National Institute of Science and Technology, Berhampur, India
Correspondence to: Subhagata Chattopadhyay, Dept. of Computer Science and Engineering, National Institute of Science and Technology, Berhampur, India.
| Email: |  |
Copyright © 2016 Scientific & Academic Publishing. All Rights Reserved.
This work is licensed under the Creative Commons Attribution International License (CC BY).
http://creativecommons.org/licenses/by/4.0/

This paper presents an approach for automatic grading of Premenstrual Syndrome (PMS) using multilayer feed-forward neural networks (MLFFNN). It is an attempt to prove the hypothesis that MLFFNNs can be used to simulate the way medical doctors diagnose PMS cases in the clinics. The challenge in this work is to handle highly subjective sign-symptoms, presented in PMS cases and fed into the MLFFNNs. To do so, fifty real-world PMS cases are considered in this study. Each case is described by ten symptoms and the corresponding grade, such as ‘Low’ or ‘High’. Several statistical techniques, such as Principal Component Analysis (PCA), Chi-square (χ2) correlation test, Multiple Linear Regressions (MLR), Paired-t-test (PTT), and Information Gain (IG) measures have been applied on the said data to extract the significant symptoms. It is important as one particular technique may not be able to identify all possible significant symptoms. Two multi layered feed forward neural networks (MLFNN) are then developed, such as MLFNN-1, where the inputs are the extracted significant symptoms and MLFNN-2 where the inputs are all ten symptoms. The objective is to note whether with significant symptoms MLFNN-1 could classify PMS cases as good as with all the symptoms. Experimental results show that by statistical analysis, four symptoms such as ‘Abdominal bloating’, ‘Confusion’, ‘Depression’, and ‘Social withdrawal’ are found to be significant, which are in turn fed into MLFFN-1. It is noted that MLFFN-1 is able to classify PMS cases with 70% of accuracy, which is very close to MLFNN-2, which can classify with the accuracy of 80% when fed with all ten symptoms. It proves that even with lesser information MLFFNs can diagnose complex diseases so efficiently.
Keywords: Automatic grading, Premenstrual syndrome, Statistical analysis, Neural network, Classification, Accuracy
Cite this paper: Subhagata Chattopadhyay, Sangeeta Bhanja Chaudhuri, Automatic Grading of Premenstrual Syndrome: Simulating the Manual Diagnosis Process, American Journal of Biomedical Engineering, Vol. 6 No. 3, 2016, pp. 78-85. doi: 10.5923/j.ajbe.20160603.02.
Article Outline
1. Introduction
- The art of high quality clinical diagnosis depends on (i) correct perceptions of doctors in the analysis of symptoms and (ii) pin-pointing significant symptoms without consuming much of time. Together, these constitute the ‘clinical eye’ of a medical doctor and are the measures of the quality of decision making [1]. It is a much complex manual task and requires high quality clinical exposure, expert supervision, and learning capability. However, the issue with such a process is that, because it is manual, there is a fair chance of biasness in the decision making process. This is fairly common in the clinical diagnosis.Psychiatric illnesses present with several subjective presentations, associated with multiple look-alike illnesses as a syndrome, and have uncertain courses [2]. Hence, these are very complex in nature and the diagnosis poses to be a true challenge to the medical doctors. There is a fair chance of ‘under’ and ‘over’ diagnoses leading to wrong management and increased sufferings of the patients. To avoid such unpleasant situations, doctors often rely on identifying significant or important symptoms, with which they proceed to make their initial diagnoses [3]. Premenstrual Syndrome (PMS) is a complex illness that presents with both gynecological and psychiatric symptoms, none of which could be directly measurable and hence its’ screening and grading often suffers accuracy [4]. The symptoms occur during the last week of a menstrual cycle and spontaneously remit after few days of onset of the bleeding; however, the symptoms can be of worst type to bring down the quality of life [4]. As mentioned before, in order to diagnose PMS grades, doctors thus attempt to mine significant symptoms among many and this is the most important task they perform to lay the diagnostic foundation. Data mining methods have been extensively applied in health sciences and though complexity is involved, psychiatry is of no exception. The key philosophy is to replicate the ways doctors mine significant symptoms to diagnose a disease [5-8]. However, only a few studies have been reported related to PMS research (see Table 1). The reasons behind such a less number of researches are (i) unavailability of the clinical data, (ii) lack of interdisciplinary skill sets among the researchers, and (iii) very small sample size. This is because of the fact that, less number of PMS cases is reported to the doctors, especially in a developing country like India, where the awareness level of such disorders is very low among women and more interestingly, often the awareness is completely absent. PMS cases are identified while interviewing the patients for the gynecological or psychological disorders. Hence, there are lots of scopes for undertaking and pursuing research in this multidisciplinary field, especially in the Indian context. Given this scenario, the focus of this article is to model this diagnosis process using statistical techniques (for significant symptom mining) and neural network approach (for diagnostic decision making). Rest of the article is organized as follows. Section 2 shows a brief state of relevant literature. Methodology is detailed in section 3. In section 4, results are discussed. Finally, the article is concluded and future research has been proposed in section 6.
|
2. Literature Review
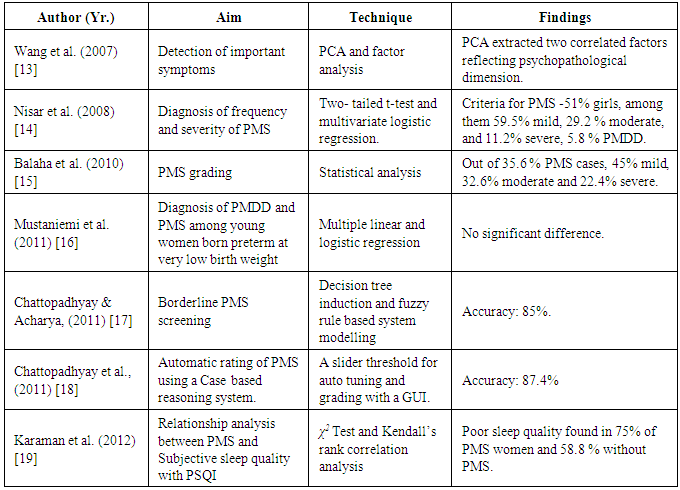
- Automating the psychiatric diagnosis has been attempted since decades [9, 10]. The key motivation behind such an endeavor is to reduce the bias related to manual diagnosis. Although there are several rating tools available, the scoring and interpretations are however manual process and the correctness depend on the interviewer’s skill set [11]. PMS has a long history for more than 80 years in the Western world. The notion that it is a type of clinical syndrome is exactly 60 years old [12]. It had been realized since 1931 when it was considered as a disorder. It was believed to be caused by progesterone deficiency or imbalance in estrogen-progesterone imbalance that might affect the brain functioning as well [12]. The detailed discussion is beyond scope in this paper. However, experienced medical experts could predict the existence of the syndrome by investigating the symptoms of the patients but there was hardly any mechanism to distinguish separately the PMS and Premenstrual dysphoric disorder (PMDD), which is more inclined towards the psychiatry domain [12].In 2007, Wang and his research group collected 632 data related to PMDD from menstruating college students. They divided the subjects into two equal parts and tested for PMDD with Principal Component Analysis (PCA) and factor analysis, respectively. With PCA (which gave better result), two factors correlating PMDD had been extracted, such as dysphoria and behavioral impairment. PCA also showed the best fit among three models tested by confirmatory factor analysis, adjusted goodness of fit indices (which was 0.95), and RMS error of approximation (which was as low as 3%). PCA therefore was able to extract two correlated factors that shows psychopathological dimension of PMDD [13].Another case studied by Nisar and his group (2006) was on unmarried medical students of age 18 to 25 years in the Isra University hospital [14]. PMS related data were collected on daily record of severity problems for two prospective cycles. According to the record, descriptive and inferential analysis was done using two-tailed test and multivariate logistic regression analysis. The result was that these techniques could distinguish ‘mild’ (59.5%), ‘moderate’ (29.2%), and ‘severe’ (11.2%) cases. The order of frequency of symptoms reported by them were anger, irritability, anxiety, tiredness, difficult concentration, mood swings, and physical symptoms such as, breast tenderness, general body discomforts etc. Their research showed that dysmenorrhea and family history of PMS syndrome were significantly associated with univariate and multivariate analysis [14].Balaha et al., (2010) studied 250 medical students at King Faisal University, Saudi Arabia for 6 months to note the factors responsible for PMS. Regression analysis was the key technique used. The study observed that out of 35.6% PMS cases, 45% were reported to be mild, 32.6% as moderate and 22.4% as severe, respectively. They found that PMS is associated with old aged ladies who might be living in rural areas and with a family history of PMS [15].Mustaniemi et al., (2011) conducted a study on 75 women having the history of preterm birth and very low birth weight [16]. The size of the control was taken as 95. The authors collected and assessed different kinds of symptoms before and after menses and studied their severity. They implemented multiple linear and logistic regression techniques and the p-values were greater than 0.1 which signifies that there is hardly any significant difference of the severity of the prevalence of PMDD and PMS between the ladies who were reported to born preterm with low birth weight and at term respectively [16]. Chattopadhyay and Acharya (2011) used decision tree induction and fuzzy logic to diagnose ‘borderline’ PMS cases as the term ‘borderline’ is very confusing to the medical doctors [17]. The principal aim of the study is the handle the uncertainty related to the term ‘borderline’ and specifically labeled those cases as either a ‘PMS’ or ‘no PMS’. Information gain measures the significant symptoms by which fuzzy production rules (prules) were constructed. Based on the firing strengths of the prules and a threshold, such cases are grouped under either ‘PMS’ or ‘no PMS’ cases with 85% of the average accuracy [17].In another study, Chattopadhyay et al., (2011) developed an automatic case-based reasoning tool for the screening and grading PMS cases [18]. The contribution of the tool is a graphical user interface and an auto-set tolerance (threshold) which is set according to the inputs (i.e. the symptoms with some loads between 0 and 1]). For the clustering task, k-Nearest neighborhood algorithm was used. The tool was able to screen and grade PMS cases with average accuracy of 87.4% [18]. Karaman et al., (2012) investigated the sleep quality in PMS [19]. The authors used PMS scale and Pittsburg Sleep Quality Index to acquire the data. Using 95% confidence interval, the authors have applied χ2 and Kendall’s rank correlation. Poor sleep quality had been observed in 75% of PMS cases [19]. From these literatures, it could be noted that PMS grading using neural network is yet to be studied. This is the key motivation behind the work. Another aim of this paper is to note the behavior of the network with two different sets of inputs, i.e., with (i) significant symptoms only and (ii) all symptoms keeping the number of processing (i.e., hidden) layer nodes as constant. In the following section, the methodology adopted in this study has been discussed.
3. Methodology
- The objective of this work is to (i) extract significant symptoms of PMS and (ii) develop two multi layered feed forward neural networks (MLFNN) classifiers, such as MLFNN-1, which is constructed with the significant symptoms only and the other (MLFNN-2) with all ten symptoms, respectively. Finally, the performances of these two networks are compared to note whether MLFNN-1 yields classification accuracy as good as MLFNN-2. To accomplish the task, the following steps are adopted (see Fig. 1).
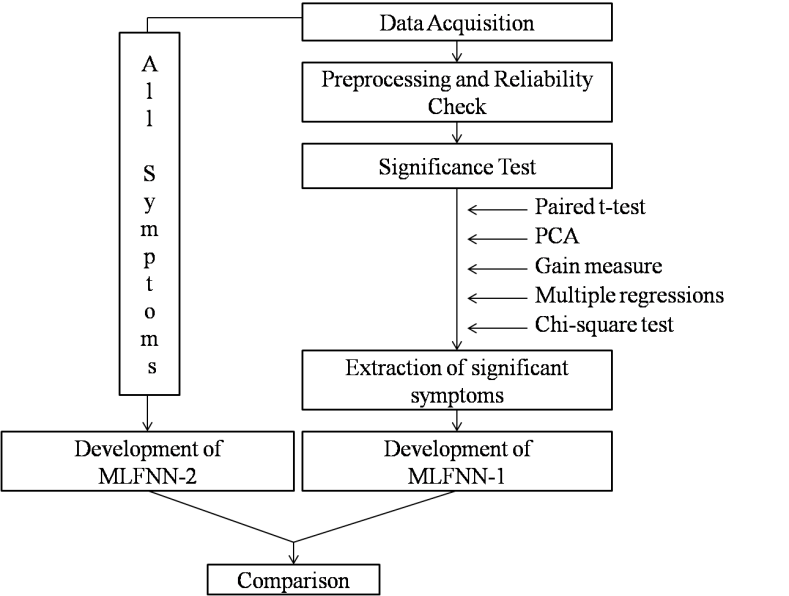 | Figure 1. Schematic diagram of the methodology |
 | Figure 2. An MLFNN topology (generic) |
4. Results and Discussions
- PMS data thus obtained, has been tested for normality and internal consistency tests to know the nature of data and its reliability. Fig.3 presents the normality plot, which denotes that the data closely follow the normal distribution (mean of average = 0.4899 and mean of standard deviations = ±0.2893). Cronbach’s α is 0.77, which is higher than the stipulated threshold [27]. There is no outlier, as evident by the kurtosis values <3 (mean = 1.8163±0.1183) for all the symptoms/features. Four symptoms show negative skewness, such as (3), (4), (7) and (9). Rest of the symptoms is positively skewed.
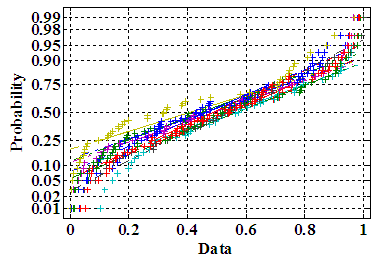 | Figure 3. Normality plots for 10 symptoms |
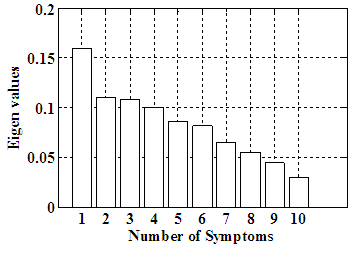 | Figure 4. Eigen values for ten symptoms |
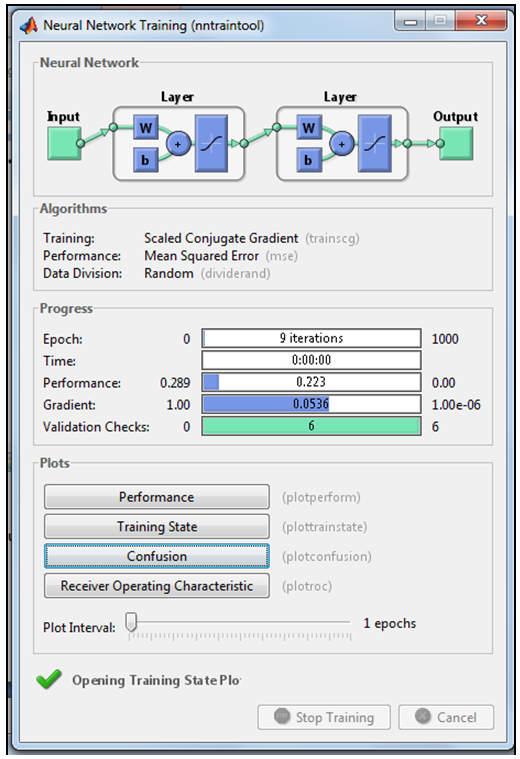 | Figure 5. Running MLFNN-1 in the neural net GUI in Matlab |
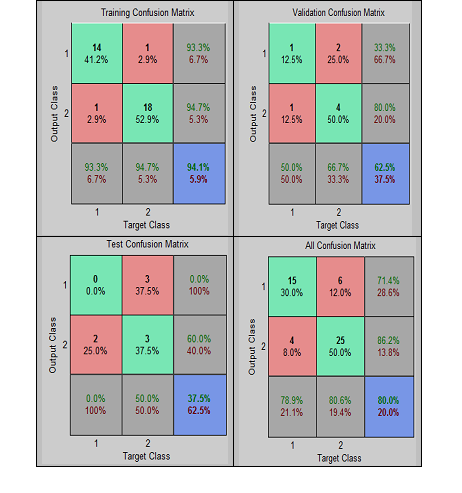
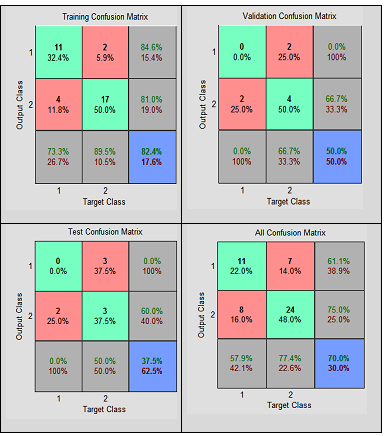 | Figure 6. Confusion matrices showing the performances of MLFNN-1 |
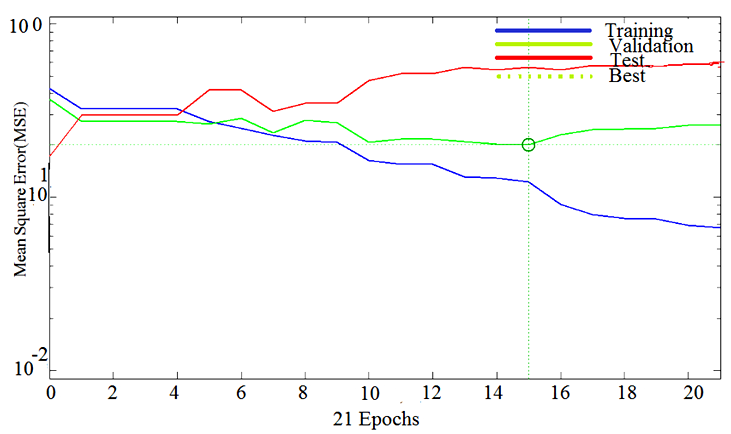
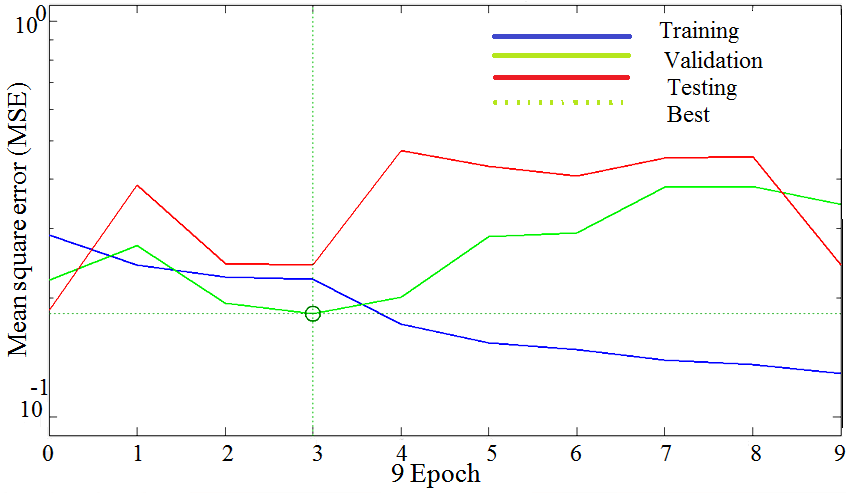 | Figure 7. Training, testing and validation plots with MLFNN-1 |
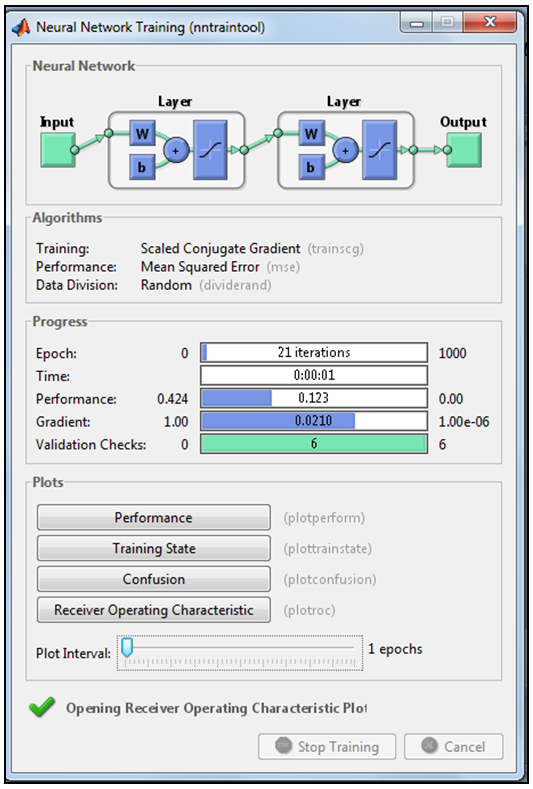 | Figure 8. Running MLFNN-2 in the neural net GUI in Matlab |
 | Figure 9. Confusion matrices showing the performances of MLFNN-2 |
 | Figure 10. Training, testing and validation plots with MLFNN-2 |
5. Conclusions and Future Work
- In this paper, we have automated the grading of PMS using two neural networks – MLFNN-1 (constructed with significant symptoms, such as ‘Abdominal bloating’, ‘Confusion’, ‘Depression’, and ‘Social withdrawal’, extracted statistically) and MLFNN-2 (developed with all ten symptoms). The study observes that MLFNN-1 is able to diagnose the grades with 70% overall accuracy rate. While, the accuracy increases to 80% with MLFNN-2. It is worth mentioning that high accuracies obtained during training has contributed mostly in the ‘overall’ accuracy measure, which proves that even with smaller samples, MLFNN is able to learn the exemplary patterns quite well. It supports the proposed hypothesis that MLFFNNs can be efficiently used for even grading complex illnesses.The limitation of the study is that due to small sample size testing and validation results are not so encouraging. Small sample size is due to the fact that even clinical diagnoses of PMS cases are quite a challenge in real life scenario [17]. However, this could be avoided by taking a larger sample, which is a time consuming task, which the authors are still pursuing.The study finally concludes that feed forward neural networks are suitable techniques to grade even complex illnesses, such as PMS. It is also able to handle a smaller sample size for training, which is important to make it efficient. The authors would validate the tool on a larger test sample, when available. The principal aim is to develop a full-fledged screening and grading tool of PMS for the real-life use.
ACKNOWLEDGMENTS
- The authors acknowledge the gynecologists and psychiatrists, who have provided the PMS data to conduct this interdisciplinary study.