-
Paper Information
- Paper Submission
-
Journal Information
- About This Journal
- Editorial Board
- Current Issue
- Archive
- Author Guidelines
- Contact Us
American Journal of Biomedical Engineering
p-ISSN: 2163-1050 e-ISSN: 2163-1077
2016; 6(2): 59-69
doi:10.5923/j.ajbe.20160602.03

A Comparison between Different Segmentation Techniques used in Medical Imaging
 Abstract
 Reference
 Full-Text PDF
 Full-text HTML
Ibtihal D. Mustafa 1, Mawia A. Hassan 2
1Medical Engineering Department, University of Science and Technology, Omdurman, Sudan
2Biomedical Engineering Department, Sudan University of Science and Technology, Khartoum, Sudan
Correspondence to: Mawia A. Hassan , Biomedical Engineering Department, Sudan University of Science and Technology, Khartoum, Sudan.
| Email: |  |
Copyright © 2016 Scientific & Academic Publishing. All Rights Reserved.
This work is licensed under the Creative Commons Attribution International License (CC BY).
http://creativecommons.org/licenses/by/4.0/

Tumor segmentation from MRI image is important part of medical images experts. This is particularly a challenging task because of the high assorting appearance of tumor tissue among different patients. MRI images are advance of medical imaging because it is give richer information about human soft tissue. There are different segmentation techniques to detect MRI brain tumor. In this paper different procedure segmentation methods are used to segment brain tumors and compare the result of segmentations by using correlation and structural similarity index (SSIM) to analyses and see the best technique that could be applied to MRI image.
Keywords: MR, Segmentation, Correlation, Structural similarity
Cite this paper: Ibtihal D. Mustafa , Mawia A. Hassan , A Comparison between Different Segmentation Techniques used in Medical Imaging, American Journal of Biomedical Engineering, Vol. 6 No. 2, 2016, pp. 59-69. doi: 10.5923/j.ajbe.20160602.03.
Article Outline
1. Introduction
- MRI is a non-invasive and good soft tissue contrast imaging modality, which provides invaluable information about shape, size, and localization of brain tumors without exposing the patient to a high ionization radiation. In current clinical routine, the images of different MRI sequences are employed for the diagnosis and delineation of tumor compartments. Due to the large amount of brain tumorimages that are currently being generated in the clinics, it is not possible for clinicians to manually annotate and segment these images in a reasonable time. Hence, the automatic segmentation has become inevitable. The requirement for accurate segmentation is very important as the clear location, size and volume of unhealthy tissue is crucial for treatment e.g. radiation treatment.Image Segmentation is a process of subdividing an image into its constituent’s parts or objects in the image i.e. set of pixels, pixels in a region are similar according to some homogeneity criteria such as color, intensity or texture so as to locate and identify boundaries in an image [1]. Over the last two or three decades, plenty efforts have been focusing on the segmentation process. There are so many image segmentation surveys have been conducted [2, 3]; however, there are very few who have presented how researchers can evaluate one technique against the other on a domain of their segmentation. These show that image segmentation is still a very hot area of research and is still a challenging task for researchers and developers to develop a universal technique for image segmentation. Our driving application in this paper is the segmentation of brain tissue and tumors from two-dimensional magnetic resonance imaging (MRI). Our goal is a high-quality segmentation of healthy tissue and a precise delineation of tumor boundaries using different segmentation techniques based and compare the definition of the tumor using MATLAB as technical tool on MR human brain tumor.
2. Segmentation Method
- Various segmentation algorithms for the MRI of Brain images by using MATLAB R2014a have been implemented in this paper. These segmentation algorithms assimilate computation, visualization, as well as programming in an easy-to-use environment where problems and solutions are expressed in familiar mathematical notation. MATLAB features a family of application specific solutions called toolboxes. The MATLAB toolboxes permit you to learn and apply specialized technology. Toolboxes are inclusive collections of MATLAB functions (M-files) that extend the MATLAB environment to solve particular classes of problems. Areas in which toolboxes are accessible include signal processing, control systems, fuzzy logic, neural networks, wavelets, simulation, and numerous others. There are several types of segmentation techniques that are developed to process the medical image.
2.1. Thresholding
- This technique is based on a threshold value to turn a gray-scale image into a binary image [4]. In this technique image is segmented by comparing pixel values with the predefined threshold limit L [5]. The equation to define the threshold level is given by:
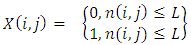 | (1) |
 | Figure 1. Block diagram of global threshold |
2.2. K means Clustering
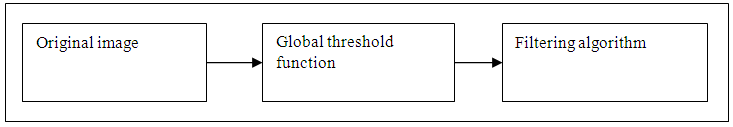
- K-means is one of the simplest unsupervised learning algorithms. This algorithm easy to solve the well-known clustering problem. The procedure follows an easy way to classify a given data set through a different number of clusters k clusters) fixed a priori. [7].After reading and display the original image by the MATLAB, specify the structural element desk with diameter 20 and reconstruct the image, then again reconstruct the output by and then complement the result, because the k means cluster depend on data set (randomly) it was needed to remapping the image into vector, after that determined the number of cluster equal 7, reshaping into image, and then create image segment, the last steps extracting the tumor. The steps that are used the k-means clustering are shown in (figure 2).
 | Figure 2. The block diagram of k-means clustering |
2.3. Fuzzy C Means Algorithm
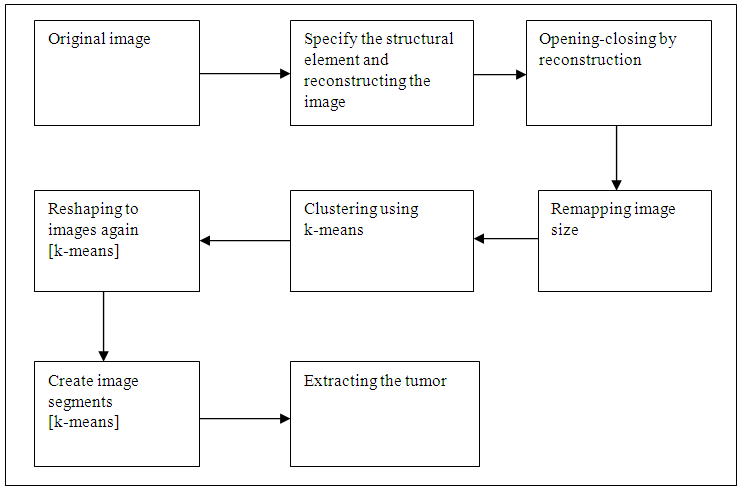
- The aim of a clustering analysis is to divide a given set of data into a cluster, which represents subsets or a group. The partition must have two properties, the first one is homogeneity inside clusters data, which should be as homologous as possible, and the second one is heterogeneity between the clusters data. Which belongs to different clusters, and this should be as different as possible [8].The steps of fuzzy c means are the same steps of k means clustering, but in fuzzy we determinate the initial points. In this paper abbreviation of codes after read and display the image, then double fuzzy c means algorithm was applied and the function (the first time returns a segment which labels the tumor with different color intensity and the second one segment the tumor) by clustering equal 7. Finally, the last steps were enhancement by applying morphological filtration and creating structural element using disk with diameter of 4, the block diagram below was shown the steps fuzzy c mean (figure 3):
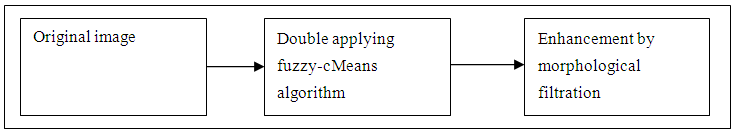 | Figure 3. The block diagram of fuzzy c means |
2.4. Watershed Segmentation
- Watershed deals with group of pixels, and it is an algorithm based on integrator. Watershed algorithm is based on morphological process mixed with edge based segmentation to yield a hybrid technique [9].Figure 4 shows the block diagram which describes the steps in details:
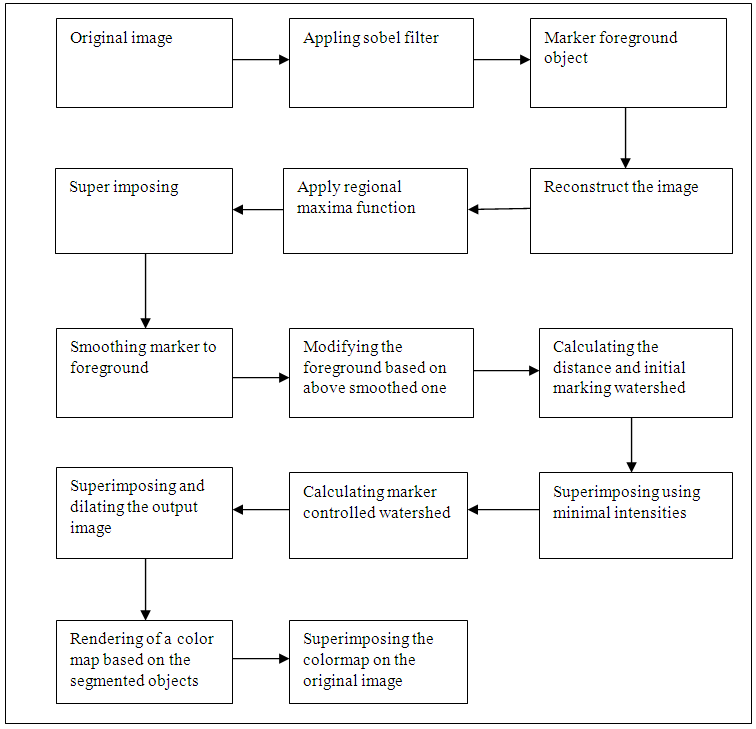 | Figure 4. Show the watershed in details |
2.5. Morphological Based Segmentation
- Morphological or morphology image process [10] describes a range of image processing techniques that deal with the shape the operation typically applied to remove demerit that introduced during segmentation, and so typically operate on bi-level images [11]. Morphological used operation in boundary extraction, Region filling, extraction of connected components, thinning/thickening, skeletonisation, opening and closing [12]. All morphological processing operations are based on these simple ideas [11]. Structuring elements can be any size and make any shape. Basically morphological image processing is very like spatial filtering and the structuring element is moved across every pixel in the original image to give a pixel in a new processed image [13]. The steps are shown in figure below in details:
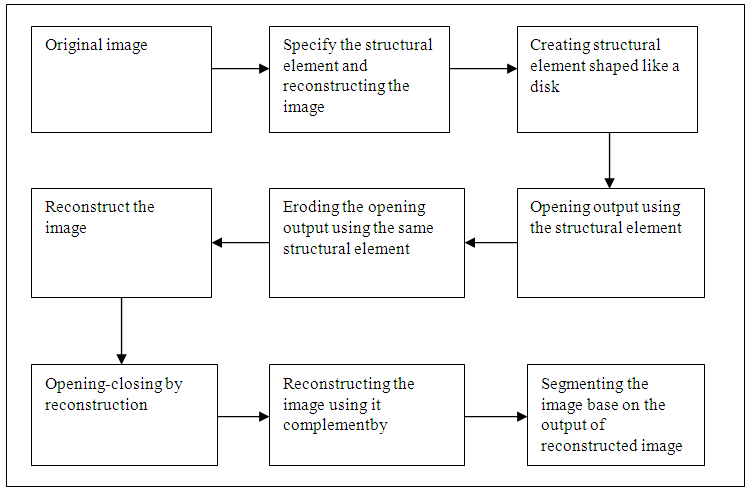 | Figure 5. Block diagram of morphological |
2.6. Region Seed Growing
- This requires a seed point that is selected by the user and removes all pixels connected to the Preliminary seed. It is a used for extracting an image region that is connected based on some predefined criterion. These conditions of selected it is can be based on intensity information or boundaries in the image [14]. The manual selected dealings to obtain the seed point is the great disadvantage for this region growing. The region that needs to be extracted, a seed must be planted but split-and-merge is an algorithm related to region growing, but it does not require a seed point [15, 16]. Region growing has also been restriction to sense to noise that causing extracted regions to have holes. These problems may overcome by using a hemitropic region-growing algorithm [17].After the read and display the DICOM image on the MATLAB. The first step in this process to achieve the region seed growing is to specify the seed starting region including (getting user input and flooring) the X and Y to real numbers. This is followed by processing the image seed with starting point including apply region seed growing segmentation with maximum intensity distance of 0.2. This method of segmentation is described in the (figure 6).
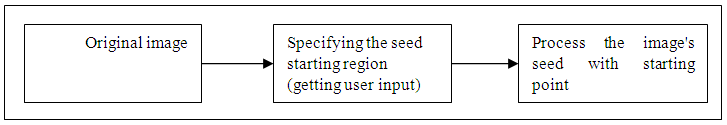 | Figure 6. The block diagram of region seed growing |
2.7. Parametric Deformable Model
- There are two type of deformable model parametric and geometric. In parametric deformable model clearly move predefined snake points based on an energy minimization scheme [18]. The deformation play climactically role in representation or shape such as balloon force, topology snake, and distance snake. In 2-D the snake can be define by curve the energy usually formed by internal forces and external forces [19] as,
 | (2) |
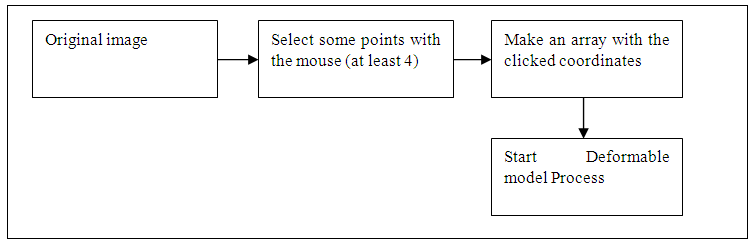 | Figure 7. Block diagram of parametric deformable model |
3. Result
- The DICOM image of MR brain used to implement the codes were downloaded from the math works website. This image doesn't need to apply preprocess. The results of the image is shown below with steps.
3.1. Thresholding
- After apply the global threshold function in figure (8) b show the some of background have the same of tumor then apply filtration algorithm the figure below show that:
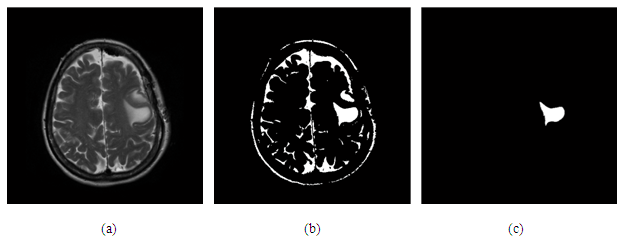 | Figure 8. (a) original image, (b) apply global threshold function, (c) after apply filtration algorithm |
3.2. K Means Clustering
- The figure below show the result after determination the cluster=7 and shows the segmented that created by cluster.
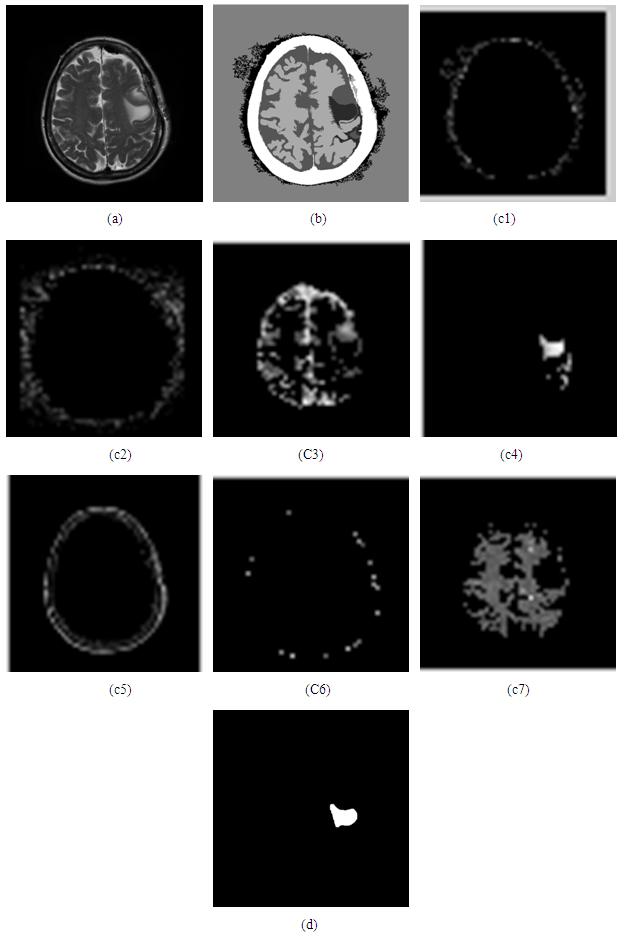 | Figure 9. (a) Original image, (b) image labeled by cluster index=7, (c1, c2, c3, c4, c5, c6, c7) created segment image (d) the result after extracting the image |
3.3. Fuzzy c Means Algorithm
- Figure (b) show the segmented by cluster = 7 and apply the double fuzzy c means algorithm, in (c) show the result after enhancement:
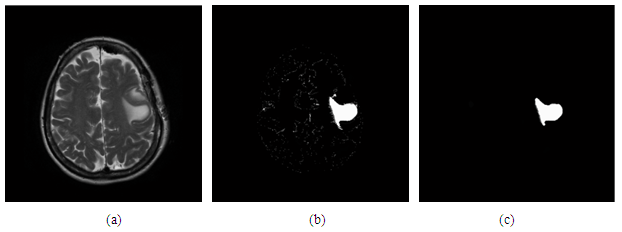 | Figure 10. (a) Original image, (b) after apply double c means algorithm (c) enhancement filtration by opening structural element |
3.4. Watershed Segmentation
- The figure below shows the steps of resultant segment:
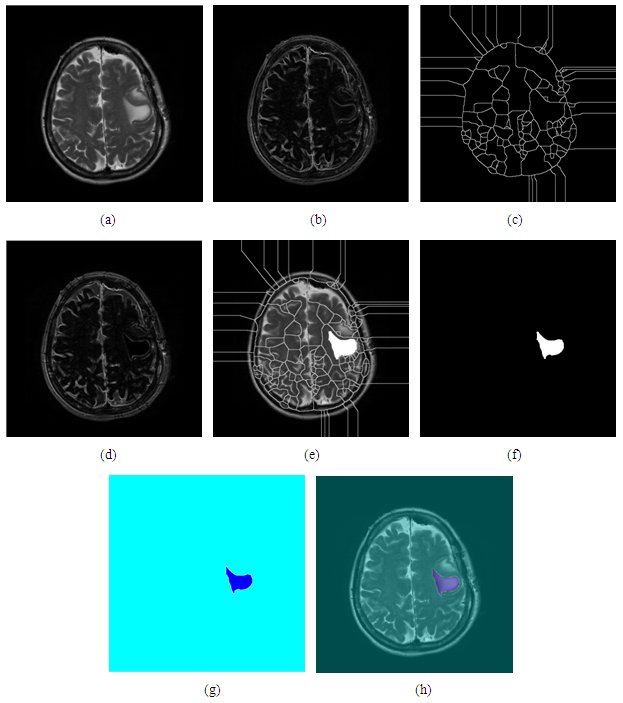 | Figure 11. (a) Original image, (b) apply sobel filter and then calculate gradient magnitude, (c) Watershed rigid line after calculating the distance, (d) Super imposing an image, (e) Marker and object boundaries superimposed on original image, (f) the result of segment, (g) After colored watershed label matrix, (h) superimposing to original image |
3.5. Morphological Based Segmentation
- In figure below show the morphological segmenting result:
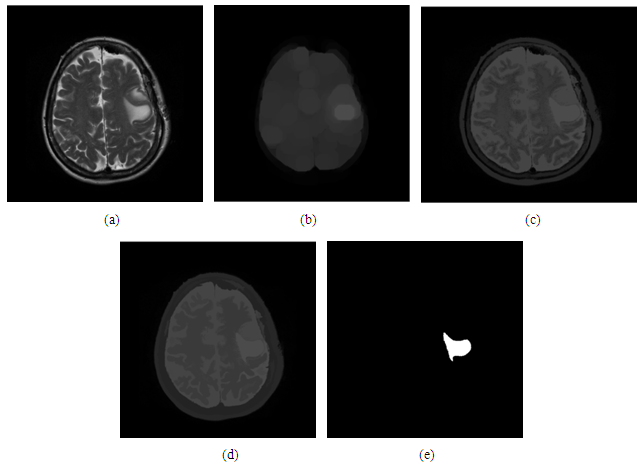 | Figure 12. (a) Original image, (b) using opening function, (c) reconstruct by opening, (d) after apply opening by closing reconstruct, (e) the result after segment the image |
3.6. Region Seed Growing
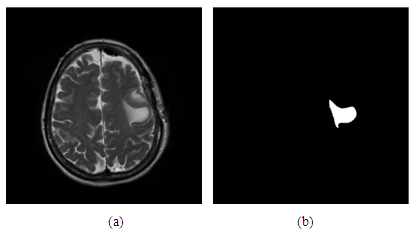 | Figure 13. (a) Original image, (b) the result after process the starting point |
3.7. Parametric Deformable Model
- In figure (d) below show the overshoot of balloon force because this image used it is not 3D.
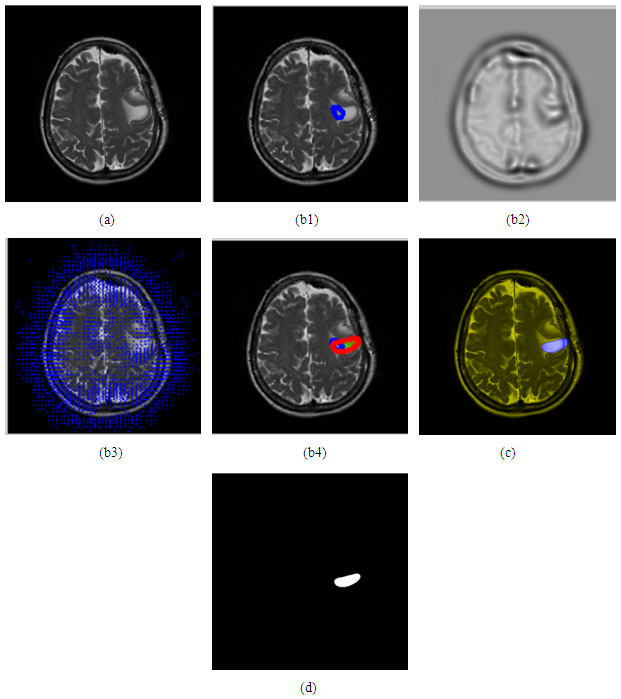 | Figure 14. (a) original image, (b) description of snake movement (b1 image with initial counter, b2 the external force ,b3 the external force field, b4 snake movement), (c) colored and imposing to original image, (d) the result |
|
|
|
|
|
|
|
4. Discussion
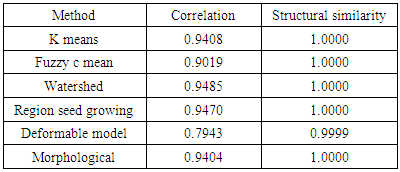
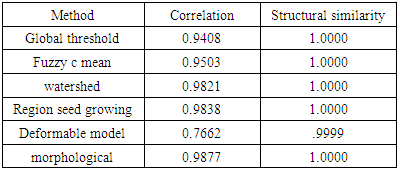
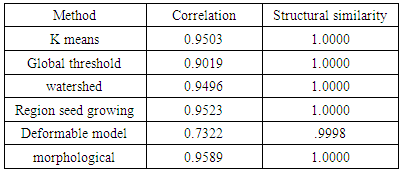
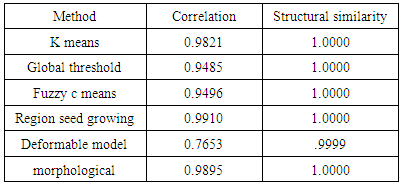
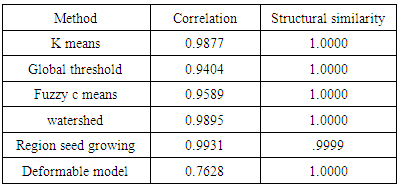
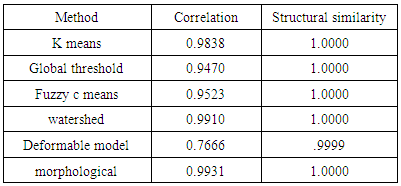
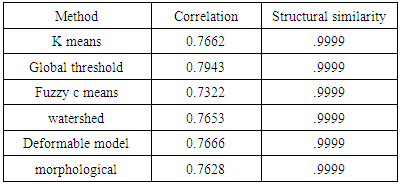
- We have presented different segmentation techniques of brain tissue in MR image. These techniques were employed to evaluate for their effectiveness as a tool for segmentation based on physical and structural similarities. Our results show that the deformable method was the lowest of all the techniques used in this paper because the image that used in this paper is 2D. In figure 14 (d) show the overshooting that acquiring by snake movement when the balloon forces movement with clockwise and the structural similarity (SSIM) is very evident because the different of masks unable to differentiate the boundaries. Our result show that best methods or algorithms that gives better segmentation with physical and structural similarity is region seed growing. The fuzzy c means also comparable results.
5. Conclusions
- This paper has provided the state of the art MRI-based brain tumor segmentation methods and comprehensive comparison of different segmentation techniques. An MR image size of 512x512 with GBM tumor has been used in this study. Prior to segmentation no pre-processing of the image was required to correct for background as the image had very low noise. The segmentation techniques that are compared in this paper includes: the global threshold, k means clustering, fuzzy c means algorithm, watershed, morphological, region seed growing, and deformable model. The accuracy of localization, shape and size of the input image is compared against the processed output images based on statistical parameters of correlation and structural Similarity index (SSIM). The closeness of the region of interest between the original image and the output was compared using the correlation and structural similarity index (SSIM). The correlation coefficient value of +1 and −1 in our result indicate that the regions of interest are highly similar and dissimilar respectively. The value of 1 is only achievable if the two sets of data are identical (see tables). Our results show that seed region growing method offers best imaging segmentation technique.