-
Paper Information
- Previous Paper
- Paper Submission
-
Journal Information
- About This Journal
- Editorial Board
- Current Issue
- Archive
- Author Guidelines
- Contact Us
American Journal of Biomedical Engineering
p-ISSN: 2163-1050 e-ISSN: 2163-1077
2016; 6(1): 32-41
doi:10.5923/j.ajbe.20160601.05

Statistical Analysis of EEG Signals in Wavelet Domain for Efficient Seizure Prediction
 Abstract
 Reference
 Full-Text PDF
 Full-text HTML
Mostafa I. El Sayeid1, Entessar Gemeay1, Salah Khames1, Turkey Alotaiby2, Saleh A. Alshebeili3, Fathi E. Abd El-Samie4
1Faculty of Engineering, Tanta University, Tanta, Egypt
2KACST, Kingdom of Saudi Arabia
3Electrical Engineering Department, KACST-TIC in Radio Frequency and Photonics for the e-Society (RFTONICS), King Saud University, Kingdom of Saudi Arabia
4Faculty of Electronic Engineering, Menoufia University, Menouf, Egypt
Correspondence to: Mostafa I. El Sayeid, Faculty of Engineering, Tanta University, Tanta, Egypt.
| Email: |  |
Copyright © 2016 Scientific & Academic Publishing. All Rights Reserved.
This work is licensed under the Creative Commons Attribution International License (CC BY).
http://creativecommons.org/licenses/by/4.0/

Epilepsy is an electrophysiological disorder of the brain, characterized by recurrent seizures. Electroencephalogram (EEG) is a test that measures and records the electrical activity of the brain, and is widely used in the prediction and analysis of epileptic seizures. This paper provides a statistical analysis associated with EEG signals assuming that these signals can be categorized into inter-ictal, pre-ictal, and ictal states. We study histograms and cumulative histograms for segments of various signal states, in wavelet domain by utilizing different signal processing tools such as the differentiator and median filtering, as well as the local mean, and local variance estimators. The results show that signal states could be distinguished according to statistics in the wavelet domain.
Keywords: EEG, Wavelet domain, Seizure prediction, Statistical analysis
Cite this paper: Mostafa I. El Sayeid, Entessar Gemeay, Salah Khames, Turkey Alotaiby, Saleh A. Alshebeili, Fathi E. Abd El-Samie, Statistical Analysis of EEG Signals in Wavelet Domain for Efficient Seizure Prediction, American Journal of Biomedical Engineering, Vol. 6 No. 1, 2016, pp. 32-41. doi: 10.5923/j.ajbe.20160601.05.
Article Outline
1. Introduction
- Epilepsy is actually the most common neurological ailment impacting on 50 million people world-wide, 85% of which belong to the developing nations. About 2.4 million new cases happen annually around the world. At least, 50% of the epileptic cases start at childhood or adolescence [1]. There were many trials for human brain discovery utilizing EEG signals. These kinds of signals are obtained through a brain computer interface (BCI) constructed with electrodes. If theses electrodes are placed touching the brain surface, intracranial Electrocorticography (iEEG) signals are acquired. In contrast, for outside electrodes [2], we obtain Stereo Electrocorticography (sEEG) signals. iEEG signals are obtained using an invasive techniques, while sEEG signals are obtained via non-invasive techniques [2]. EEG signals are, in general, of multi-band nature. Using the signal power in each sub-band or signal features, an EEG signal classification procedure can be carried out for various applications such as seizure detection and prediction. Seizure detection can be a popular medical application for EEG signal processing. The goal of this technique is to execute an off-line information acquisition through recorded EEG signals for patients [3].A vast majority of signal processing tools, especially transform domain tools, have been investigated for seizure detection. One of these transforms is the wavelet transform [4, 5], which will be used in this paper .Seizure prediction is a more challenging task to be performed online. For correct prediction, EEG signals need to be divided into three different classes. These classes are inter-ictal (normal state), pre-ictal (pre-state), and ictal (seizure state). The objective of this paper is to study the statistical characteristics of different EEG signal batches in the wavelet domain in order to classify the signal batches into each of these states. Section II of the paper discusses the seizure detection algorithms. Section III discusses the seizure prediction process with its limitations. Section IV presents the statistical tools that are utilized for EEG signal batch analysis. Section V presents the experimental results. Finally, the concluding remarks are given in section VI.
2. Wavelet-Domaim Seisure Detection
- Seizure detection is a sort of anomaly detection in EEG signals to identify the occurrence of a seizure as shown in Fig. (1). Feature extraction and signal modeling techniques have been used for wavelet-domain seizure detection, leading to detection results below the required levels. To enhance detection results, Rana et al. [9] adopted a frequency-domain technique for seizure detection using phase slope index over the whole EEG bands. Based on this index value, a decision of seizure or non-seizure can be made. Khamis et al. [10] have also presented a trial for seizure detection based on a frequency-domain signature. Wavelet transform has been extensively used for seizure detection, because it decomposes the EEG signal batches into sub-bands. From these sub-bands, different features such as wavelet coherence, entropy, energy, amplitude, and coefficient of variation can be extracted and used for state classification [6-8].
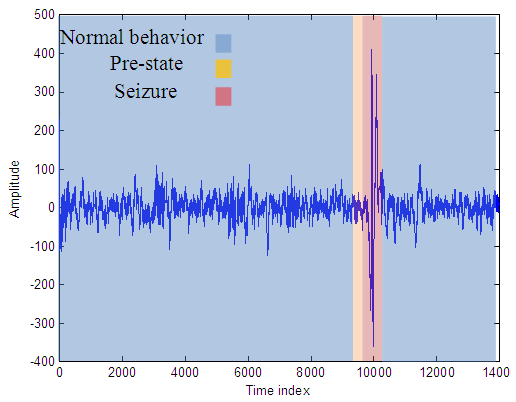 | Figure 1. An EEG signal containing a seizure |
3. Wavelet-Domaim Seizure Prediction
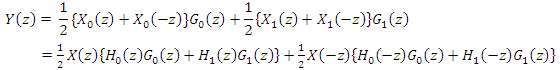
- Wavelets have been widely used in the field of EEG signal analysis, especially for seizure detection and prediction. The wavelet transform in itself can be regarded as some sort of sub-band decomposition, but with down sampling. The wavelet transform can be implemented on analog as well as digital signals. We are more interested in the DWT. The DWT can be implemented with low-pass (LP) and high-pass (HP) filtering in addition to a decimation process, and it must be invertible [11]. The DWT can be implemented with a single level or multi levels. For the multi-level wavelet decomposition, further decompositions up to the required level are performed on the low-pass branch, only. Another implementation of wavelet analysis is the wavelet packet transform, which performs further decomposition on the low-pass and high-pass branches. The wavelet decomposition and reconstruction filters H0, H1, G0, and G1 must satisfy the perfect reconstruction (PR) condition.
 | (1) |
 | (2) |
 are the wavelet coefficients. The sequence
  is the coarser-resolution signal for a high-level decomposition. The authors experimented lower and higher numbers of levels and found that five levels are the optimum choice.
4. Seizure Predection Process
- Seizure prediction is an online process with a target of forecasting the occurrence of epileptic seizures. Up to this moment, there is no ground truth for seizure prediction. All what have been done is just trials assuming that there is pre-ictal and ictal states in EEG signals. Arabi and He presented a seizure prediction method based on chaos theory concepts [11]. They used correlation dimension, correlation entropy, noise level, Lempel-Ziv complexity and largest Lyapunov exponent as features to be extracted from EEG signal batches in time domain for the classification purpose. Wang et al. utilized an adaptive learning system combined of enforcement learning, online monitoring, and adaptive control theory for seizure prediction [12]. For all of these algorithms, the success rates remain unsatisfactory. Hence, there is a need for prediction algorithms with better efficiency.
5. Statistical Signal Processing Tools
5.1. Histogram
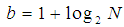
- Histogram is a mathematical representation of the counts of observations that fall into disjoint categories (bins) of the amplitudes of the discrete signal at hand. Histogram will be calculated for the wavelet transform of different inter-ictal, pre-ictal, and ictal segments for possible discrimination between their amplitudes. For estimating the number of histogram bins, several studies have been presented. Struges estimated the number of bins in the histogram as [13]
 | (1) |
 is the number of bins and
  is the number of segment samples (observations). An estimate for the bin width of the histogram was presented by Scott as [14]:
 | (2) |
 is the bin width,
  is the standard deviation of the data, and
  is the number of samples. Another bin width estimator was presented by Freedman and Diaconis as [15]:
 | (3) |
 is the sample inter-quartile range defined as the difference between the upper and lower quartiles [16].In this paper, we adopted a unified bin width for all segments in each experiment for comparison purposes.
 5.2. Cumulative Histogram
- Cumulative histogram is some sort of mapping, which counts the cumulative number of observations in all bins up to the one at hand. It is represented as
 | (4) |
 is the histogram value at bin j. Cumulative histograms will be estimated for the obtained histograms of all signal segments for comparison purposes.
 5.3. Differentiator Filter
- In EEG signals, abnormal activities are accompanied with abrupt changes in signal amplitude. To reinforce these abrupt changes, signal differentiator tools can be utilized. We use a digital first-order differentiator filter for this purpose. This filter is given by [17]:
 | (5) |
5.4. Local Mean
- We can estimate the local mean of a signal X(n) as follows [21]:
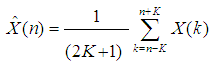 | (6) |
 is the number of samples in the short segment used in the estimation.
 5.5. Local Variance
- We can estimate the local variance of a signal X(n) as follows [18]:
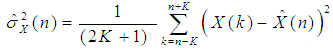 | (7) |
5.6. Median Filtering
- Median filtering is a sort of nonlinear smoothing of signals. It aims at reducing some of the spikes in signals that may occur due to impulsive noise. In the median filtering process, the middle value after sorting is extracted. For a median filter of length
 , the filter output is given as [19]:
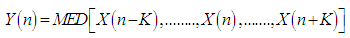 | (8) |
 and
and  are the nth samples of the input and output sequences, respectively. This type of median filtering is non-recursive in the sense that an estimate of the median filter output at any sample time is independent of the median filter output history. There is another type of median filtering which is recursive. For a recursive median filter with window length
  , the output is defined as [19]:
 | (9) |
6. Experimental Results
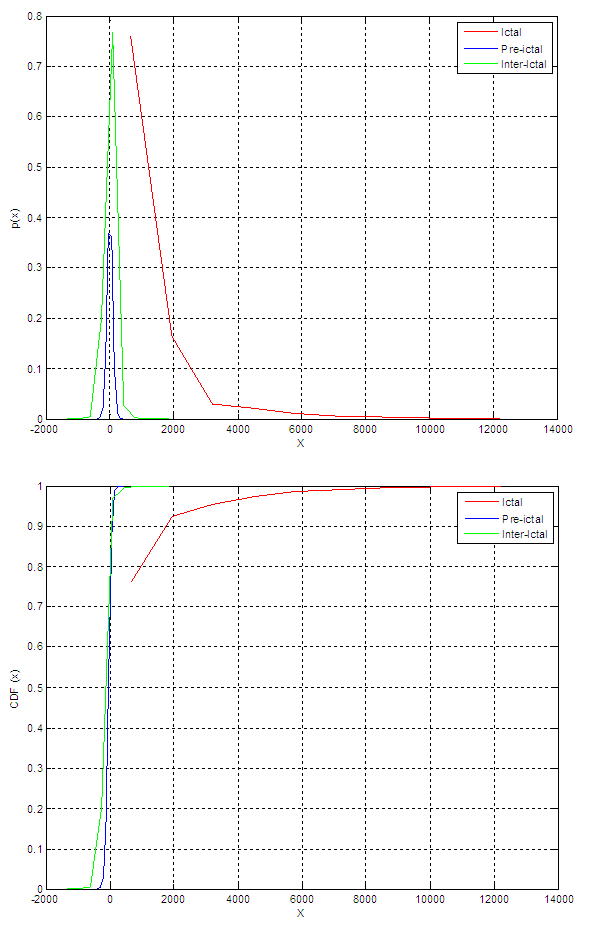
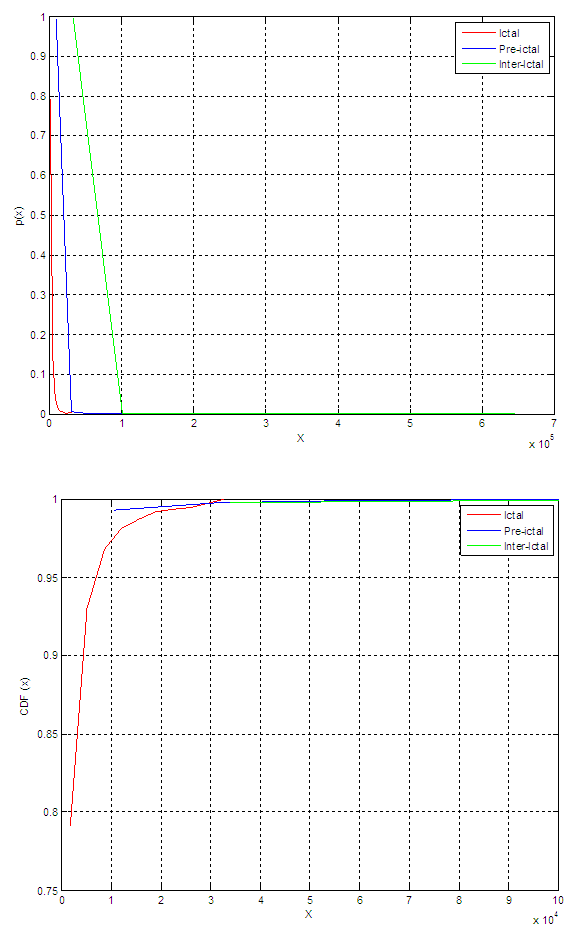
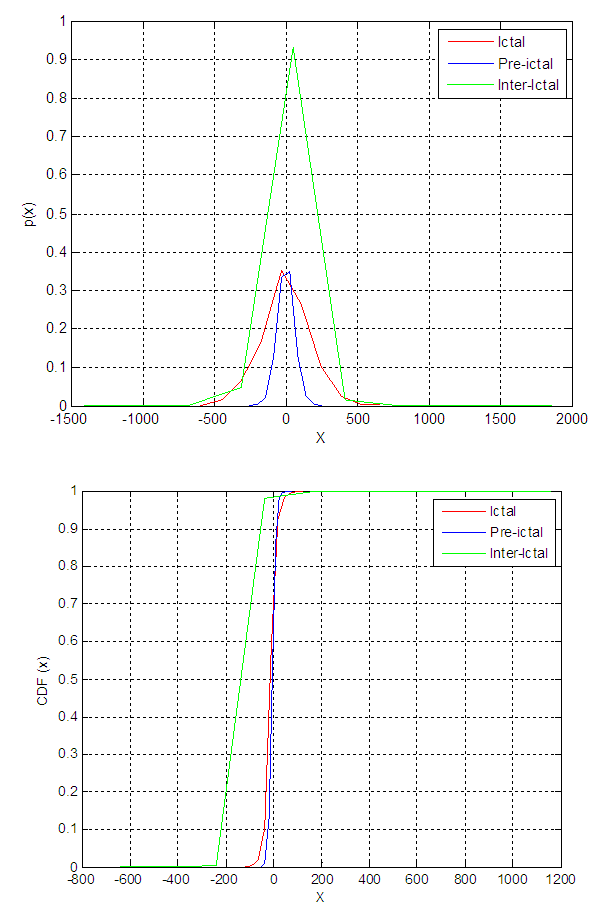
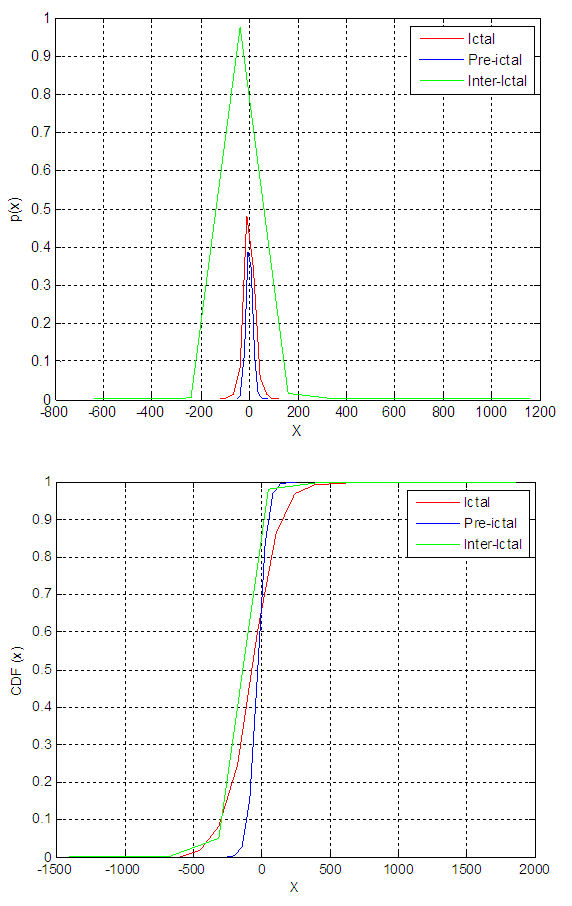
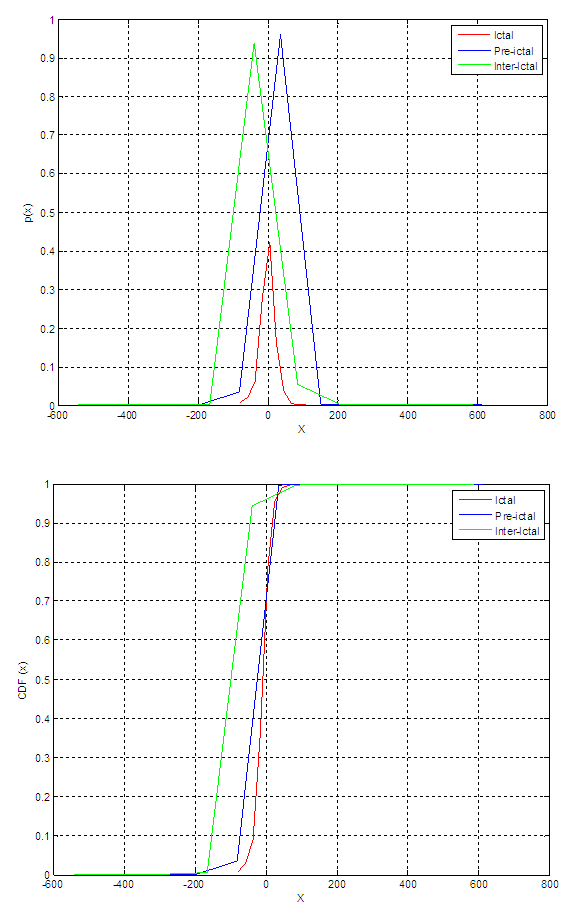
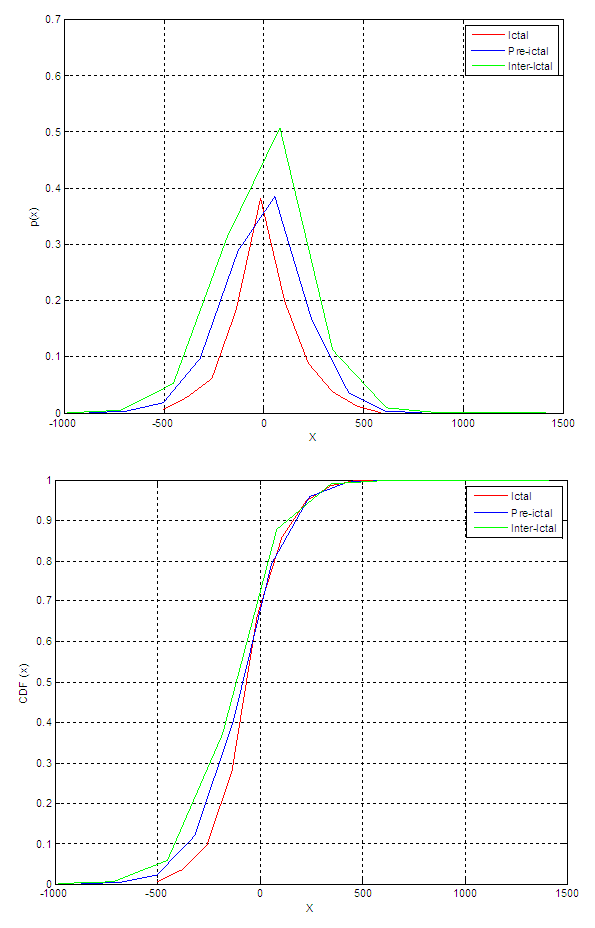
- In this study, we have used the data for four patients from CHB-MIT database to discriminate between ictal, pre-ictal and inter-ictal segments based on probability density function and cumulative distribution function from different signals attributes such as local mean, local variance, derivative, and local median. Figure (2) shows an hour of EEG containing seizure. The probability density functions and cumulative distribution functions results are given in Figs. (3) to (10) for different patients. These results reveal that it is possible to set a threshold on PDF amplitude or CDF horizontal axis that can be used to discriminate between inter-ictal and pre-ictal states, which enables seizure prediction.
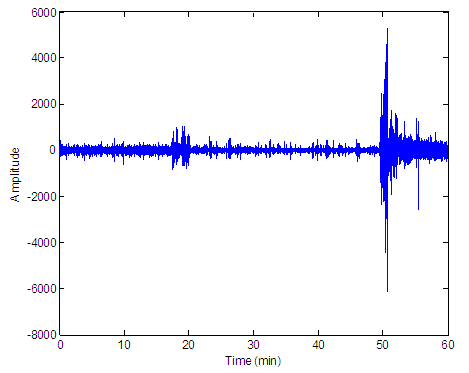 | Figure 2. Hour 29 of channel 1 for patient 19 from MIT-CHB database |
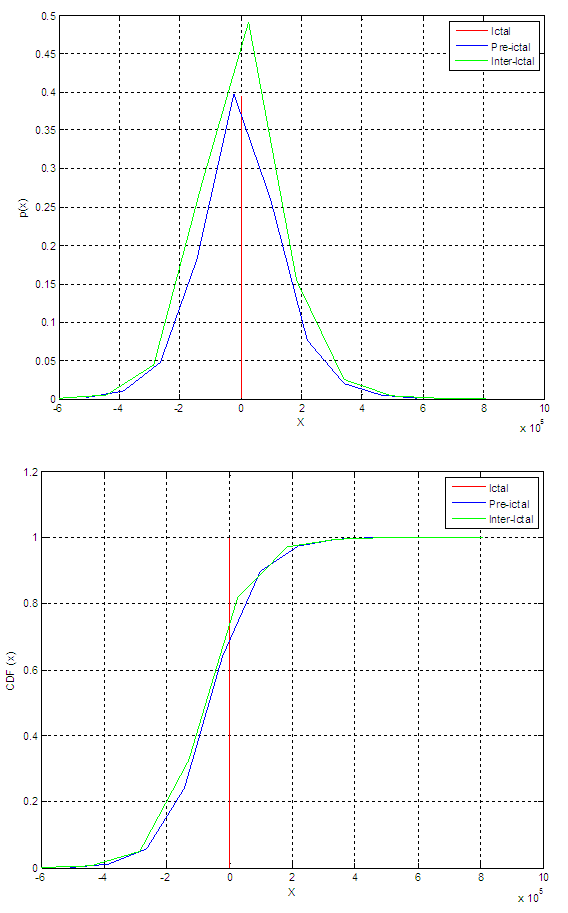 | Figure 3. PDF and CDF for the derivative of the signal approximation for patient 19 |
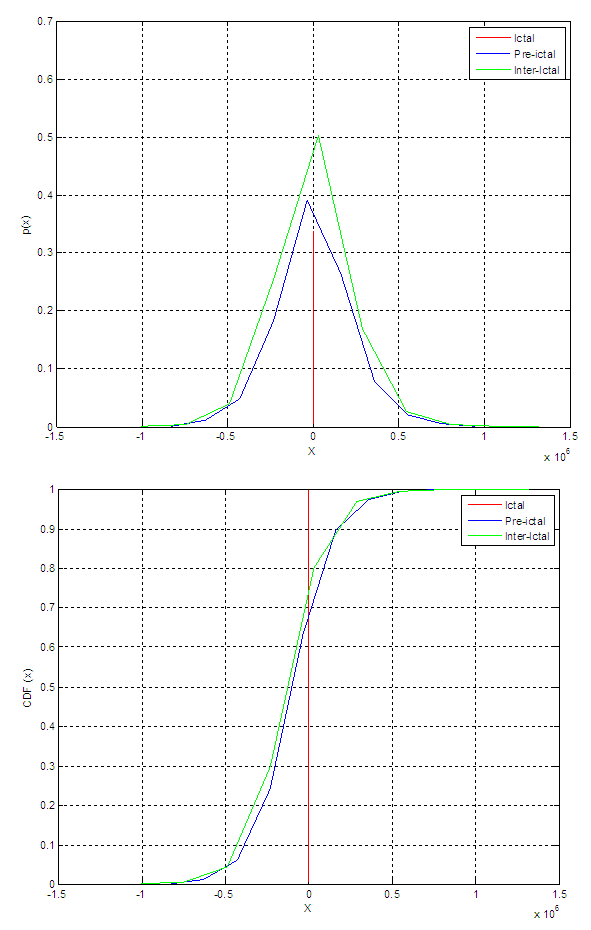 | Figure 4. PDF and CDF for the local mean of the signal approximation for patient 19 |
 | Figure 5. PDF and CDF for the local median of the signal approximation for patient 19 |
 | Figure 6. PDF and CDF for the local variance of the signal approximation for patient 19 |
 | Figure 7. PDF and CDF for the amplitude of the signal details for patient 19 |
 | Figure 8. PDF and CDF for the amplitude of the signal approximation for patient 1 |
 | Figure 9. PDF and CDF for the amplitude of the signal details for patient 14 |
 | Figure 10. PDF and CDF for the amplitude of the signal approximation for patient 14 |
7. Conclusions
- In this paper, we have presented a statistical study of different EEG signal segments in the wavelet domain based on the histograms and cumulative histograms of the different attributes of the wavelet transform. Experimental results of the patients have proved that the different EEG signal segments in wavelet-domain can be used to distinguish between three different classes; inter-ictal (normal state), pre-ictal (pre-state), and ictal (seizure state). This conclusion can open the door for efficient signal prediction with this approach.