-
Paper Information
- Next Paper
- Paper Submission
-
Journal Information
- About This Journal
- Editorial Board
- Current Issue
- Archive
- Author Guidelines
- Contact Us
American Journal of Biomedical Engineering
p-ISSN: 2163-1050 e-ISSN: 2163-1077
2016; 6(1): 25-31
doi:10.5923/j.ajbe.20160601.04

Advanced DNA Mapping Schemes for Exon Prediction Using Digital Filters
 Abstract
 Reference
 Full-Text PDF
 Full-text HTML
Heba Mohamed. Wassfy1, 2, Mustafa M. Abd Elnaby1, Mohamed Labib Salem2, 3, Mai S. Mabrouk4, Abdel-Aziz Awad Zidan2, 3
1Electronics & Electrical Communication Department, Faculty of Engineering, Tanta University, Egypt
2Center of Excellence in Cancer Research (CECR), Tanta University Teaching Hospital, Egypt
3Immunology & Biotechnology Division, Zoology Departments, Faculty of Science, Tanta University, Egypt
4Biomedical Engineering Department, Misr University for Science & Technology, Egypt
Correspondence to: Heba Mohamed. Wassfy, Electronics & Electrical Communication Department, Faculty of Engineering, Tanta University, Egypt.
| Email: |  |
Copyright © 2016 Scientific & Academic Publishing. All Rights Reserved.
This work is licensed under the Creative Commons Attribution International License (CC BY).
http://creativecommons.org/licenses/by/4.0/

Genomic signal processing (GSP) is the engineering area concerned with genomic data analysis using digital signal processing techniques by conversion of the genomic sequence into numerical one as a first step. One of the central issues in GSP is maximizing the accuracy of protein coding region prediction in a given DNA sequence. In this study advanced DNA numerical representations (genetic code context, 2-bit binary and EIIP) were compared in terms of their sensitivity, specificity and correlation coefficient for maximizing the accuracy of the prediction of protein coding region. Digital filters based technique has been applied to extract the period 3 components and removing the undesired noise from the DNA sequence. Results from implementation of the technique on 8 human genes showed that the 2-bit binary representation scheme associated with the used filtering technique has the maximum accuracy compared to the other tested schemes. These findings suggests that the 2-bit binary representation scheme greatly enhances the prediction accuracy of the protein coding region using digital filters opening a new avenue to use this scheme in different applications.
Keywords: Digital filters, DNA, bioinformatics, Genomic signal processing
Cite this paper: Heba Mohamed. Wassfy, Mustafa M. Abd Elnaby, Mohamed Labib Salem, Mai S. Mabrouk, Abdel-Aziz Awad Zidan, Advanced DNA Mapping Schemes for Exon Prediction Using Digital Filters, American Journal of Biomedical Engineering, Vol. 6 No. 1, 2016, pp. 25-31. doi: 10.5923/j.ajbe.20160601.04.
Article Outline
1. Introduction
- Genomic sequence analysis using digital signal processing (DSP) techniques such as filtering, transformation and data compression has been attracted the attention of researchers in recent years [1]. Digital signal processing is an important area of engineering which comprehends the manipulation of numerically represented signal to produce a higher quality signal than the original one [2]. The impact of DSP tools on genomic sequences is the new field of genomic signal processing (GSP) which can be defined as the spectral analysis of genomic signals by DSP algorithms and techniques to achieve a variety of goals such as gene prediction, identification of hotspot locations in proteins and motif prediction [3]. This leads to deep understanding of the living system for development of new therapeutic and diagnostic tools [4]. Genomic data such as deoxyribonucleic acid DNA is discrete in nature and can be mathematically represented by a permutation of four characters A (Adenine), T (Thymine), C (cytosine), G (guanine) of different lengths [3]. The eukaryotic DNA is divided into genes and intergenic spaces. A gene is divided into two sub-regions called exons and introns as shown in Fig.1.
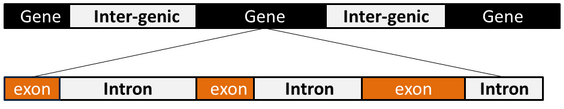 | Figure 1. DNA structure of eukaryotes |
2. Methodology
2.1. DNA Sequence Database
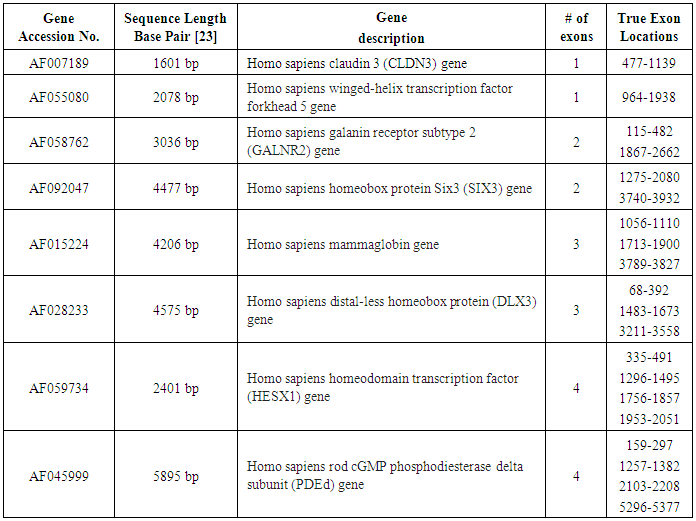
- The DNA sequences of several eukaryotic genes were downloaded from HMR195 dataset prepared by Sanga Rogic [19]. As a model genes, eight human genes with various exon numbers were used for measuring the performance of the tested numerical representation schemes. These genes were chosen to satisfy two conditions; First, the sequence length not to exceed 10,000 base pairs and, second, the number of exons should be less than 4 exons to assert accuracy.
2.2. DNA Numerical Representation
- The DNA sequences of the selected genes were mapped into the three selected representation schemes as follows:
2.2.1. Genetic Code Context (GCC)
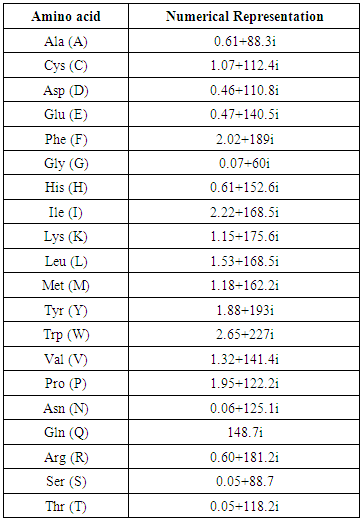
- For a given DNA sequence X = ACGATTCAGGT the triple codons for the three reading frames are, ACG CGA GAT ATT TTC TCA CAG AGG GGT. The corresponding encoded amino acids are [T, R, D, I, F, S, Q, R, G]. Then each amino acid is represented by a unique complex number. The real part represents the hydrophobicity index [20] while the complex part represents the residue volume of each amino acid [17] as shown in Table (1). Thus the DNA numerical vector is [0.05 + 118.2i, 0.60 + 181.2i, 0.46 + 110.8i, 2.22 + 168.5i, 2.02 + 189.0i, 0.05 + 88.7i, 148.7i, 0.60 + 181.2i, 0.07 + 60.0i].
|
2.2.2. (2-bit) Binary Representation
- For position i in the DNA sequence X[i] = ACGATTCAGGT, the 2-bit indicator sequence values are defined as, A=00, G=10, T=01, C=11. Thus the corresponding DNA 2-bit numerical sequence is [00, 11, 10, 00, 01, 01, 11, 00, 10, 10, 01].
2.2.3. Electron Ion Interaction Potential (EIIP)
- For position i in the DNA sequence X[i] = ACGATTCAGGT, the EIIP indicator sequence values are defined as, A = 0.1260, G = 0.0806, C = 0.1340, T = 0.1335.Thus the corresponding EIIP numerical sequence is, [0.1260, 0.1340, 0.0806, 0.1260, 0.1335, 0.1335, 0.1340, 0.1260, 0.0806, 0.0806, 0.1335].
2.3. Prediction of Protein Coding Region Using Digital Filter
- Infinite impulse response (IIR) digital filter with inverse Chebyshev approximation has been chosen due to its high selectivity which can be achieved with a low order transfer function. Moreover, inverse chebyshev filter doesn't exhibit a ripple in its passband amplitude response [2] which is highly needed for the prediction of protein coding region application. Zero phase filtering is used to eliminate the IIR filter delay [10]. Figure (2) describes the steps involved in the realization of the technique using MATLAB, in which the DNA numerical sequence has filtered through narrowband bandpass filter designed to extract the period 3 component, the noise has removed using low pass filter in order to measure the evaluation parameters for each numerical representation scheme.
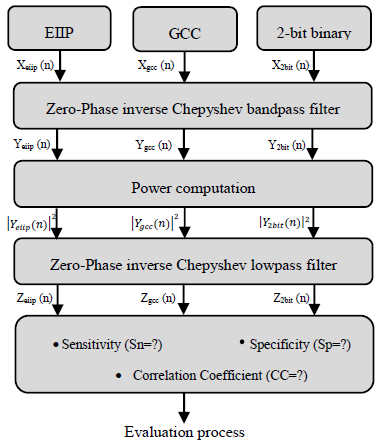 | Figure 2. Overall scheme of the proposed system |
2.3.1. Zero-Phase Bandpass Filtering
- The numerical DNA sequence was filtered using Inverse Chepyshev bandpass filter with the following specifications: Filter order N=3, the lower & upper passband edge frequencies [0.663, 0.669], the lower & upper stopband edge frequencies [0.66, 0.672], the maximum passband attenuation=1dB, the minimum stopband attenuation=30dB.
2.3.2. Power Computation
- The power of the output filtered was calculated by squaring the signal magnitude.
2.3.3. Zero-Phase Lowpass Filtering
- The squared signal was filtered to eliminate the background noise using Inverse Chepyshev lowpass filter with the following specifications: Filter order N=16, Passband edge frequency=0.5, Stopband edge frequency=0.6, the maximum passband attenuation=1dB, the minimum stopband attenuation=80dB.
2.4. Calculation of Evaluation Parameters
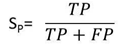
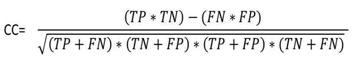
- The sensitivity, specificity and correlation coefficient were calculated as evaluation parameters to measure the effect of different DNA representation schemes on the overall efficiency of the prediction of protein coding region using digital filter as follows:Sensitivity (Sn) is the capability of the representation scheme to predict the true exons. In contrast, specificity [21] is the capability of the representation scheme to exclude the false exons. The DNA representation scheme is considered accurate only if both sensitivity and specificity are high. Correlation coefficient (CC) is the measure of accuracy and ranges from -1 to 1 [22]. Sn, Sp, and CC can be described by the following equations:
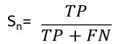 | (1) |
 | (2) |
 | (3) |
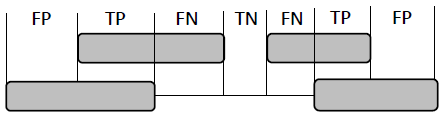 | Figure 3. Definition of four basic measures of exon prediction accuracy at the nucleotide level |
3. Results and Discussion
3.1. Demographic of the Dataset Used
- In order to achieve our aim we have applied the prediction technique using IIR inverse Chepyshev digital filter on 8 human testing genes of single and multiple exons downloaded from HMR195 dataset. The accession numbers, sequence length and true exon locations of the genes are shown in Table 2.
|
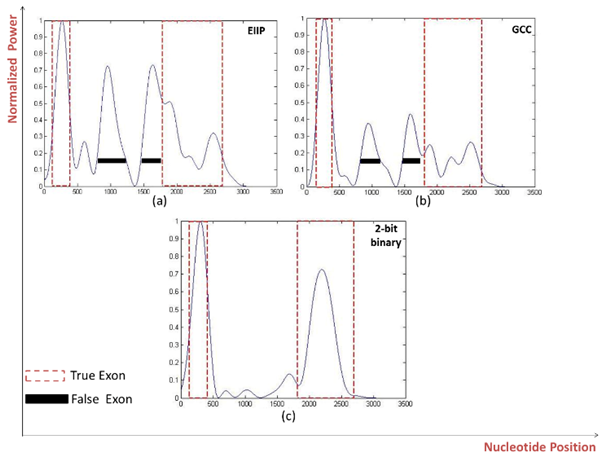 | Figure 4. Power spectrum of Homo sapiens galanin receptor subtype 2 GALNR2 (AF058762) using a) EIIP b) GCC c) 2-bit binary mapping schemes |
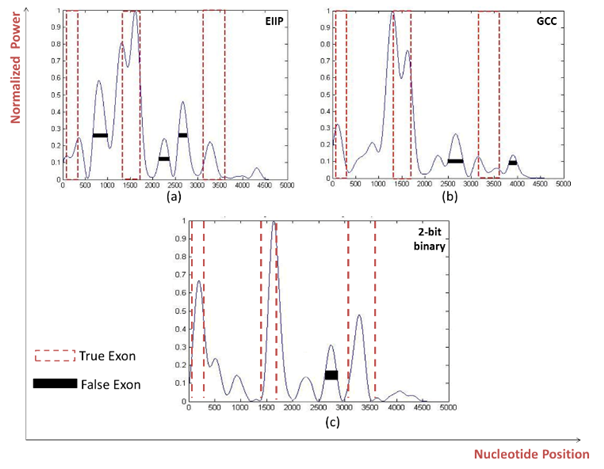 | Figure 5. Power spectrum of Homo sapiens distal-less homobox protein DLX3 gene (AF028233) using a) EIIP b) GCC c) 2-bit binary mapping schemes |
|
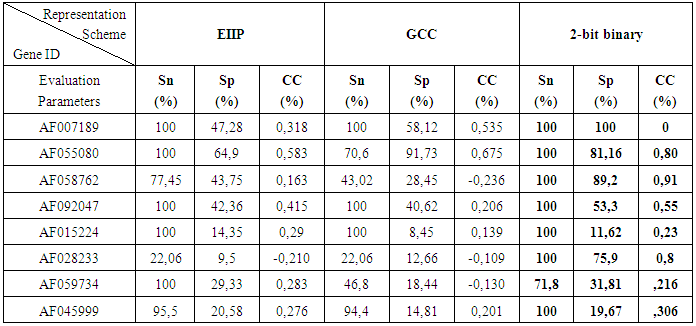
4. Conclusions
- To explore the effect of using different DNA numerical representation schemes on the accuracy improvement of the prediction of protein coding regions in a given eukaryotic DNA sequence, Digital filter based prediction technique has been applied on 8 human genes used as benchmark dataset after numerically converting them into three different numerical representation schemes. The results showed that the 2-bit binary representation scheme greatly enhance the prediction accuracy at the level of true nucleotide position identification associated with high levels of sensitivity, specificity and correlation coefficient compared with EIIP and GCC representation schemes. These findings suggest that the 2-bit binary is an effective representation scheme for prediction of protein coding regions of unknown target sequences using digital filters opening a new avenue to use this scheme in different applications.
ACKNOWLEDGMENTS
- This work has been supported by a grant (ID# 5245) funded from the Science and Technology Development Fund (STDF), Ministry of Scientific Research, Egypt to Mohamed L. Salem, the Principal investigator of this project.