Omer Hamid
Department of Medical Equipment Technology, College of Applied Medical Sciences, Prince Sattam Bin Abdul-Aziz University, Alkharj, Kingdom of Saudi Arabia
Correspondence to: Omer Hamid, Department of Medical Equipment Technology, College of Applied Medical Sciences, Prince Sattam Bin Abdul-Aziz University, Alkharj, Kingdom of Saudi Arabia.
| Email: |  |
Copyright © 2016 Scientific & Academic Publishing. All Rights Reserved.
This work is licensed under the Creative Commons Attribution International License (CC BY).
http://creativecommons.org/licenses/by/4.0/

Abstract
An automated model predictive control systems are proposed and simulated for two ophthalmic drugs: PF-04475270 and Timolol. The eye and its interaction with intraocular pressure (IOP) lowering drug PF-04475270 is considered first, as a plant for the closed loop control system. The plant is represented as a state space model. The plant is simulated in Matlab environment, as an open loop system and then, as a part of a model predictive control (MPC) closed loop system. Two assumptions were made in the simulation: the existence of an IOP sensor that would be placed on the surface of the cornea, and an electronic device that releases a demanded amount of drug under the command of the controller. The input to the system receives eye drops, and the IOP is the system only output response to be controlled. Secondly, Timolol MPC system is simulated and investigated. The Timolol system, also, produces an IOP as dictated by the set point. For single or multiple drug dosing, the systems decrease intraocular pressure (IOP) to the desired set point. When IOP is disturbed by a signal to noise ratio (SNR) of 1:1, in the steady state the PF-04475270 controlled IOP achieved an SNR of 16:1 with no noticeable over or undershooting. Timolol system resulted in an SNR of 4:1 when an SNR at the input is 1:1. The systems work and produce an IOP exactly the same as the set point when continuous dosing is performed, and a pulsatile IOP with a minimum equal to the set point in case of multiple dosing. PF-04475270 works better in physiologically noisy environment.
Keywords:
Intraocular pressure, Glaucoma, Eye anterior chamber, Pharmacokinetics, Pharmacodynamics, Model predictive control
Cite this paper: Omer Hamid, Intraocular Pressure Model Predictive Control: A Simulation Study, American Journal of Biomedical Engineering, Vol. 6 No. 1, 2016, pp. 1-11. doi: 10.5923/j.ajbe.20160601.01.
1. Introduction
Physiological systems are complex control systems. In case of pathology, medical intervention can lead to the regulation of physiological parameters like temperature, blood pressure, heart rate and so on. One example of the early use of feedback technology to control a physiological parameter was seen in the case blood pressure control. Slate et al [1] in 1980 formulated a model to control blood pressure by infusing sodium nitroprusside. In 1982, Slate and Sheppard [2] reported a complete automatic blood pressure control system by drug infusion. Diabetes, insulin modelling and blood glucose level control were well discussed in [3-4]. Artificial pancreas devices based on feedback control systems are available in the market, [5]. In contrast, intraocular pressure (IOP) reduction has received earlier attention in 1969 when a glaucoma drainage device (GDD) was introduced by Molteno [6], it consisted of a straight tube inserted into the anterior chamber and drains into sub-conjunctival plate when IOP increases, it was used as a mechanical control system for untreatable glaucoma cases. The Ahmed Glaucoma Valve (AGV) an improved GDD version was introduced, and well described in [7], still requires a surgical procedure. Other researchers attempted controlled ophthalmic drug delivery system [8]. Raeesa et al [9], reviewed the use of mini-tablets of controlled released drug into the anterior chamber.Ophthalmic medication is almost done manually either by the medical staff or the patient at home such that they become part of the manually closed loop control system. Monitoring and controlling of human ophthalmic intraocular pressure are vital for the management of glaucoma. In this article proposition of automatic eye drop systems, are presented and discussed, for controlling IOP. Kinetics of tracers and drugs were obtained via compartmental modelling that shed light on the understanding of the eye as a system, [10] and [11]. The systems proposed here were non-invasive and depend on continuous measuring of IOP that determine the size of the next ophthalmic auto eye drop. Recently Leonardi et al, 2009 [12], developed a wireless Contact Lens Sensor (CLS) for IOP monitoring. Such sensor could be used as a sensing feedback element for the proposed automatic eye drop system. This IOP sensor is evaluated for 24 hours monitoring in 2012, [13] and it proves to be reliable. Sakanaka et al [14] reported the modelling of PKPD of rabbits' eyes for the drug bunazosin, in 2004. Kenneth et al (2009) [15], obtained a PKPD model of CP-734432 after a topical administration of PF-04475270 drops to dogs' corneas, the model is implemented using NONMEM software. Sakanaka et al [16] in 2008, obtained a PKPD model of Timolol in rabbits, the model is performed using MULTI (RUNGE) program. PF-04475270 lowers IOP by increasing outflow facilities while Timolol inhibits aqueous humour production, this different mechanism leads to different models. Elevated IOP causes glaucoma, if not managed, it leads to optic nerve damage and loss of sight. A glaucoma drug dosing, its interaction with the eye and its effect is an open loop control system as dosing occurs mostly at regular fixed times. Patients may forget or delay the dosing until next morning and this is not a good management of glaucoma. Conventional ophthalmic eye drops are not very efficient drug delivery systems, most of the drug is wasted due to reflex, excessive lacrimation and patients instilling the drug outside the eye. In the present study, an automatic closed loop IOP control system is simulated that provide a demanded size of eye drop that keeps IOP at a certain set point while monitoring IOP all the times. IOP automatic control systems could benefit subjects vulnerable to acute glaucoma attacks and improve ophthalmic drugs instillation.
2. Method
2.1. PF-04475270 MPC
There are many intraocular pressure lowering drugs in the market like Latanoprost, Brimonidine, Timolol, Dorzolamide etc.. And they have different IOP-lowering mechanisms. The drug absorption, interaction and elimination from the eye tissues constitutes a system. The forms of the equations in the time domain describing the system may look the same for most drugs but equations' parameters, assumed constant over time, can be very different, for different drugs, this leads to the concept of pharmacokinetic-pharmacodynamics (PKPD). The first part of the work depends on Kenneth model [15] of PF-04475270, the model (open loop system) predicts the time course of the drug amount deposit Adep, in the cornea Acm, aqueous humour Aah, iris-ciliary body Aicb, IOP, and a response-driven positive feedback. In this article, the model equations given in [15] are used to build a model as shown in Figure 1. The equations' parameters are mainly transfer coefficients and elimination rates of the different model compartments representing different eye tissues, for example, k23 (= 0.004 h-1) represents the drug transfer rate coefficient of the drug from the cornea to the aqueous humour. The parameters were estimated by curve fitting of anterior chamber drug amounts and IOP measurements [15] [16]. An open loop simulation of the model gives similar results as obtained in [15]. A closed loop feedback IOP control system is investigated here. The CLS will provide the feedback control signal to an automatic ophthalmic dosing device which can be small, light in weight containing the drug solution and guided with a miniature camera that help dosing the drug on an opened eye. This device can be attached to the eyeglass frame. The controller and the whole IOP closed system (six states system) is simulated in Matlab (version 2012a) environment using Model Predictive Control (MPC). The set of differential equations given in [15] are included in a Matlab file and called to build a continuous-time state-space model described by: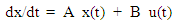 | (1) |
 | (2) |
where x is system state vector, y the output vector, u the input, A, B and C are state space matrices whose elements are generated from the previously mentioned rate and elimination coefficients, such that: A =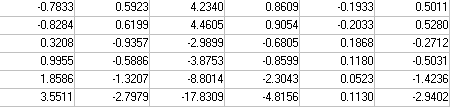 B=
B= 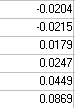 C =
C =  It is assumed, there are no feed-through or disturbances. Only one feedback signal, the IOP response, is taken as the feedback signal. Prediction horizon = 10 and control horizon = 2 were implemented. The model is converted to discrete system acting as a plant, the model predictive controller (MPC) is built based on nature of the plant. A feedback signal is taken from the output to the only input of the controller that drives optimally the plant towards the desired set point. Commands like mpcstate and mpcmove in a closed loop; were incorporated in the Matlab program to produce an optimal trajectory of the drug magnitude (MPC output) for a given IOP set point. The model is simulated in Matlab environment in open and closed loop situations, single, multiple pulses were used in the simulation to mimic eye drops dosing scheme. Multiple continuous dosing (hour-by-hour) simulates the treatment of acute glaucoma attack.
2.2. Timolol MPC
In the same way Timolol, (see [16]), MPC system is simulated for rabbits. The model is formulated to have one input and nine states/outputs, IOP response to Timolol is the only output used with the controller. The designed Timolol MPC system is more involved with nine states and represented by equations as given in equation [1] and [2], leading to different state space matrices, not shown here. IOP again is the only feedback signal. For good results and controllability, prediction horizon is taken to be 40 and control horizon is taken to be 20. The Matlab program structure looks the same for both drugs but rate parameters differ.
3. Results and Discussion
3.1. PF-04475270 MPC
The PKPD model shown in Figure 1 is simulated with pulses, applied at the input, representing the drug drops. The open loop IOP response of the model, for a single pulse, is given in Figure 2a and the drug amount time course of the cornea, aqueous and the ciliary body is shown in Figure 2b. The drug has a maximum effect on IOP in about six hours corresponding to a peak in the iris-ciliary body the site of action as seen in Figure 2a-b.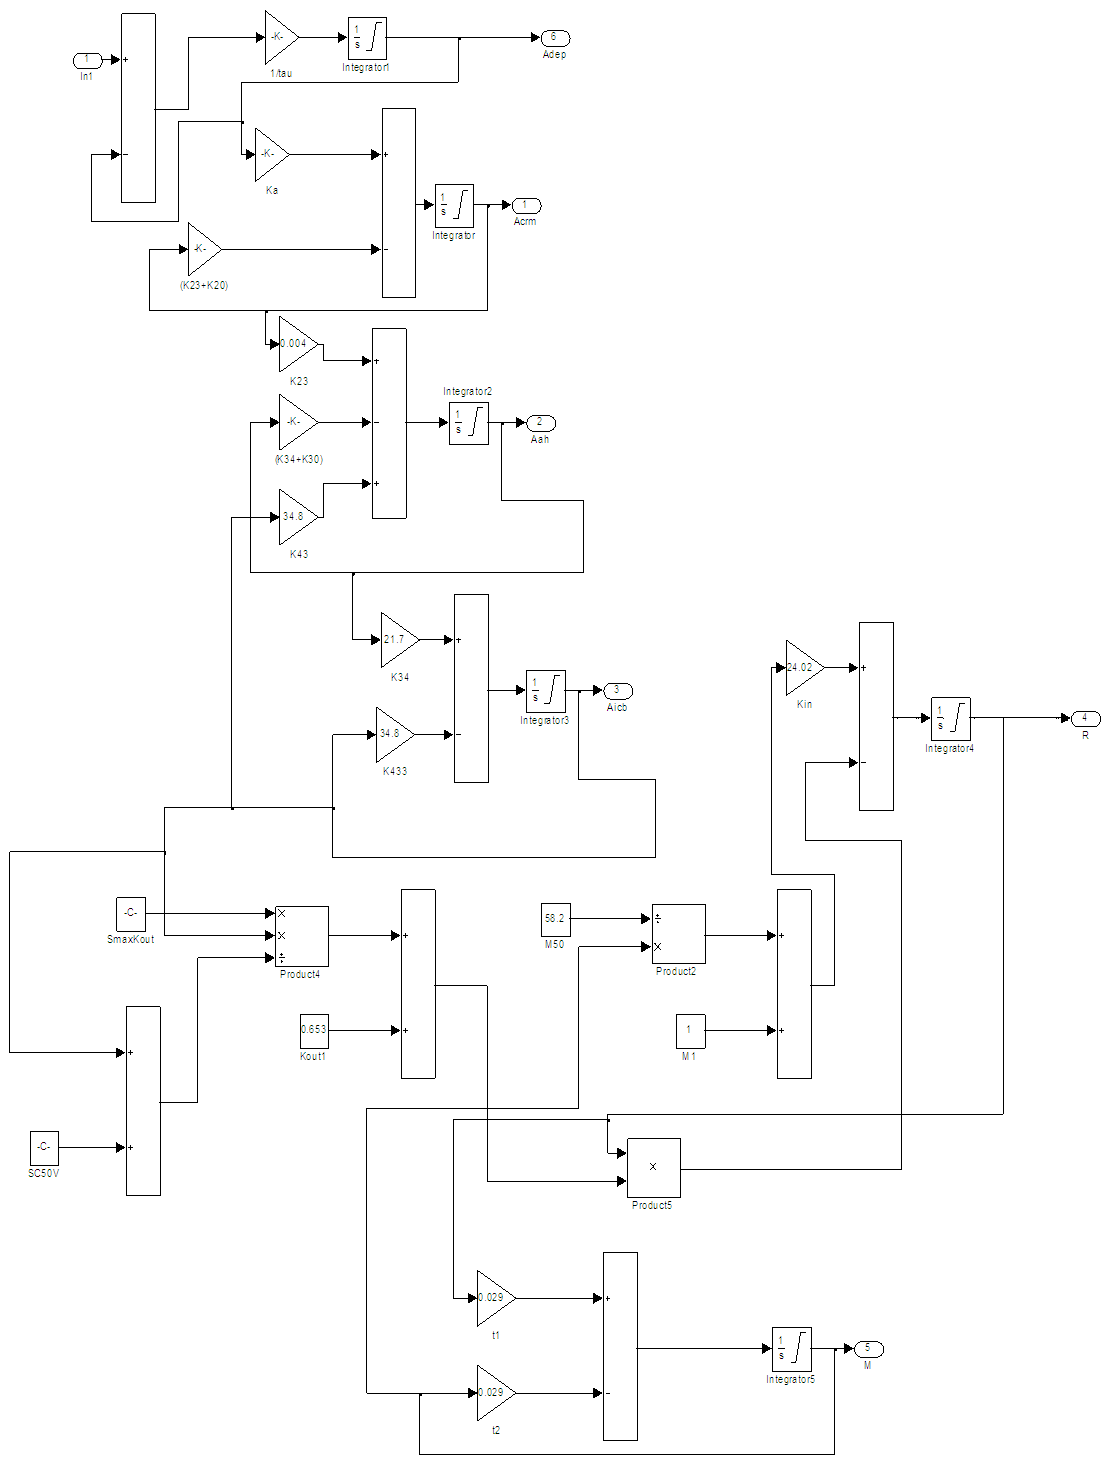 | Figure 1. The PKPD of PF-04475270 Simulink model, ln1 is the input R is the output (IOP) response, the labels ka…k23 are rate coefficients, other symbols are model constants [15] |
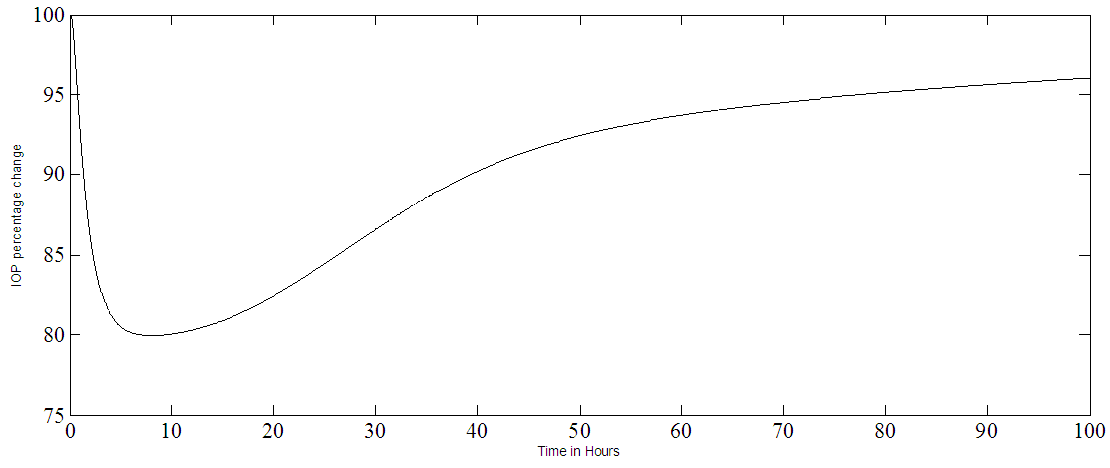 | Figure 2a. A single PF-04475270 eye drop response of the model representing IOP percentage change plotted as a function of time in hours |
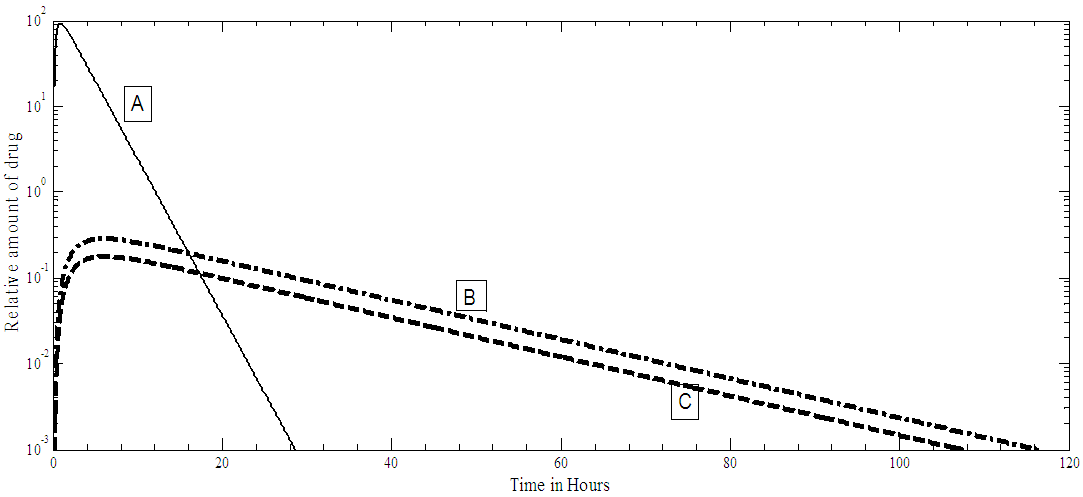 | Figure 2b. Relative amount of PF-04475270 drug, for single drop dosing, present in: A cornea, B aqueous humor, C ciliary body |
The model stability is assessed by finding the coefficients and poles of the characteristic equation of matrix A given in equation [1]. The coefficients are: [1.0, 6.9011, 9.1031, 3.7036, 0.2848, 0.0047, 0.0000]And the poles are: [-5.3186, -0.8381, -0.6510, -0.0700, -0.0236, 0.0002]The coefficients are all positive and none zero except one informing about a pole at the origin. The poles are all real and lie on the left half of the s-plane an indication of stability, however, one pole is at 0.0002 but it is very small in value and near the origin. The result given in Figure 2a has confirmed the stability of the PF-04475270 model, as it is bounded well-behaved impulse response. The model predictive controller used in this research is tested for stability by using the Matlab review instruction, and it passes the review test. In normal glaucoma treatment, multiple drug dosing is used, this situation is simulated by applying a train of pulses to the input of the model which resulted in a multiple dose response shown in Figure 3. For multiple doses, every twenty-four hours, the response settles after ten days at 65% level of the original IOP level, this level depends on the magnitude of the pulses or the drug amount. The response takes time (about 200 hours) to settle because of the long-time constant of the open loop system and that depends on the rate and elimination parameters of the drug of different eye tissues. The results shown in Figures 2-3, do not differ from the results obtained by Kenneth et al (2009) [15] and are done here to confirm the validity of the model in Matlab environment. The previous responses were obtained for the open loop system. Kenneth [15] and Sakanaka [16] models are open loop systems, here automatic IOP closed loop systems are simulated for the first time in literature, as it seems. The model predictive control (MPC) system allows the automatic closed loop control of IOP at a set point, in this case, 80% of the original IOP. A continuous multiple dosing, every hour, is implemented with the MPC closed loop system. Figure 4a shows the IOP percentage change during a continuous dosing, the effect of continuous dosing is that the IOP reaches a minimum in about 10 hours and settles at 80%, around 12 hours from the start, with almost zero steady error. The trajectory of the input dosing (MPC output) is shown in Figure 4b, representing the different drug drop sizes delivered to the eye, it has a major peak around 4 hours, its effect is felt by IOP around 10 hours (see Figure 4.a). The drop sizes in Figure 4b settles after 15 hours (steady state) and this indicates constant drug dosing rate if there are no disturbances in the physiology of the eye. A white noise is added to the output (output disturbance) such that the signals to noise ratio is 1:1, The system output under the influence of such disturbances is shown in Figure 5a and the resulting MPC trajectory is given in Figure 5b. The output SNR has improved to become 16:1 with the MPC good performance. The overall pattern of IOP and drop sizes, under the influence of noise, does not change, but in the steady state, drop sizes vary by as much as 100% (see Figures 5a-b). The noise makes the MPC output jittery, but within a bounded limited range, as it tries to control the IOP. The effect of circadian IOP rhythm is ignored in this simulation. Continuous dosing could help glaucoma trauma patients.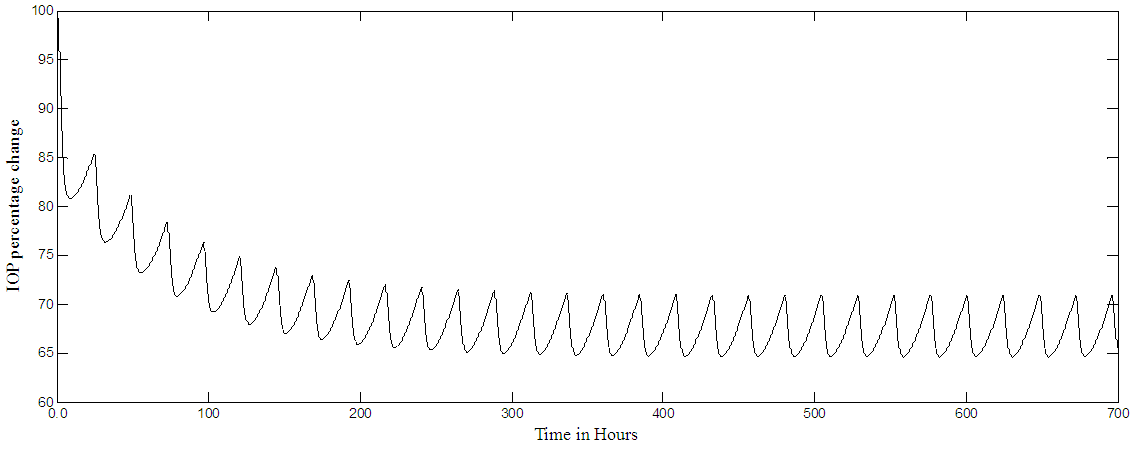 | Figure 3. PF-04475270 Multiple dose (every 24 hour) IOP open loop response. IOP settles at 65% level (minimum) |
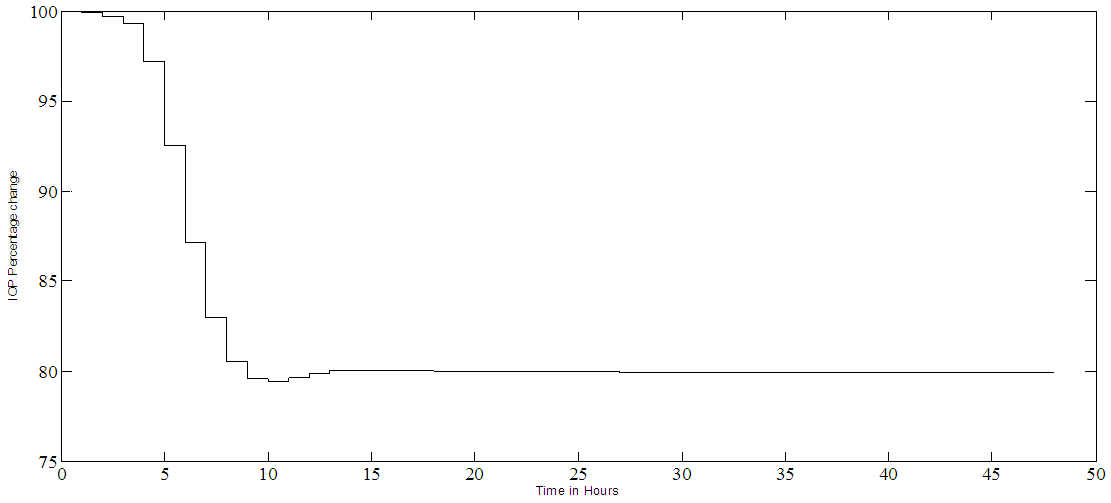 | Figure 4a. PF-04475270 IOP hour by hour closed loop control. It reaches the set point of 80% in 12 hours and it stays constant for the rest of time |
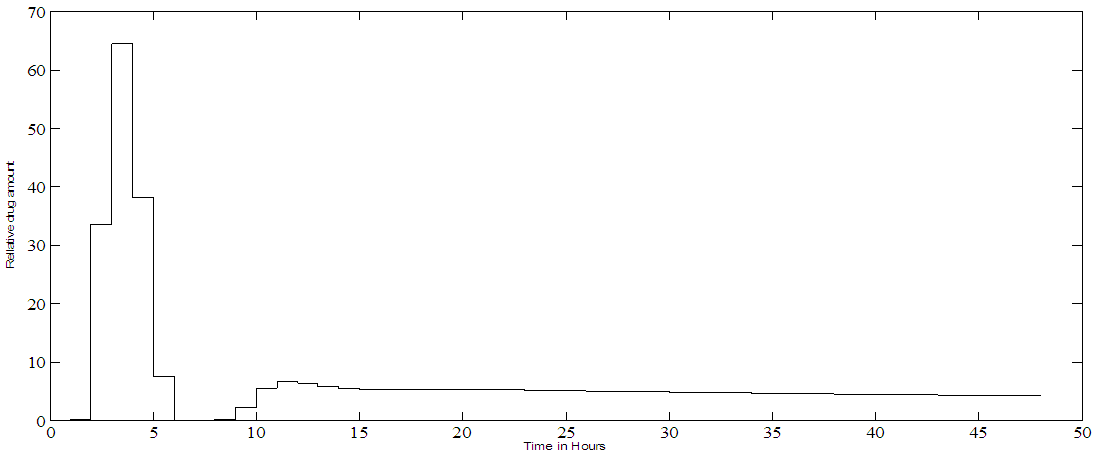 | Figure 4b. PF-04475270 MPC trajectory output corresponding to hour by hour control and a set point of 80% IOP change |
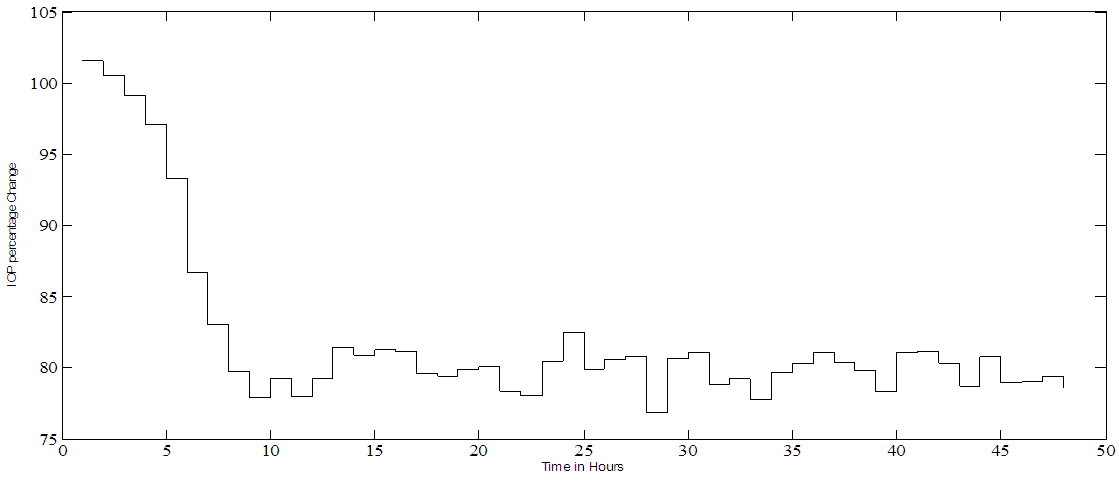 | Figure 5a. PF-04475270 IOP hour by hour closed loop control under disturbance. White noise is added to the output such that an SNR = 1:1 for a set point of 80% |
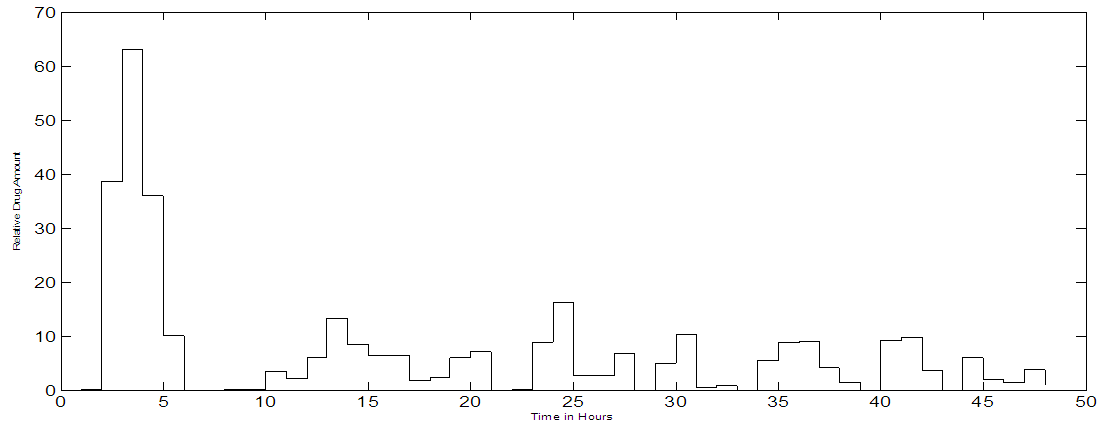 | Figure 5b. MPC trajectory output when noise is added to the output. When input SNR = 1:1 for a set point of 80% |
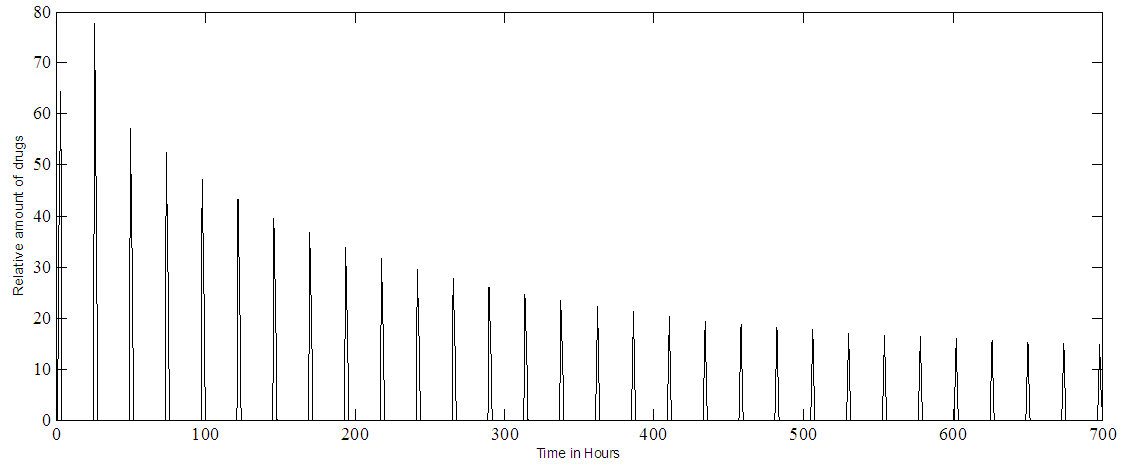
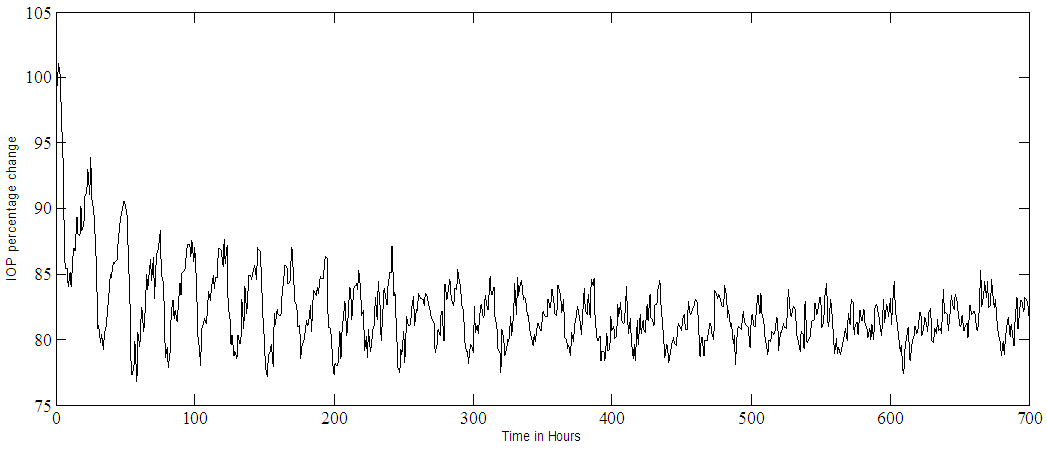
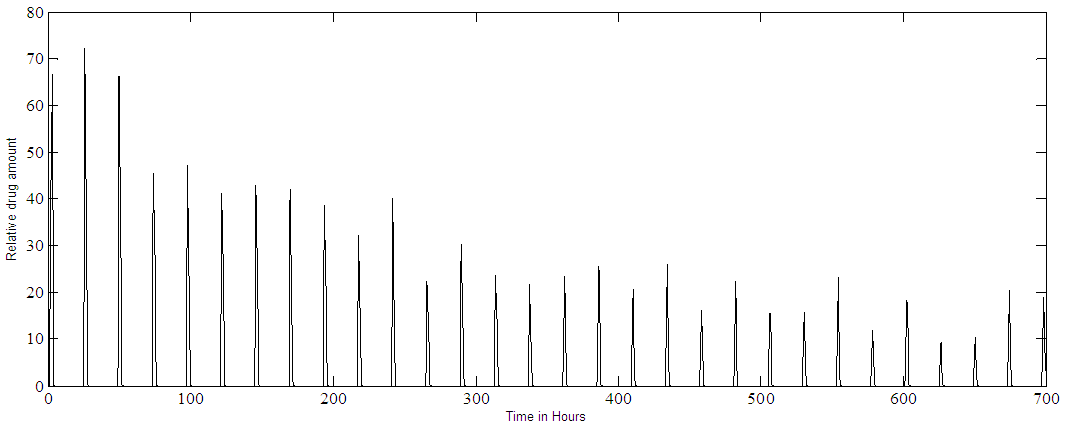
Noise free simulation of multiple dosing (one eye drop every twenty-four hours) is shown in Figure 6a for the IOP and Figure 6b for the MPC output. These results simulate the use of the drug in non-traumatic cases. The IOP becomes pulsatile and decreases exponentially, after 240 hours it settles within the range of 80% - 85%, where 80% represents the set point. The effect of adding noise to the output, in the case of multiple doses, are shown in Figure 7a for the IOP and in Figure 7b for the MPC output. Notice that the SNR of the controlled IOP becomes almost 16:1, Figure 7a, and the MPC output, Figure 7b, varies as it tries to control a noisy IOP output. Again the IOP circadian rhythm is not included in the simulation, the added white noise could simulate any sort of output disturbances or IOP variations.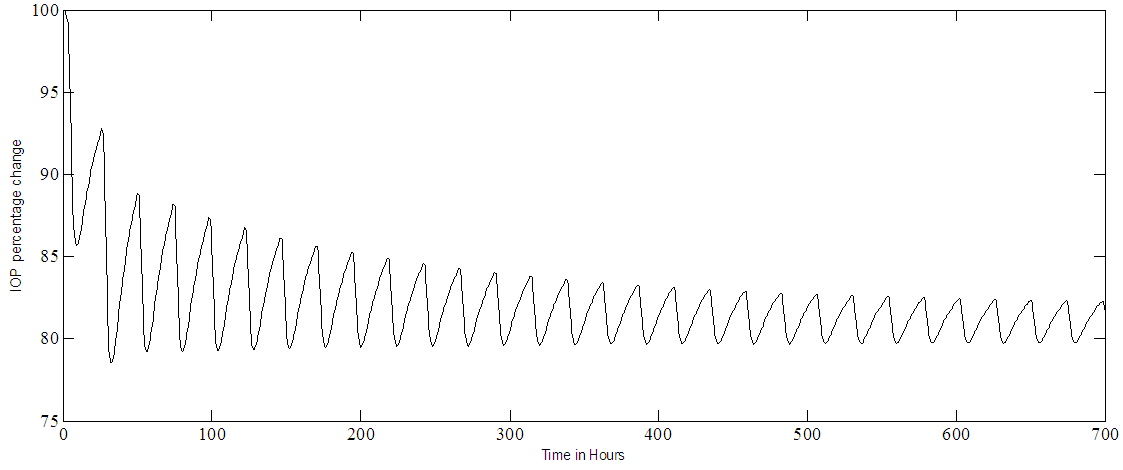 | Figure 6a. PF-04475270 IOP control at set point of 80% in case of multiple doses (one eye drop every 24 hours) |
 | Figure 6b. PF-04475270 MPC output at IOP set point of 80%. Multiple doses (one drop every 24 hours) |
 | Figure 7a. PF-04475270 IOP control at a set point of 80% and an input SNR of 1:1. Multiple doses case, one drop every 24 hours |
 | Figure 7b. PF-04475270 MPC output at IOP set point of 80%. Multiple doses (one drop every 24 hours) with added noise |
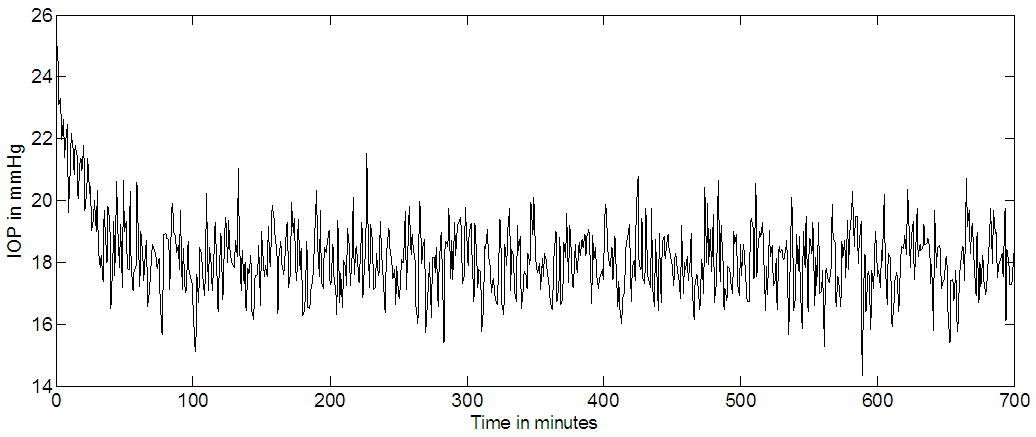
3.2. Timolol
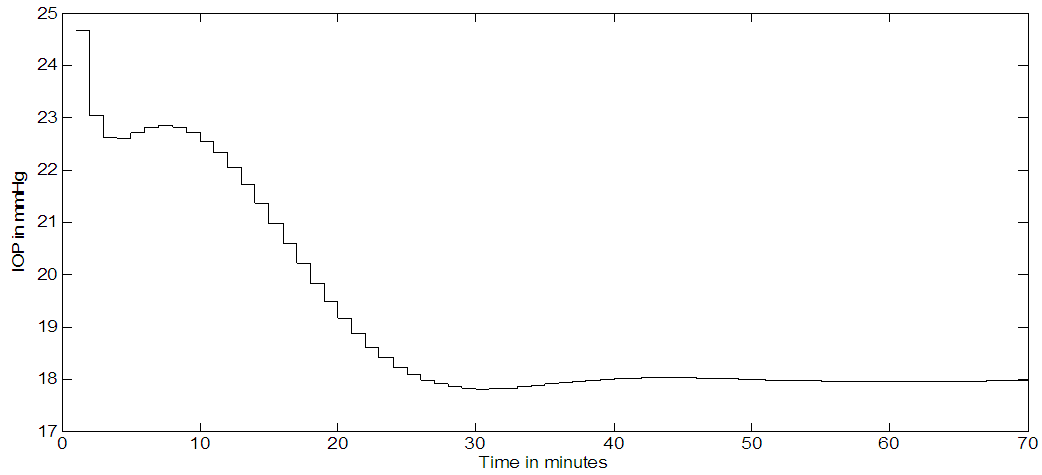
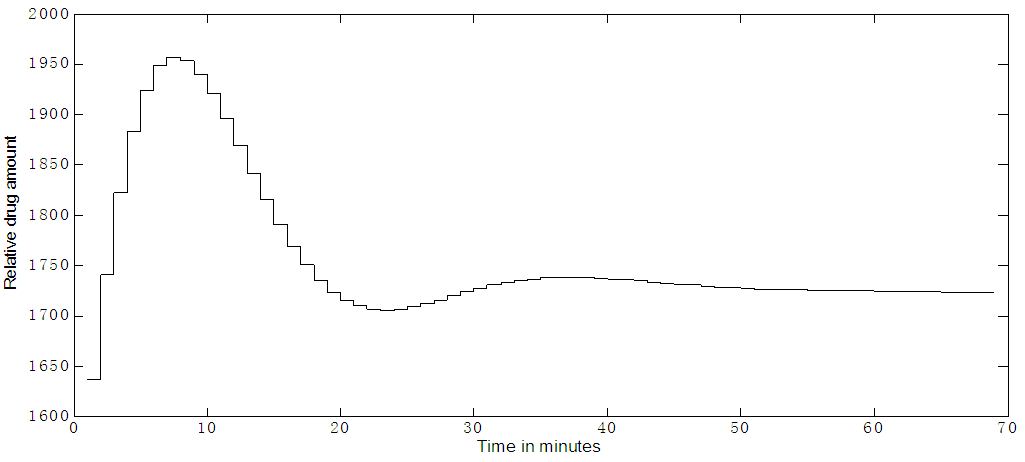
Timolol effect on IOP (in mmHg) is shown in Figure 8.a, where multiple (every 12 hours) dosing and an SNR of 1:1 is used. The noise is added to the output. A set point of 18 mmHg is reached and an output SNR approximately = 4:1 is achieved. The controller output is noisy and trying to deliver drug as pulses, but not behaving very well, as seen in Figure 8b. Continuous dosing (every minute); results are shown in Figure 9a where the set point is 18 mmHg, the IOP reached a steady state in about 50 minutes. There is a slight overshooting from the initial 24 mmHg IOP value and slight undershooting before it settles at the set point. The controller output for continuous dosing is shown in Figure 9b, it peaks around 10 minutes and IOP responds to this peak by becoming minimum at around 30 minutes. When noise is added to the output (SNR 1:1) for continuous dosing, the IOP settle at the set point = 18 mmHg but noisy as shown in Figure 9c.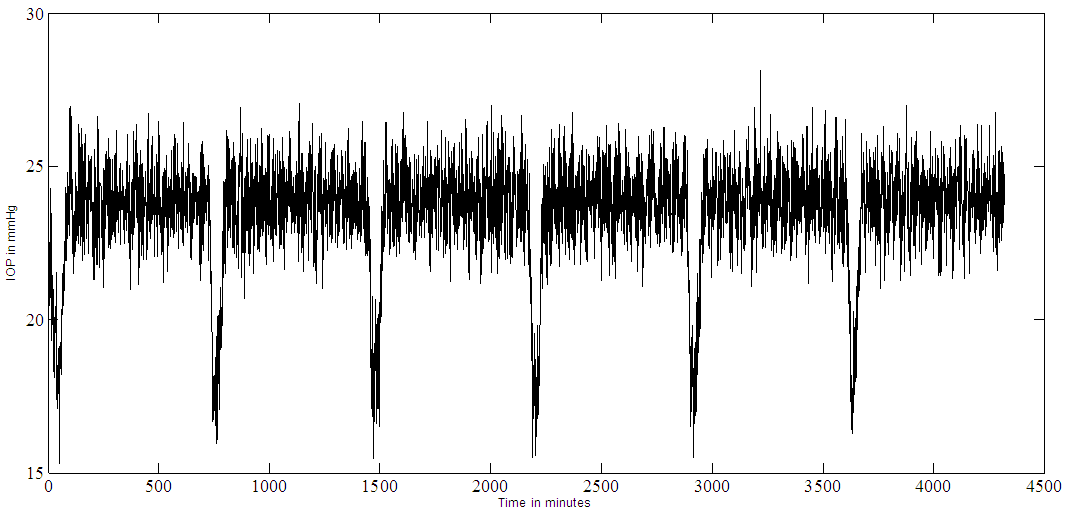 | Figure 8a. Timolol IOP control at a set point of 18 mmHg and an SNR of 1:1. Multiple doses case (every 12 hours) |
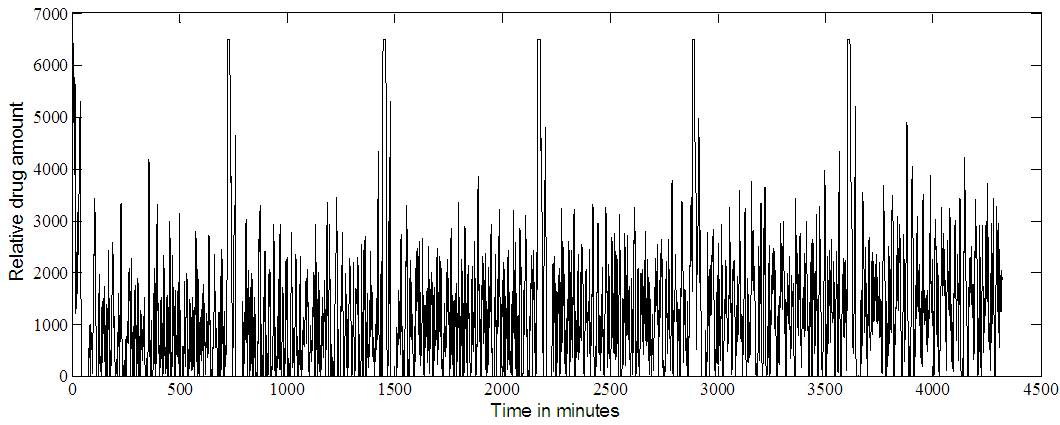 | Figure 8b. Timolol MPC output at IOP set point of 18. Multiple doses (every 12 hours) |
 | Figure 9a. Timolol IOP response for continuous dosing, (every minute) |
 | Figure 9b. Timolol MPC output for continuous dosing, (every minute) |
 | Figure 9c. Timolol IOP control for continuous dosing with noise added to the output, the set point is 18 mmHg |
3.3. Timolol Versus PF-04475270
The main difference between Timolol and PF-04475270 is in the mechanism of actions, Timolol suppresses aqueous humour formation [16] while PF-04475270 increases the conventional outflow via the trabecular meshwork [15]. This difference has resulted in two different models with different states, 9 for Timolol and 6 for PF-04475270. For both drugs to be effective they have to be absorbed by the ciliary body. In continuous dosing PF-04475270 settles to the desired set point after long 12 hours (Figure 4a), while Timolol settles in short 50 minutes time to the desired set point (Figure 9a). PF-04475270 has slow IOP response (when reaching the minimum value) in about 6 hours, while Timolol has fast IOP response about 30 minutes (as seen in Figures 2a, 8a). These responses can be considered as impulse responses of systems. Analysing these responses in the frequency domain, Timolol model must have a broader frequency bandwidth, i.e it can respond to high-frequency noise components. The origin of this difference in response lies in the rate parameters, for example, PF-04475270 transfer rate coefficient of the drug from the cornea to the aqueous humour is 0.004 h-1 [15] while it is given as 11.7h-1 [16] for Timolol. The PF-04475270 output SNR is four times better than that of Timolol, due to the above analysis. For stable IOP response, the model predictive control is implemented for Timolol feedback fraction of 10% and 100% for PF-04475270. The dosing rate become fixed for both drugs after passing the transient time, which is in few hours for PF-04475270 (Figure 4b) and in minutes for Timolol (Figure 9b).
4. Conclusions
Closed loop model predictive IOP control systems were simulated for two ophthalmic drugs, based on previously developed PKPD animals' models (rabbits and dogs). In the simulation, it is assumed the availability of a cornea pressure sensor and an automatic non-invasive dosing device. The simulated systems work even in noisy environment. PF-04475270 behave better under disturbance when compared to Timolol. In continuous dosing, both drug control systems settle to the desired set point after a lapse of transient time. Such closed loop IOP simulations were not tried before. The challenge remains of obtaining PKPD drug models for humans and the practical implementation of the systems, safely.
References
| [1] | Slate, J. B., Sheppard, L. C., Rideout, V. C. and Blackstone, E. H. (1980). Closed-loop nitroprusside infusion: Modelling and control theory for clinical application. Proceedings of IEEE International Symposium on Circuits Systems. 482–488. |
| [2] | Slate, J. B. and Sheppard, L. C. (1982). Automatic control of blood pressure by drug infusion. IEE Proceedings Part A. 129 (9). 639 - 645. |
| [3] | C. Cobelli, C. Dalla Man, G. Sparacino, L. Magni, G. De Nicolao, and B. P. Kovatchev. (2009). Diabetes: Models, signals and control. IEEE Rev. Biomed. Eng.. 2. 54-96. |
| [4] | C. Cobelli, C. Dalla Man, M. G. Pedersen, A. Bertoldo and G. Toffolo. (2014). Advancing our understanding of the glucose system via modeling: A perspective. IEEE Trans Biomed Eng. 61. 1577-1592. |
| [5] | C. Cobelli, E. Renard, and B. Kovatchev. (2011). Artificial pancreas: Past, present, future. Diabetes. 60. 2672-2682. |
| [6] | A. C. Molteno. (1969). New implant for drainage in glaucoma. Br. J. Ophthalmol. 53. 606–615. |
| [7] | Anne L Coleman, MD., Richard Hill, MD., M. Roy Wilson, MD., Neil Choplin, MD., Ronit Kota S-Neumann, MD., Mae Tam, MD., Jason Bacharach, MD., AND William C. PANEK, MD. (1995) Initial Clinical Experience With the Ahmed Glaucoma Valve Implant. Am. J Ophthalmol. 120(1). 23-31. |
| [8] | Pollack IP, Quigley HA and Harbin TS. (1976). The Ocusert pilocarpine system: advantages and disadvantages. South Med J. 69(10). 1296-8. |
| [9] | Raeesa M. Moosa, Yahya E. Choonara, Lisa C. du Toit, Pradeep Kumar, Trevor Carmichael, Lomas Kumar Tomar, Charu Tyagi and Viness Pillay. (2013). A review of topically administered mini-tablets for drug delivery to the anterior segment of the eye. Royal Pharmaceutical Society. Journal of Pharmacy and Pharmacology. 66. 490–506. |
| [10] | R. F. Jones and D. M. Maurice. (1966). New methods of measuring the rate of aqueous flow in man with sodium fluorescein. Expertl Eye Res. 5. 208-220. |
| [11] | P. Anselmi A. J. Born and D. M. Maurice. (1968). Action of drugs on the aqueous flow in man measured by fluorophotometry. Expertl Eye Res. 7. 487-496. |
| [12] | Leonardi M, Pitchon EM, Bertsch A, et al. (2009). Wireless contact lens sensor for intraocular pressure monitoring: assessment on enucleated pig eyes. Acta Ophthalmol. 87(4). 433–7. [PubMed: 19016660]. |
| [13] | Kaweh Mansouri, M.D., M.P.H., Felipe A. Medeiros, M.D., Ph.D., Ali Tafreshi, B.S., and Robert N. Weinreb, M.D. (2012). Continuous 24-hour Intraocular Pressure Monitoring With a Contact Lens Sensor: Safety, Tolerability, and Reproducibility in Glaucoma Patients. Arch Ophthalmol. 130(12):doi:10.1001/archophthalmol.2012.2280. |
| [14] | Sakanaka K, Kawazu K, Tomonari M, Kitahara T, Nakashima M, Kawakami S, Nishida K, Nakamura J, and Sasaki H (2004). Ocular pharmacokinetic/pharmacodynamic modeling for bunazosin after instillation into rabbits. PharmRes. 21. 770–776. |
| [15] | Kenneth T. Luu, Eric Y. Zhang, Ganesh Prasanna, Cathie Xiang, Scott Anderson, Jay Fortner, and Paolo Vicini. (2009). Pharmacokinetic-Pharmacodynamic and Response Sensitization Modeling of the Intraocular Pressure-Lowering Effect of the EP4 Agonist5-{3-[(2S)-2-{(3R)-3-hydroxy-4-[3-(trifluoromethyl)phenyl]butyl}-5-oxopyrrolidin-1-yl]propyl}thiophene-2-carboxylate (PF-04475270). The J Pharmacol Exp Ther 331(2). 627–635. |
| [16] | Sakanaka K, Kawazu K, Tomonari M, Kitahara T, Nakashima M, Kawakami S, Nishida K, Nakamura J, Sasaki H and HIGUCHI S (2008). Ocular Pharmacokinetic/ Pharmacodynamic Modeling for Timolol in Rabbits Using Telemetry System. Biol. Pharm Bull 31(5) 970-975. |

 Abstract
 Reference
 Full-Text PDF
 Full-text HTML