-
Paper Information
- Paper Submission
-
Journal Information
- About This Journal
- Editorial Board
- Current Issue
- Archive
- Author Guidelines
- Contact Us
American Journal of Biomedical Engineering
p-ISSN: 2163-1050 e-ISSN: 2163-1077
2015; 5(2): 34-66
doi:10.5923/j.ajbe.20150502.02
A Measurement-Quality Body-Worn Sensor-Agnostic Physiological Monitor for Biomedical Applications
 Abstract
 Reference
 Full-Text PDF
 Full-text HTML
Barry K. Gilbert1, Clifton R. Haider1, Daniel. J. Schwab1, Christopher L. Felton1, Ivana T. Croghan2, Orhun H. Kantarci3, Michael J. Shea1, Erik S. Daniel1
1Special Purpose Processor Development Group, Department of Physiology and Biomedical Engineering, Mayo Clinic, Rochester, USA
2Department of Medicine, Mayo Clinic, Rochester, USA
3Department of Neurology, Mayo Clinic, Rochester, USA
Correspondence to: Barry K. Gilbert, Special Purpose Processor Development Group, Department of Physiology and Biomedical Engineering, Mayo Clinic, Rochester, USA.
| Email: |  |
Copyright © 2015 Scientific & Academic Publishing. All Rights Reserved.
We describe a body-worn data collection unit designed specifically for continuous recording of physiological variables of patients in their free-living home or work environments. These body-worn units produce measured data over durations of up to two weeks without battery change or recharging, with the intent that they can be used for direct support of patients who need to be monitored continually over durations of multiple days. Further, the majority of discussions of such devices in the current literature focus on the sensors or the application and analysis, assuming that the system implementation is a given. Optimization of the system design to maximize the signal-to-noise ratio of the recorded waveforms, and therefore their quality, presents engineering challenges which will be discussed in this paper. We begin from the position that the units should be “sensor-agnostic electronic platforms” capable of accepting raw data from a wide range of analog and digital sensors. This manuscript will describe the philosophy employed in the development of these units, including design, assembly, and per-unit static and dynamic calibration methods. We discuss several alternate implementations of the basic platform targeted to different measurement and monitoring applications. Finally, we present example results from one multi-week study with multiple healthy volunteers each wearing a single unit, a short-duration patient volunteer study which employed a single unit; and one multi-day continuous-recording study using five units on the same individual.
Keywords: Motion analysis, Body-Worn unit, Real-Time operating system, Biometric sensors, ECG, Respiration, Calibration, Real-Time clock, Biomedical electronics
Cite this paper: Barry K. Gilbert, Clifton R. Haider, Daniel. J. Schwab, Christopher L. Felton, Ivana T. Croghan, Orhun H. Kantarci, Michael J. Shea, Erik S. Daniel, A Measurement-Quality Body-Worn Sensor-Agnostic Physiological Monitor for Biomedical Applications, American Journal of Biomedical Engineering, Vol. 5 No. 2, 2015, pp. 34-66. doi: 10.5923/j.ajbe.20150502.02.
Article Outline
1. Introduction: Development of an Instrumentation-Quality, Diagnostic-Quality Body-Worn Activity Monitoring Unit
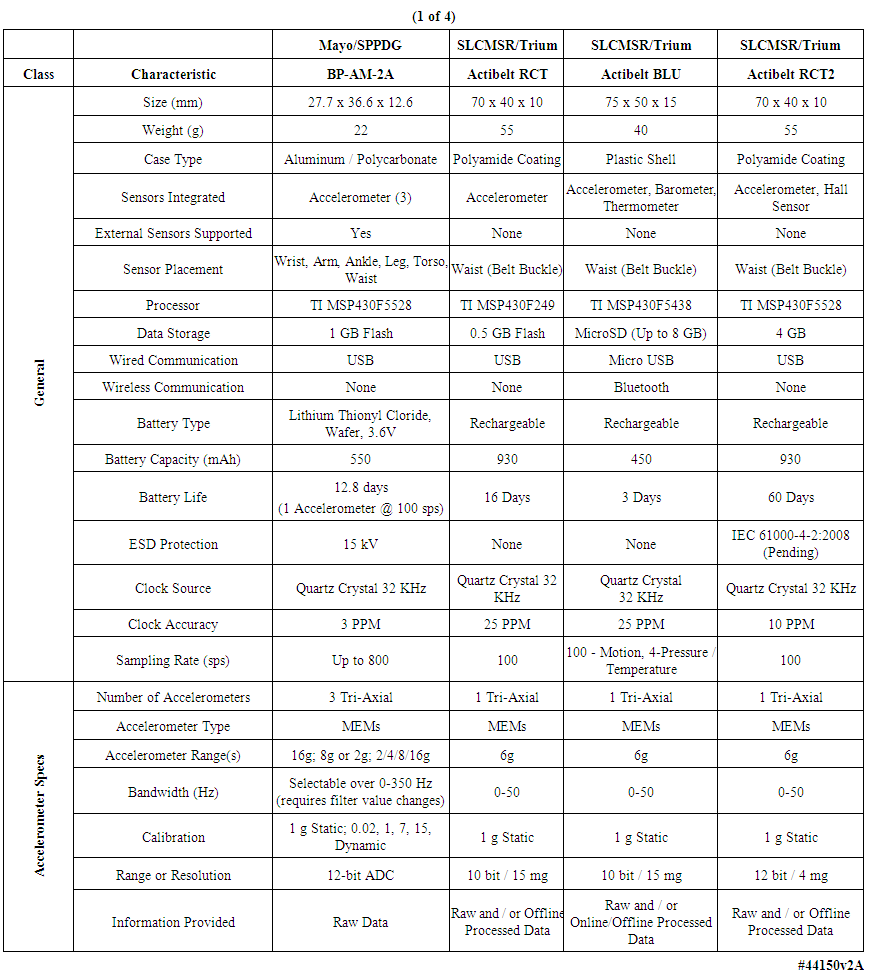
- The commercial medical industry in the United States and Europe has recognized a potentially lucrative market for the fabrication and sale to the general public of what may be referred to as body-worn “health monitor systems”. A wide variety of such units exist and some have been reported and/or analyzed in the literature, including step counters [1], tremor monitors [2, 3] general activity [4-6] and gait analysis monitors [7-11], calorie-burn estimators, ECG sensors [12], and others. Based on an analysis described below, the majority of commercially available units intended for use by consumers for “wellness self-monitoring” appear to lack one or more useful attributes if they are to be employed in actual physician-prescribed patient care. In support of the evolving Model of Patient Care in this decade and beyond, physicians need wearable electronic systems that can be prescribed for their patients, for use in the patients’ home and office environments, that are tiny and unobtrusive. Further, the units should be completely autonomous, in the sense that the patient need not “interact” with the units except to wear them as prescribed by the healthcare provider. They should be physically rugged, and operate for multiple days without the need for battery change or recharging. The units should collect physiological data of high quality and be individually tested and calibrated so that the data can be converted into information useable in the monitoring of healthy individuals and those with chronic illness, and for a variety of clinical research studies, over durations of weeks to months. The units developed here and fielded to date have been designed to address these requirements.This generic clinical-quality requirement is difficult to fulfill, and to date has not been achieved by a number of the consumer-grade devices, which have been targeted to the “self help” market. A few teams have described their efforts to achieve levels of refinement appropriate for clinical studies [3, 6, 11-13]. In the early 2000s our engineering team initiated a long-term project whose primary goal was an understanding of the possible uses of, and the development of design guidelines for, body-worn physiological monitoring units with a wide range of monitoring capabilities. We hypothesized that rigorous engineering design paradigms could be applied to the development of new hardware/software-based tools for the measurement of physiological variables. We further hypothesized that these methods would result in very robust, reliable, body-worn units that could be thoroughly calibrated. As noted above, the intent was that these units could be fielded into the biomedical research and clinical practices of medical centers, to be used to generate new medical knowledge and in direct support of patient care.The development of a design, fabrication, and test methodology for such diagnostic-quality units has thus evolved in our laboratory over the past decade [14-16]. The capabilities of such units will continue to mature as a result of requests from healthcare providers and clinical research staffs, experience gained through usage, and based on guidelines from the Food and Drug Administration (FDA), the Federal Communications Commission (FCC), and others.In this manuscript we will describe the attributes of the units that we have developed and fielded into several clinical and biomedical research practices in a large medical center, as well as a few examples of short-duration and long-duration measurements made on volunteers. Issues such as the development of post-processing algorithms, and the manner in which such units could be integrated into various clinical subspecialties, are not described here. The units described herein represented the third evolutionary generation of these units that we have created since 2003; the results from the first generation have been published [14-16]. Based on this experience, by reviewing the features of commercial units (Tables 1-4), and through discussions of desired features with clinical collaborators, we developed the criteria described below, and which we have incorporated into the generation of our body-worn units.
 | Table 1. Comparison of multiple body-worn motion monitoring devices |
 | Table 2. Comparison of multiple body-worn motion monitoring devices (continued) |
 | Table 3. Comparison of multiple body-worn motion monitoring devices (continued) |
 | Table 4. Comparison of multiple body-worn motion monitoring devices (concluded) |
1.1. What Distinguishes a Medical-Grade Diagnostic-Quality Body-Worn Monitor from a Consumer Product?
- Different units in a given technology generation will likely have different capabilities. For example, in some applications, all data collected will need to be stored for later retrieval and analysis; in some units, stored data may span only the most recent N seconds of measurements. Some units will eschew wireless capability for chronic recordings that do not require instantaneous data transfer, but rather are optimized for small size and long operating life; whereas for some units instantaneous wireless transmission of measured events will be necessary. The sensor suite will vary among units as the end use requires. In this manuscript we will concentrate on a “chronic recording” motion-recording unit whose end application does not require wireless capability, but instead is optimized for the smallest possible physical dimensions and very long recording times. We will also briefly describe a physically ruggedized motion-and-ECG data logging unit for long-term operation in very harsh environmental conditions, and a data logging and programmable wireless transmission unit; all of these variants are constructed on the same electronic and software “platform”.We have identified a series of features and capabilities that separate consumer-grade units intended for nonmedical self-help applications, from those intended for high-fidelity monitoring of patients for direct clinical application. We believe that all or most of the following features need to be available simultaneously. While we have not implemented all of them in our present generation units, most have been incorporated into our fielded systems. In a few instances or for new capabilities in development, they have been demonstrated on standalone functional printed circuit boards or in in-test revisions of the on-board software. Our plan is to incorporate these additional capabilities as successive generations of body-worn units are developed. We divide these features into three groups, as follows:
1.1.1. Patient-Centric Features
- The units must be: A) very small, to have minimal physical and psychological effect on the patient or subject; B) useable in multiple body locations, e.g., ankle, leg, waist, chest, arm, wrist, head, neck, either singly or in groups, and/or integrable into normal apparel for most body locations; C) water-tolerant to allow operation in most normal-living situations; D) resistant to electrostatic discharge (ESD) to ensure uninterrupted data acquisition in home environments; E) gas-sterilizable to allow device reuse on multiple patients over time; F) exhibit autonomous operation including long battery life and recording capabilities, including low-battery automatic save-and-shutdown, to support chronic multiple-week recording; and G) designed to minimize or eliminate the need for intervention by the patient for such items as nightly battery recharging. All of these features have been incorporated into our present-generation units.
1.1.2. Application-Centric Features
- A) The units must be designed for multiple sensor/sensing applications rather than for only a single specific sensor, i.e., they must be “sensor agnostic”; B) the units should be easily programmable by a clinical technician with a range of data sampling rates and/or amplitude sensitivities to ensure that the required information is captured with sufficient resolution for the specific sensor set and the intended end application; C) the units should contain a stable onboard clock or other mechanism to ensure precision time stamping to support placement of multiple units on each patient and subsequent time-alignment of the data; D) in those applications in which long-term data is relevant, all data should be saved in an on-unit nonvolatile memory in support of data uploading to support multiple levels of post-processing; E) data records stored in the onboard cache should include such elements as the device model number, manufacturing configuration, device serial number, software version number, real-time battery voltage, and all of the user-selected settings for each data collection episode. All of these features have been incorporated into our present-generation units.
1.1.3. Technology-Centric and System Stability/Reliability/Safety Features
- A) All hardware and software “corner cases”, e.g., extremes of temperature and supply voltage variations, and manufacturing process variations in individual components, must be thoroughly addressed to create a “patient-proof” system; B) the battery replacement method if higher-energy-density “primary” batteries are employed, or battery recharging method if lower-energy-density “secondary” batteries are employed, must preserve all onboard clock and time stamp values, ensuring uninterrupted onboard recording and marking of data files; C) different range-resolution-sample rate sensors should be supported allowing simultaneous gross and fine detail recording; D) wireless capability, if present, must be robust and provably cryptographically secure [17]; E) any sensors that can be calibrated, such as accelerometers, should undergo NIST-traceable static and dynamic characterization of every device to assure accuracy, precision, and repeatability, including algebraic correction for slope and offset when appropriate, with repeated calibrations over time to accommodate sensor and electronics “drift”; F) other types of sensors, e.g., ECG circuits or impedance-based spirometers, should be compared for accuracy against known standards such as commercial ECG simulators or airflow-based spirometers; and G) memory block error/defect management should be incorporated in those instances where absolute data integrity is important. All items described above have been implemented, with four exceptions: 1) the full suite of inspection and testing for incoming individual components; 2) wireless communication encryption for those units that supported a wireless capability; 3) individual bit error correction, although bad block management has been implemented as well individual bit error detection; and 4) encryption of the data block headers and payloads---although the development and testing in our laboratory of the encryption algorithms running directly on the microcontrollers has been benchmarked with energy-efficient algorithms, and is well along at the time of this writing [17].
1.1.4. Discussion of Design Characteristics of Commercially Available Body-Worn Units
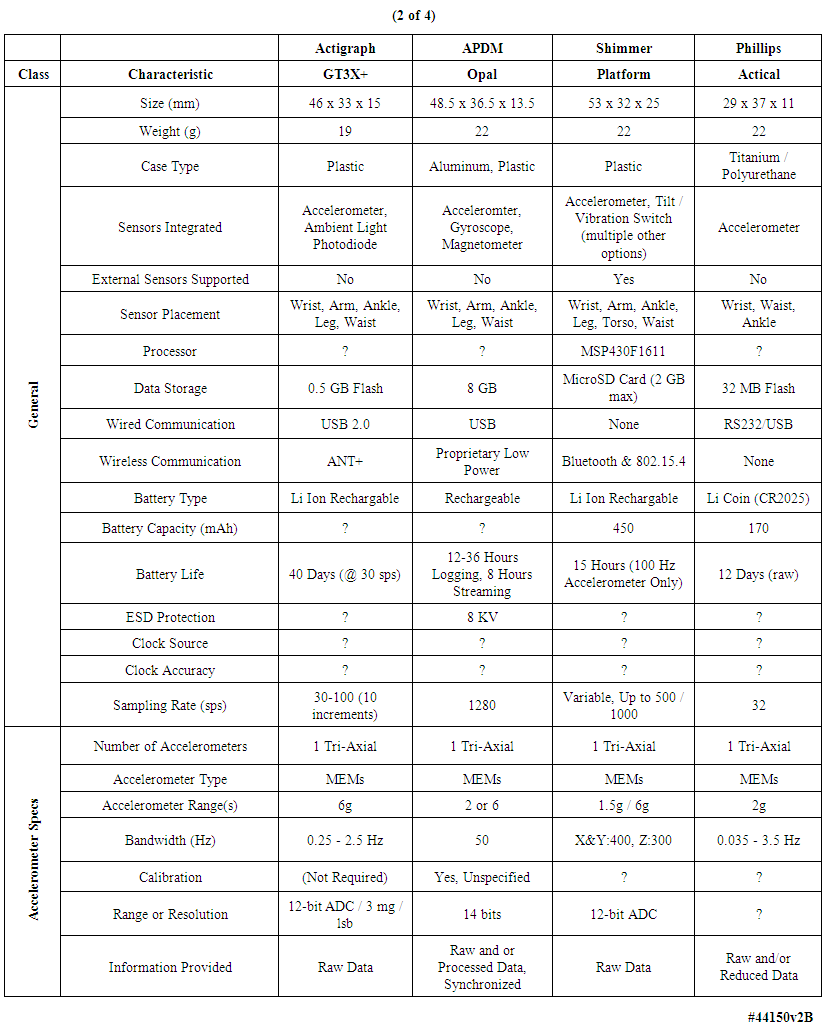
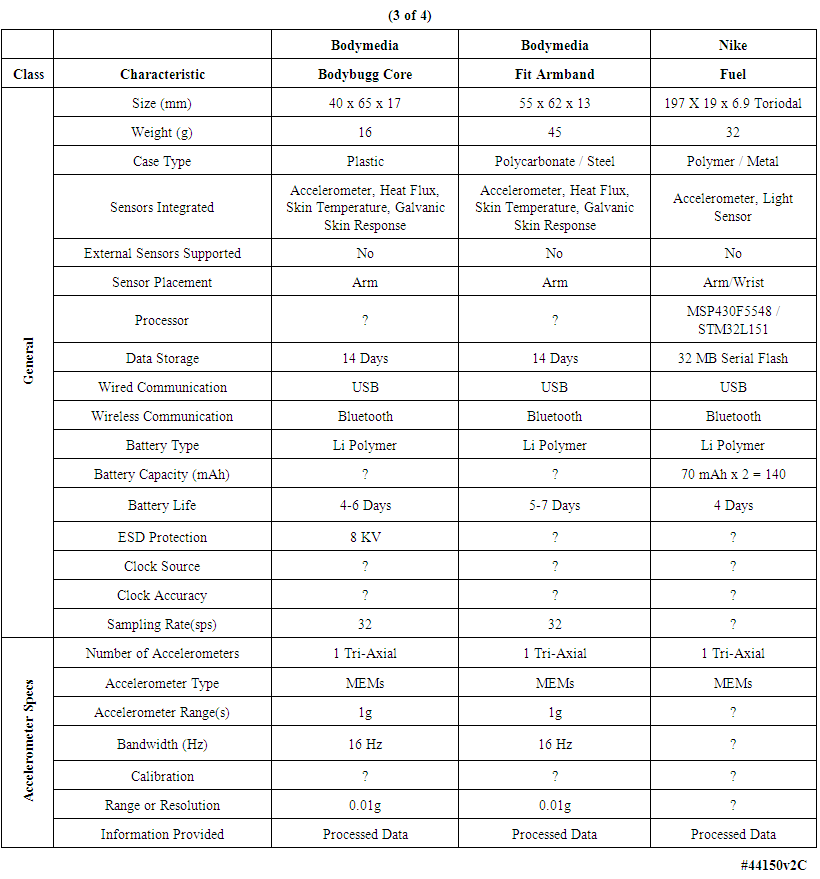
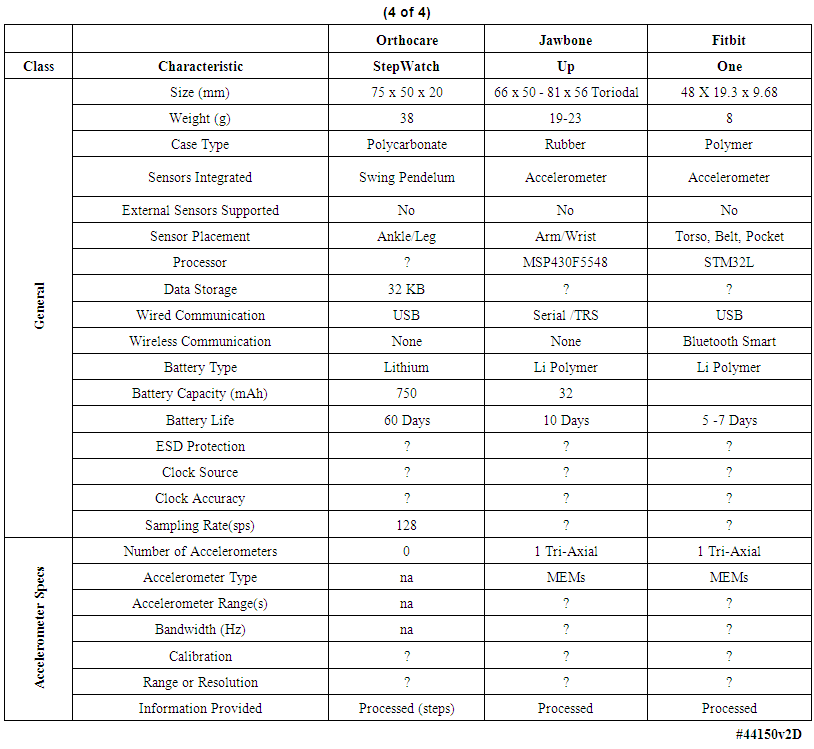
- We examined the functional characteristics of fourteen motion-monitoring body-worn units including our own devices, from a variety of both research developers and commercial manufacturers, to assess their strengths and deficiencies; see Tables 1-4. The columns in Table 1 list the best-documented units, with our unit in the leftmost column of Table 1. The units with the least amount of documentation are listed in Table 4. Within every table, the best documented units are in the leftmost column.Several of the body-worn units in the Tables have been employed and/or evaluated within our host medical center; we have also included a number of the currently popular motion monitoring consumer devices as of 2013 that have not been physically evaluated here. Size, weight, sensor types, etc. appear in the upper rows of the Tables, while specific motion-related sensor information is presented in the lower rows. In some cases well documented specification sheets were obtained from the developers or vendors. However, in many cases information could not be obtained in written form directly from the vendors. Thus, where possible, we obtained information from non-vendor sources such as the so-named “Internet teardown” sites. One vendor specifically suggested that we refer to a teardown site to retrieve information on that vendor’s units, rather than giving the data to us directly. Many vendors were unable or unwilling to provide detailed information for items such as processor types, accelerometer ranges, etc. In addition, many of the specifications, e.g., run times, are dependent on the mode of operation, such as the selected sample rate and whether special functions, e.g. wireless communications, are enabled. For the Mayo device our laboratory tests confirmed 12.8 days of runtime with respect to battery capacity and memory capacity when two accelerometers were enabled, with each accelerometer continuously sampling at 100 samples per second on all three axes, with 12-bit sampling resolution. In this case our stated 12.8 day limit was based on memory capacity; initially the battery capacity would allow an additional 2 days, or 14.8 days, of run time. Other critical parameters were described for only a few of the other units in the Tables. Recent improvements to the unit’s firmware will allow continuous operation for roughly 23 days, considerably in excess of the capacity of the unit’s onboard memory.As another example, clock stability, which as discussed later is important for a number of clinical applications, is listed for the units only in Table 1, and not for the other research or consumer units. Sampling rate is also important, and is listed for most units. Regarding calibration, all four of the units in Table 1 were calibrated, with our units being the only devices that underwent dynamic verification as well as static calibration. One other unit, in Table 2, listed “unspecified calibration”, and one unit in the same table listed “calibration not required”; all others were silent in this regard.
2. Materials and Methods
2.1. Ethics Statement
- All human studies, described in Sections 4.1 through 4.2.2 of the manuscript, were Health Insurance Portability and Accountability Act (HIPAA) compliant and approved by Mayo Clinic's Institutional Review Board, under Mayo IRB Protocols 10-006608, 12-001512, and 12-005076. Informed written consent was obtained from all subjects prior to the studies.In this section we describe both the hardware and software elements that comprise the capability that was the goal of this work. We wish to emphasize the approach to creating a robust system environment, by which is meant attention to detail in such areas as power supply regulation and decoupling, clock stabilization, general circuit board design rules, proper interrupt handling and energy-saving features in both the hardware and the software. Effort applied in these areas was intended to assure an electrically stable, long-lived measurement unit that would produce physiological waveforms free from electrical noise and other operational contaminants, be properly time stamped, and so on. The following sections concentrate on these issues in considerable detail, given their importance in the creation of very robust body-worn systems, and the relative dearth of such information in the published literature. Table 5 provides an abridged bill of materials for those interested in delving more deeply into the details of our specific implementation.
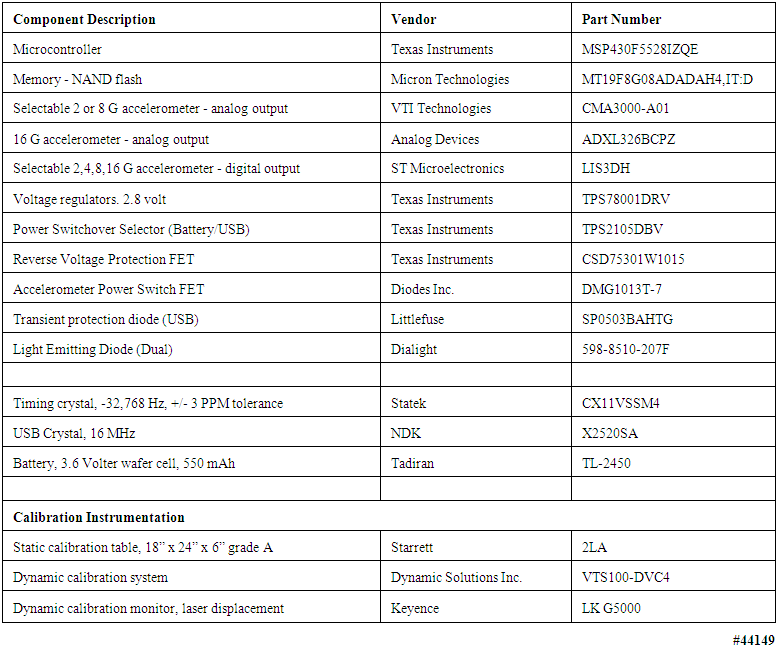 | Table 5. Components and instruments used to assemble and test body-worn units described in this manuscript |
2.2. Hardware Components
- No single design feature of the system depicted in Figure 1 was particularly noteworthy. It was the totality and rigorous integration of all the hardware components with the operating system and applications software that gave these systems a range of capabilities and robustness needed to satisfy the operating criteria described above. All comments below are with reference to Figure 2, a simplified hardware block diagram of the body-worn units, and Figure 3, a photograph of the front and back sides of the unit’s populated circuit board. The numbers at the edges of the microcontroller block in Figure 2 represent, generically, the number of signal inputs and/or outputs assigned to each functional block, e.g., the accelerometers and ECG input, that were electrically connected to the microcontroller.
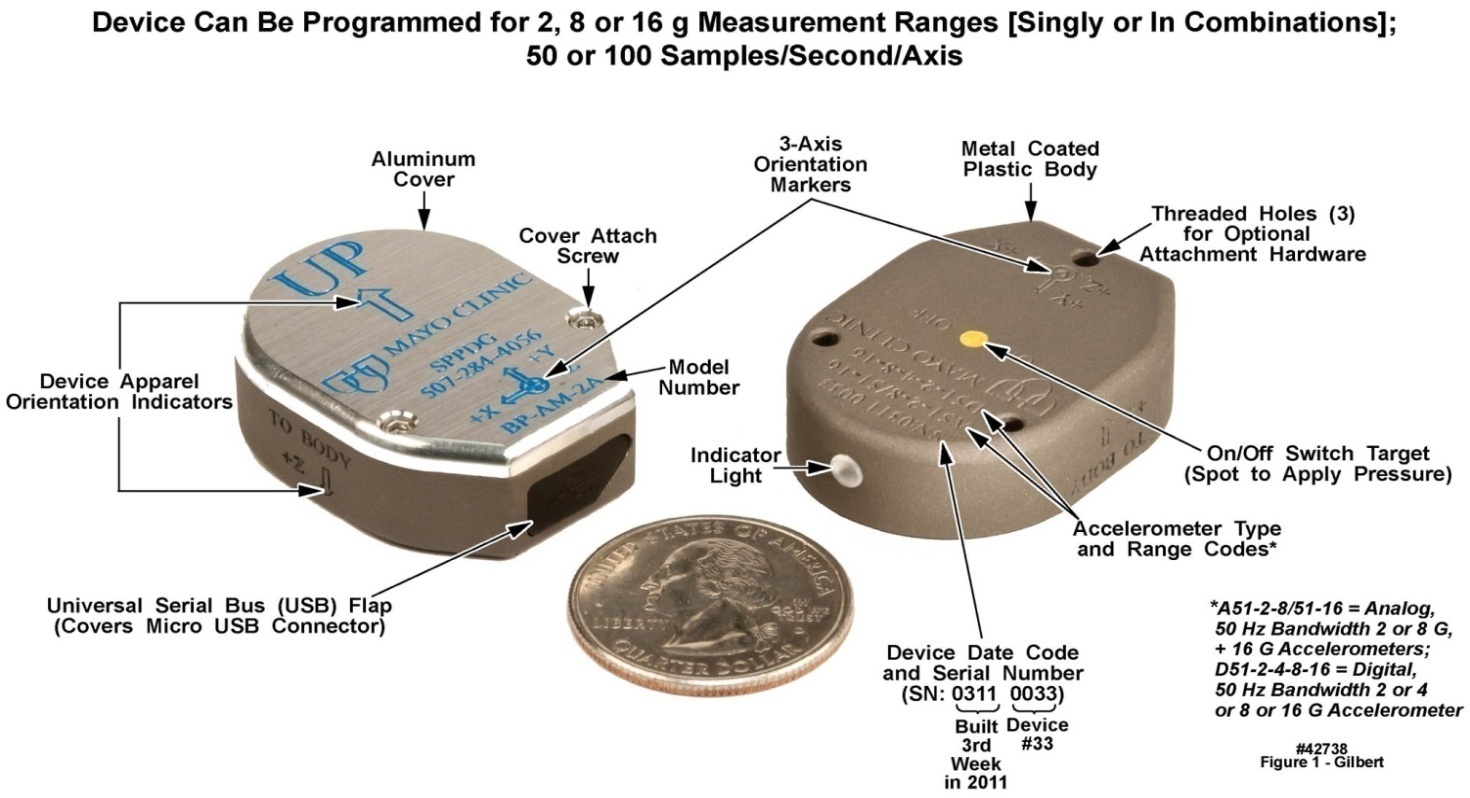 | Figure 1. Upper and lower surface views of the motion-only body-worn unit’s outer case, with distinguishing features labeled. U.S. quarter (23 mm diameter) included for size comparison purposes |
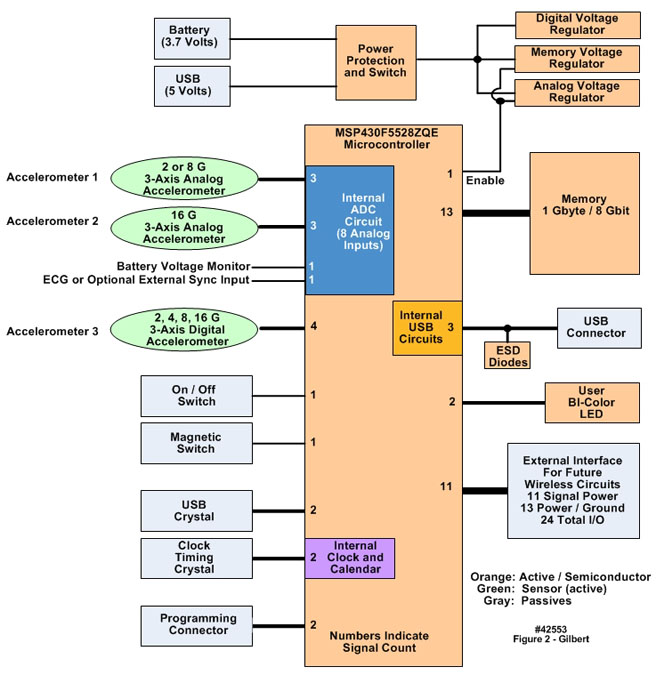 | Figure 2. Simplified block diagram of the motion-only body-worn unit’s hardware configuration |
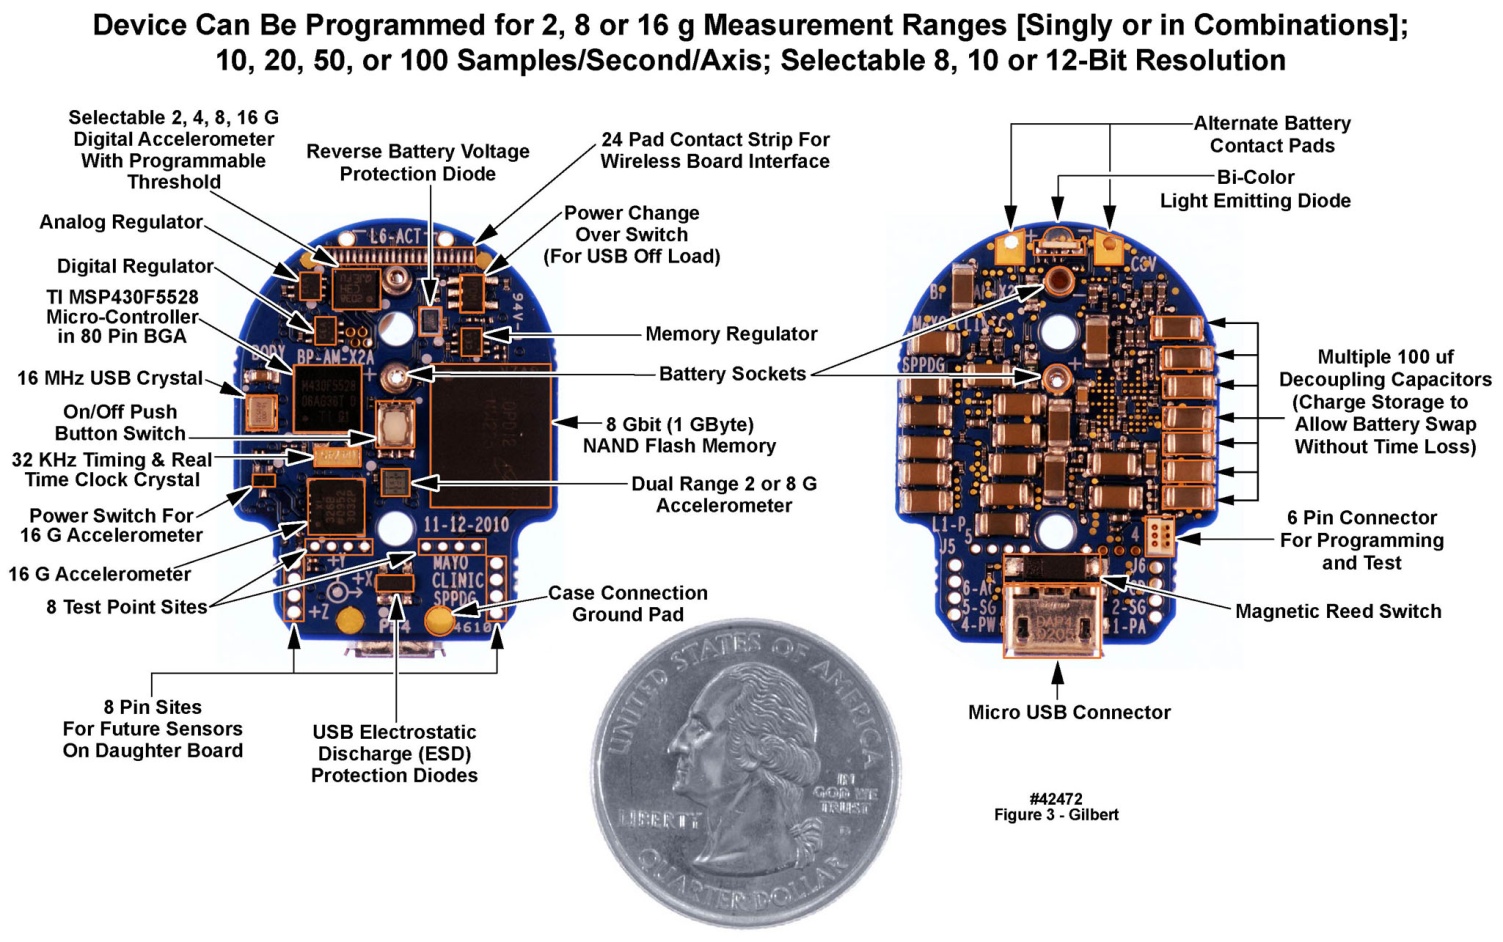 | Figure 3. Top and bottom views of motion-only body-worn unit populated printed circuit board. U.S. quarter (23 mm diameter) included for size comparison purposes |
2.2.1. Sensor-Agnostic System Design: Analog and Digital Signals Must Be Accommodated
- The physicians and clinical researchers with whom we collaborate have requested a wide range of noninvasive physiological sensors. The working list includes some that have been or can be implemented e.g., ECG and respiratory tidal volume, cardiac stroke volume and cardiac output, blood oxygen saturation, angular rotation of the subject, and millibar-sensitivity barometric pressure. However, there are others for which sensors either are not yet robust or not available at all, e.g., blood glucose. All of the physically realizable sensors generate either analog signals or digital bit streams, both of which must be accommodated by the digital inputs to the microcontroller family employed in the body-worn unit, and/or by the 12-bit A/D converter incorporated within the microcontroller. A few analog sensors appear to require 16-bit digitization, a capability that can be purchased commercially but at power dissipation levels that are greater than desired for these units. See the later discussion of the levels of power consumption achieved in these units.All components of the body-worn units were “commercial off-the-shelf [COTS]”; no special effort was made to design custom integrated circuits to achieve either size or power reduction, or to decrease aggregate manufacturing costs. The components used in our body-worn units, including a total of eleven types of active and/or semiconductors, are documented in the uppermost rows of Table 5, including a description of each, the vendor, and the vendor’s specific part number. Next in the table are three additional critical components, i.e., two different types of crystals and the battery. The lowermost rows of Table 5 identify the calibration instrumentation, as noted below in the section describing our static and dynamic calibration methods.
2.2.2. Microcontroller with Integral 12-Bit 8-Channel Analog-To-Digital Converter, and Onboard Nonvolatile Memory
- The selection of the microcontroller for the body-worn unit was based on several demanding parameters, stated as a minimum set of engineering requirements. Low energy consumption was a primary performance driver, since the final size of the unit was dictated by the battery size. Any power reduction implementations directly resulted in a reduction in size or a longer run time for a fixed unit size. The microcontroller selected was a member of the Texas Instruments (TI) MSP430 family of low power yet nearly full-featured devices. The specific features that resulted in the selection of this component were: A) overall low power and low power timing circuitry with an integrated clock and calendar function; B) an internal analog-to-digital converter (ADC) with eight analog input channels; C) processing in a low power architecture with sufficient internal memory; D) an integrated Universal Serial Bus (USB) communication capability; and E) small physical footprint yet with sufficient pins to meet interfacing needs.The microcontroller’s integral 12-bit ADC was a successive approximation design, and as implemented here, had a least significant bit (LSB) resolution of 0.69 mV. The ADC’s input multiplexer supported eight external and four internal inputs. In our design, one of the eight inputs was initially reserved for an event synchronization detector, conceptualized as a passive radio frequency (RF) detector consisting of an antenna, passive filter diode and capacitor, or an ultrasonic transducer. The event synchronization detector would be used, if needed, in conjunction with the high stability clock system already incorporated into the design, as described below. Alternately, we used this pin to accept the input from an analog ECG amplifier in one of the design variations of these units. The nonvolatile memory component was a commercial 1 GB NAND flash component, organized in 2112 byte, i.e., 2048 data plus 64 byte parity, page sizes with an 8-bit wide data bus interface. As noted above, minimization of the power consumption of all the components in the body-worn unit was critical. Because battery capacity is typically measured in milliamp-hours (mAh), knowledge of instantaneous current requirements of individual components led to an understanding of the system’s battery life in hours. The measured average combined current draw of the microcontroller and the NAND flash memory at a 100 samples/s rate on each of four analog input pins was roughly 0.7 mA, and was somewhat lower at lower sampling rates. Recently, firmware improvements have raised the aggregate sample rate across the four analog input pins to 1600 samples/s without increasing the current draw.
2.2.3. Onboard System Timing and Synchronization
- The primary approach to power reduction included all of the following: A) operating the clock at the lowest possible frequency for the needed processing; and B) shutting off the processor clock completely when not needed, i.e., the majority of the time. The shutdown was accomplished in the microcontroller by using an integrated low frequency, low power timer that could run while the rest of the microcontroller was off. The low power timer used an external crystal as its time base. The timer, which was always on, served as the master timekeeping function and timing event sequencer, and included the internal real-time clock and calendar function that kept track of time from seconds, with 1 second time stamp resolution, through minutes, hours, days, month and years. The event sequencing was performed by initiating processes that were triggered by the timer-generated interrupts.All of the low power timing stabilities were dictated by the 32 KHz crystal specifications. The crystal employed in the design had a frequency of 32,768 Hz, with a +/- 3 PPM tolerance. Crystal stability was a critical element of the design, because of the actual usage of the body-worn unit, in which as many as six units were placed on a given volunteer or patient, for durations of up to fourteen days; and we intended to time-align all the data from all units after upload. The impact of the crystal stability was as follows: 3 PPM stability translated to a numerical tolerance of 0.0003% or a time tolerance of +/- 3 μs for each second of operation. Thus after 27.8 minutes the data samples of two independent worst-case crystals could be misaligned by one sample at a 100 sample/s rate. On a longer and operationally typical time scale, two extreme-case +/- 3 PPM devices would be shifted as follows: at one hour, 21.6 ms or 2.16 samples; at one day, 0.52 seconds or 52 samples; and at one week, 3.64 seconds or 364 samples. For some applications, these types of misalignments were acceptable; in other cases, not. These numbers revealed that for long-duration studies with multiple on-body devices simultaneously, where event correlation was critical, high-stability crystals minimized but did not eliminate the data correlation challenges. An alternate approach that has also been employed by others [3, 13] would be to equip every unit with a wireless capability, and periodically arrange for a wireless synchronization signal to be transmitted from one on-body unit, referred to as the “master”, to all the other body-worn units, referred to as the “slaves”, placed on the same subject. The wireless-based approach had the advantage that all units drifted together with the drift of the master unit’s clock, achieving the best possible time alignment. The disadvantage was the increased battery drain in the master’s transmitter and the slaves’ front-end amplifier and detector circuits.
2.2.4. Accelerometers
- The activity monitoring capability of the body-worn unit was implemented by means of three commercially available three-axis accelerometers of several types installed on the unit’s printed circuit board (PCB), two of which had analog outputs and one of which transmitted digital data bit streams. This range of accelerometer capabilities allowed the end user to have the flexibility to select the desired acceleration measurement range, measured in gravitational [g] units, and resolution. The user-selectable ranges spanned +/- 2 to16 g, with several selectable resolutions. Prior experience with an earlier generation of these units [2, 4-5] confirmed the need for this range span for 99% of the normal human body motion measurements. Each accelerometer interfaced directly to the microcontroller and thus they could be used singly or in simultaneous combinations. The interfaces were 3-wire analog for the two analog accelerometers, and 4-wire serial digital for the digital accelerometer. Accelerometer selections were based on multiple factors, including desired g ranges, a low operating supply voltage of 2.8 V, minimal current draw, small physical size, and desired interface options.One of the accelerometers was a fixed +/-16 g (16 g minimum, 19 g typical) range device. External 0.1 μF capacitors were used on the analog outputs to create a filter with a 50 Hz upper 3 dB frequency limit, since the maximum expected sampling rate of 100 samples per second was planned for motion measurements; the filter parameters were tailored as required for other sample rates. These accelerometers were ratiometric, i.e., based on a voltage divider/bridge network, in which all parameters shift together with changes in reference or supply voltage, except for the difference induced by the sensing function. For the 2.8 V supply voltage used in the body-worn unit, the accelerometers’ output voltage span was well within the microcontroller’s ADC conversion range of 0 V to + 2.85 V. This accelerometer had a self-test feature but did not have a built-in power-down function. Thus we implemented the power-down function with an external field effect transistor (FET) to control the power to the accelerometer. We implemented virtually all of the features available in the accelerometer from the manufacturer’s specifications. This accelerometer’s current requirement was approximately 0.35 mA.The second accelerometer was a selectable dual range +/-8 g or +/- 2 g 3-axis three-wire analog component. As described above, external 0.1 µF capacitors were placed on the analog outputs to form a 50 Hz upper 3 dB frequency limit. This accelerometer was also ratiometric; the output voltage range for this device was also well within the microcontroller’s capture range. The accelerometer did not have a self-test function, but did have an integrated power-down function. We implemented virtually all of the features available in the accelerometer, as described in the manufacturer’s specifications. As above, this accelerometer’s current requirement was approximately 0.35 mA.In addition to the two analog accelerometers, we implemented a third accelerometer, with a selectable +/- 2, 4, 8, or 16 g range 3-axis device with an integrated 10-bit ADC and digital 4-wire serial outputs with: a 1.7-3.6 V operational range; a typical current draw of 11 μA at 2.5 μV and 50 Hz sampling rate; a 3.15 mm x 3.15 mm x 1 mm chip-scale package maximum outline; an 800 Hz maximum usable bandwidth for all three axes; 220 µ-g/root Hz RMS noise density (2 g range, 100 Hz sample rate), 1 milli-g/digit sensitivity at 2 g, and a 8 milli-g 12 digit sensitivity at 16 g. This “digital” accelerometer had a self-test function and an integrated 0.5 μA power-down function, an integrated temperature sensor, and provisions for external sensors using three ADC input pins. Two independent inertial/wake-up generators with independent programmable thresholds controlling independent pins can be used to allow a microcontroller to remain in low power idle mode state until awakened by an acceleration event. This feature was a significant contributor to power management.
2.2.5. Printed Circuit Board, Power Supply Regulation and Decoupling
- As noted earlier, extreme attention to detail was required to assure that electrical noise generated by switching transients from the microcontroller and the flash memory would not propagate into the measured data. At least two iterations of the overall design, combined with rigorous laboratory testing and evaluation, were required before a stable system capable of producing and recording high quality measurements was achieved. The areas requiring the most rigorous development were the layer “stack-up” and layout of the printed circuit board (PCB), selection of the optimum voltage regulator components, and the selection and placement of decoupling capacitors, as described in the following sections.
2.2.5.1. Printed Circuit Board
- There are at least two generic approaches to the design of PCBs for body-worn units intended to interface with a variety of sensors. In one approach, a generic “mother board” is designed once, to which may be attached a variety of “daughter boards” containing sensor-specific interfacing and processing components [13]. The other approach, that we have employed, is to design and have fabricated unique single PCBs for each combination of sensors. We selected this latter approach based on other electronic development projects undertaken by us over many years, which have demonstrated that the best control of power supply and ground noise is achieved with a single PCB. Further, the tightest component packing density to achieve the smallest footprint, in all three dimensions of the populated PCB, could be established with the single PCB approach, with components on both the upper and lower surfaces of the board. This implementation format in turn addressed the requests from our clinical colleagues for the smallest possible sizes for the body-worn units. Finally, the PCB designs resided in a computer-aided design software package’s project library, making it straightforward to modify a PCB layout, generate a new design file, and send the design to the circuit board fabricators for a rapid turnaround.The populated double-sided PCB for the motion-only recording unit appears in Figure 3. Active components and selected passive components are identified in this figure. Of the total of 133 components, 13 were semiconductors and integrated circuits, and 120 were passive. The active and semiconductor components were all mounted on one side of the PCB (left panel of Figure 3) along with a small number of passives. The majority of passives were mounted on the reverse side (right panel of Figure 3). Most of the passive components were decoupling capacitors, positioned directly beneath the active component locations, and connected to one another with “through vias”, to minimize the physical distance and thus the loop inductance in the decoupling paths. Despite the additional manufacturing costs incurred, the PCB used in this design contained six metal layers, to assure excellent power and ground distribution by minimizing return-path inductances and to separate and shield the signal layers through adjacency to the AC ground layers. The layer stackup was as follows: L1: Top (active) component (plus ground metallization); L2: Upper signal layer; L3: Power planes (multiple voltages); L4: Ground plane; L5: Lower Signal layer; L6: Bottom (passive) components and ground metallization. The power plane layer (L3) was positioned to maximize the capacitance between the power metallization and ground (L4). The signal layers (L2 and L5) were isolated from one another and were positioned between a plane layer (power or ground) and the corresponding component layer with a ground metallization to maximize signal trace shielding. We also implemented a fully functional physically flexible equivalent of this system, i.e., the entire populated circuit board could be bent back and forth into a convex or concave arc. In this “demonstration unit” we traded larger “x” and “y” dimensions for a smaller “z” dimension, on a flexible “flex circuit” substrate, that would fit under a large band-aid, to test and verify the concept. This larger but thinner flexible version, which employed a thin-film rechargeable battery in place of a “circular wafer cell” primary battery, appears in Figure 4. Sixteen of these flexible units were assembled and evaluated in our laboratory, but have not been deployed into the field.
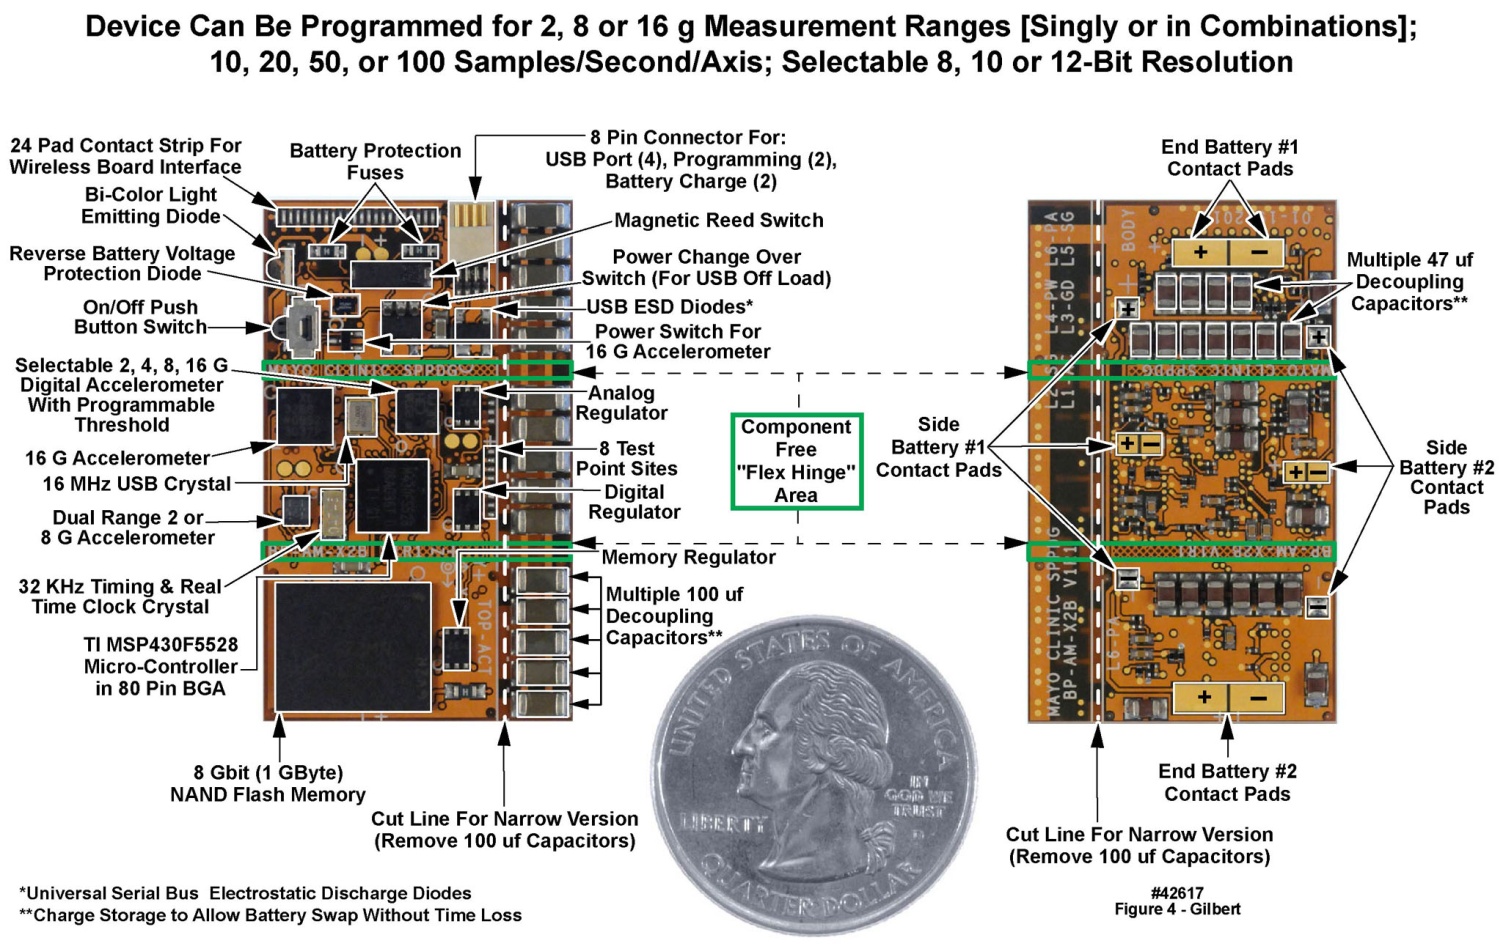 | Figure 4. Top and bottom views of motion-only body-worn unit populated flexible (“flex”) printed circuit board. U.S. quarter (23 mm diameter) included for size comparison purposes |
2.2.5.2. Battery Characteristics, Voltage Regulation and Decoupling
- The battery selected for the body-worn unit was a 3.6 V primary-chemistry circular wafer cell with a 550 mAh rating, a fairly small mAh capacity for a system designed to operate for up to two weeks. Considerations of battery capacity and battery output resistance drove the design of the voltage regulation subsystem to assure a low electrical noise environment for those components that could be affected by noise on the voltage supply rails. The low-noise requirement in turn mandated a stable, low-noise power and signal environment. To achieve these goals, three separate and isolated regulated supply voltages were used for, respectively, the analog, digital and memory voltage feeds (“rails”). Each rail was controlled by a separate low dropout, low quiescent current adjustable voltage regulator with a shutdown capability. The shutdown current for this regulator was 0.13 μA maximum, and the operating quiescent ground pin current with a 1 mA load was less than 1 μA. These low currents were critical to minimize system power consumption.The analog regulated 2.8 V supply was used for the two analog accelerometers and the digital accelerometer. The analog supply rail also served as the external reference input for the microcontroller’s integral ADC, in turn allowing the sensitive analog circuits to be separated from the noisy digital circuits. This design approach also allowed the analog circuitry to be shut down completely when not in use. The analog supply rail was decoupled with 0.22 μF, 2.2 μF and 100 μF capacitors at the regulator inputs and outputs, and with 0.22 and 2.2 μF capacitors at each accelerometer and at the voltage reference input to the microcontroller. The digital regulated rail was 2.85 V and supplied the microcontroller digital and analog power inputs as well as the “unit is operating” light-emitting diode (LED) and power switch (Figure 1). The digital supply rail was always “on”, but the microcontroller was in low power mode most of the time with only the clock timer running, consuming nominally 6 μA maximum. When the microcontroller was activated to perform an operation such as writing to memory, the current demand could approach 35 mA, i.e., the microcontroller and memory “write currents” combined, for brief durations (several milliseconds).In addition to the average current, Figure 5 illustrates the dynamic nature of the current consumption. The uppermost waveform was a complete test cycle, i.e., testing each operational state of the device: power on, idle, start, “operating”, and stop. The majority of the current was consumed in the unit’s “operating” state. For the majority of the “operating” time, the units were in a low power state, with occasional high-power transients. Power consumption in the “operating” state is presented in the color-shaded rightmost portion of the upper panel, expanded for better visibility in the middle panel with the same color shading. The region within the dark vertical line in the middle panel is expanded in the same darker shading in the lower panel. Data writes to the NAND Flash memory, and the brief illumination of the LED to alert the wearer that the unit was functional, created momentary high transient currents. Note that the “average high” current, “average” current, and “average low” current are all depicted in one or more of the three panels of Figure 5. The dashed “high-low separator” line indicates the region above which values were averaged to compute the “average high” current and incorporating all of the high current spikes. The area below the separator indicates the region below which values were averaged to compute the “average low” currents; the “average” was based on all samples. The upper panel of Table 6 presents the statistics for the unit’s “on” state. These high transient currents motivated us to isolate the analog circuits from the digital supply rail, as already described.
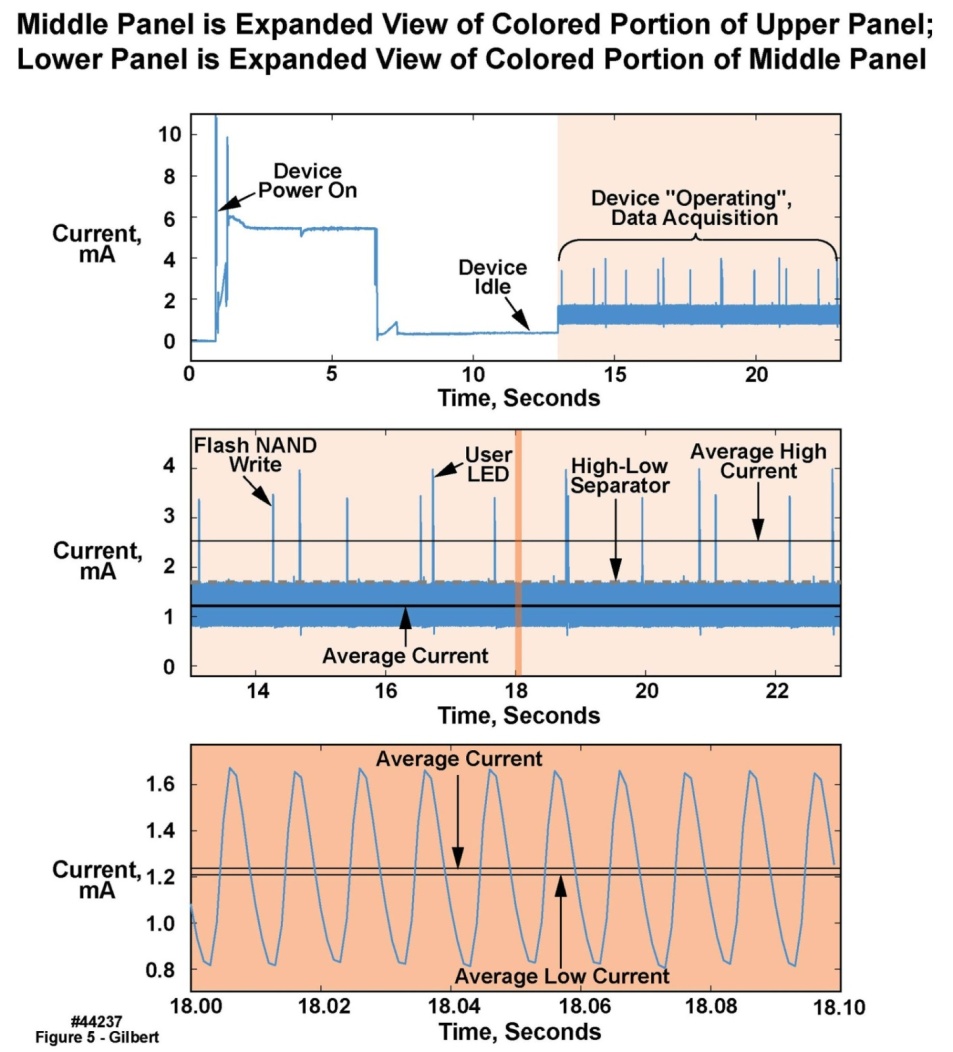 | Figure 5. Current consumption test of motion-only body-worn unit with both 2 g and 16 g accelerometers turned on, at 100 sample/second/axis sampling rate |
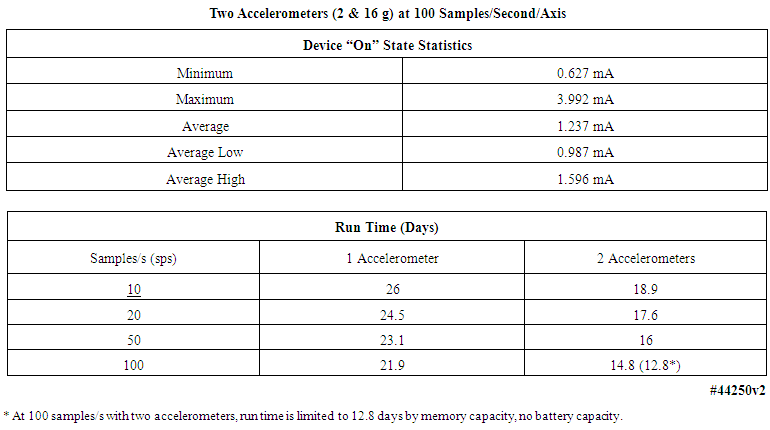 | Table 6. Current consumption statistics and operating durations of motion-only body-worn units |
2.2.5.3. Outer Case Design
- As is visible in Figure 1, the motion-recording body-worn unit’s case consisted of two primary components, a nickel spray-coated polycarbonate bodyand an aluminum lid. These two components mated together in a clamshell design, with the two halves held together with two stainless steel socket cap screws and helicoil capture elements. The overall dimensions of the case were 1.09” wide by 1.44” high by 0.497” deep, i.e., approximately the surface area of a U.S. quarter, and the thickness of a stack of seven quarters. The body or upper side of the case provided the following functions: A) an environmentally sealed access to the unit’s power button, located in the center of the case and marked with a yellow dot that had to be depressed for three seconds to activate or inactivate the unit; B) a light pipe from an LED mounted on the unit’s PCB, indicating that the unit was operational; C) the USB micro-connector, accessed behind a water-resistant synthetic rubber dam; D) environmental protection for the unit’s electronics; E) protection of the activity monitor from the physical environment; F) electrostatic shielding for the unit’s electronics by means of the nickel spray coating; and G) the majority of the engraved text applied to each unit, e.g., serial number, etc.. The lower side of the case: H) functioned as a lid to protect the unit from the environment; I) contained additional engraved text that was unique to each unit; and J) completed the unit’s protection from ESD events. In regard to the electrostatic shielding, several units were tested to ESD safety levels of 15 KV (ANSI/ESD S20.20-1999) and remained functional thereafter.
2.2.5.4. System Operating Duration
- As noted above, the primary battery employed in this system was rated at 550 mAh. The total current requirement of the system, comprised primarily of the microcontroller and flash memory, and two three-axis accelerometers of (0.7 + 0.35 + 0.35) mA or 1.4 mA at 100 samples/s, divided into the 550 mAh capacity of the battery, yielded a total run time of 392.8 hours, or roughly 16 days, or more conservatively 12-14 days, assuming 24/7 operation. Lower sample rates extended the operating time on one primary battery, as described in the lower panel of Table 6. Further, if the body-worn unit used rechargeable batteries, all the operating durations listed in the following table would decrease by roughly a factor of three, due to the much lower energy density of the rechargeable battery chemistry. All values in the lower panel of Table 6 assumed the installation of a fresh primary battery, and were worst-case numbers; the entry with the * denotes that at that sample rate and with two accelerometers, the 1 GB flash memory filled in 12.8 days, whereas the battery capacity would allow operation for 14.8 days. As noted earlier, recent improvements to the unit’s firmware have increased the total run time of the units by roughly 50%.
2.3. Software Environment
2.3.1. Operating System
- Because all of the intended actions of the body-worn unit were “real time” functions, we prepared a small-footprint “cooperative” (as opposed to “preemptive”) Real-Time Operating System (RTOS), written in the C language, to run on the unit’s microcontroller. By “small footprint” is meant: the barest minimum number of instructions executed per unit time, and the total number of code lines rigorously minimized. Although capable of executing multiple tasks simultaneously, the RTOS’ small memory footprint resulted in a low power consumption, a necessity given the unit’s small 550 mAh battery and the required operating duration between battery changes (Table 1). To achieve a low power consumption the RTOS executed on a hardware event-driven basis. By triggering execution based on hardware-driven interrupts, the microcontroller’s central processing unit could reside in a low-power mode most of the time, along with any hardware modules not being used. The hardware events executed in the “foreground”. When a hardware-driven interrupt occurred, the microcontroller’s hardware interrupt structure determined the present device state and spawned a software process to the RTOS if needed. The spawned processes executed in the “background”, when the hardware-driven events were not being handled. Once a background process completed, the microcontroller’s central processing unit began executing the next background process if one was listed in a scheduling “queue” for processing. When all background processes were complete, the processor returned to low-power mode. This method resulted in a very low energy implementation; by comparison, traditional preemptive and time-slicing RTOS’s are always running and in control, thereby constantly consuming energy. Fully preemptive thread/process RTOS context switches are much more expensive, also increasing energy consumption. In the configuration that we implemented, the RTOS was subservient to the hardware events. The time between the events was efficiently used in low-power mode. The overall multi-tasking was in effect a coordinated effort between the hardware events and the cooperative RTOS.
2.3.2. Data Offload
- The operating system incorporated a software module that allowed recorded data to be offloaded into a laptop computer through a micro-USB connector at one end of the body-worn unit. The connector was covered by a water-resistant rubber dam when not in use (Figure 1). The laptop in turn was loaded with a specialized program that established a “handshake” with the data transfer software in the operating system to empty the contents of the unit’s memory onto the laptop’s disk drive.
2.3.3. Application Processes
- When a process, i.e., an “application” in conventional parlance, was pushed to the RTOS for execution, it was added to the scheduling queue. When a processing time slice was available the process began execution, and continued to execute in the background until the process relinquished control; foreground events continued to be handled as is typical for cooperative operating systems. The process could relinquish control by completing its task or pushing itself again onto the RTOS queue and exiting. Also as is typical of cooperative operating systems, considerable care had to be taken during code development to prevent a background process from preventing other background processes from gaining access to CPU cycles, a minor development tradeoff compared to the power savings achieved with this type of operating system.A design provision was also added to allow a delay before a process began to execute. An example of a case when a delay might be needed was when a process needed to retry a task, such as in the creation of a radio frequency (RF) link for those of our body-worn unit versions, described later, that supported an RF capability. A process might have needed to attempt a link request multiple times before a connection was established successfully. Instead of staying in the execution state, a process could relinquish control to other processes or allow the microcontroller to return to the low-power state; after the delay expired, the process could run again, e.g., to retry to establish a link.
2.4. Static and Dynamic Calibration of Motion-Only Body-Worn Unit Accelerometers
- It has been pointed out in the literature [5, 9] that there is a need for calibration of individual body-worn units. While the “unit calibration” procedure for each type of sensor incorporated into body-worn units will be different, here we describe the calibration steps for the three three-axis accelerometers in the motion-only units described herein. Every single body-worn unit was calibrated, both statically and dynamically, along all three axes in both a positive and negative orientation (±x, ±y, ±z). Test data was reviewed for every unit, and we rejected the device if unit failure, e.g. a faulty bandwidth limiting capacitor, or an inability to calibrate, were detected.
2.4.1. Static Calibration in x, y, and z Axes
- Inaccuracies associated with accelerometer manufacturing tolerances, packaging assembly and enclosure fabrication misalignments on the body-worn unit’s circuit board were mitigated using a static calibration process. The static test provided an initial reference measurement for six degrees of freedom and ensured basic device functionality. The testing was accomplished with a combination of precision metrology equipment, gravity as the reference, and data analysis. Specifically, after final assembly, four devices were placed within a six-sided precision machined fixture. The devices were turned on and the fixture was placed on a grade “A” surface plate for the duration of one minute per side, or a total of six minutes. A precision ground angle plate was used in conjunction with the surface plate to ensure orthogonal measurements maintained between the surface plate and fixture. The NIST-traceable metrology equipment and specifications used in the static calibration were as follows (see Table 5): 1) an 18 inch x 24 inch x 6 inch grade A, two-ledge precision inspection table with 0.00051 inch flatness across the surface plate; 2) a V-step precision ground angle plate, 0.0002 inch square and parallel; and 3) a machinist’s level calibrated at 0.005 inch/foot/division. Offline processing calculated the required calibration matrix to compensate for offset, amplitude, and cross-axis errors. The static tests described in the following paragraphs were conducted on the 2 g and the 16 g accelerometers. The figures presenting these results are from the 2 g accelerometers, with the exception of Figure 7, which presents16 g results. All of the 2 g calibration charts have companion 16 g charts, showing similar results, but are not presented here in the interest of brevity.Figures 6 and 7 present the collected samples from the static test and the result of the applied calibration matrix, for the 2 g and 16 g triaxial accelerometers respectively, on one body-worn unit, recorded over approximately seven minutes. The leftmost panel of waveforms in both figures depict the uncalibrated samples, while the rightmost panel of waveforms depict the calibrated samples. From the plots it may be observed that the precalibration errors in all three axes for both accelerometers were considerable, i.e., were substantially different from 1 g and 0 g, which in turn had a large effect on angle measurements calculated from the x, y, and z measurements. Note that the postcalibration data errors were reduced significantly. Thus it was clear that to achieve precise measurements, device calibration was required. The lowermost waveforms, in both the left and right panels, were the calculated y-tilts from the three axis data. The y-tilt was the angle between the reference y-axis (0, 0, 1) and the tilted y-axis (0, ~0, ~1). The reference was the 0 degree position: z+ was aligned with gravity and the y+ was orthogonal, pointing towards the front of the test assembly. For these angles it was especially obvious that the uncalibrated y-tilt angles were far from nominal, but the calibrated y-tilt angles were as they “should be”. In the following sections the post-calibration mean error and 2σ deviation will also be quantified.
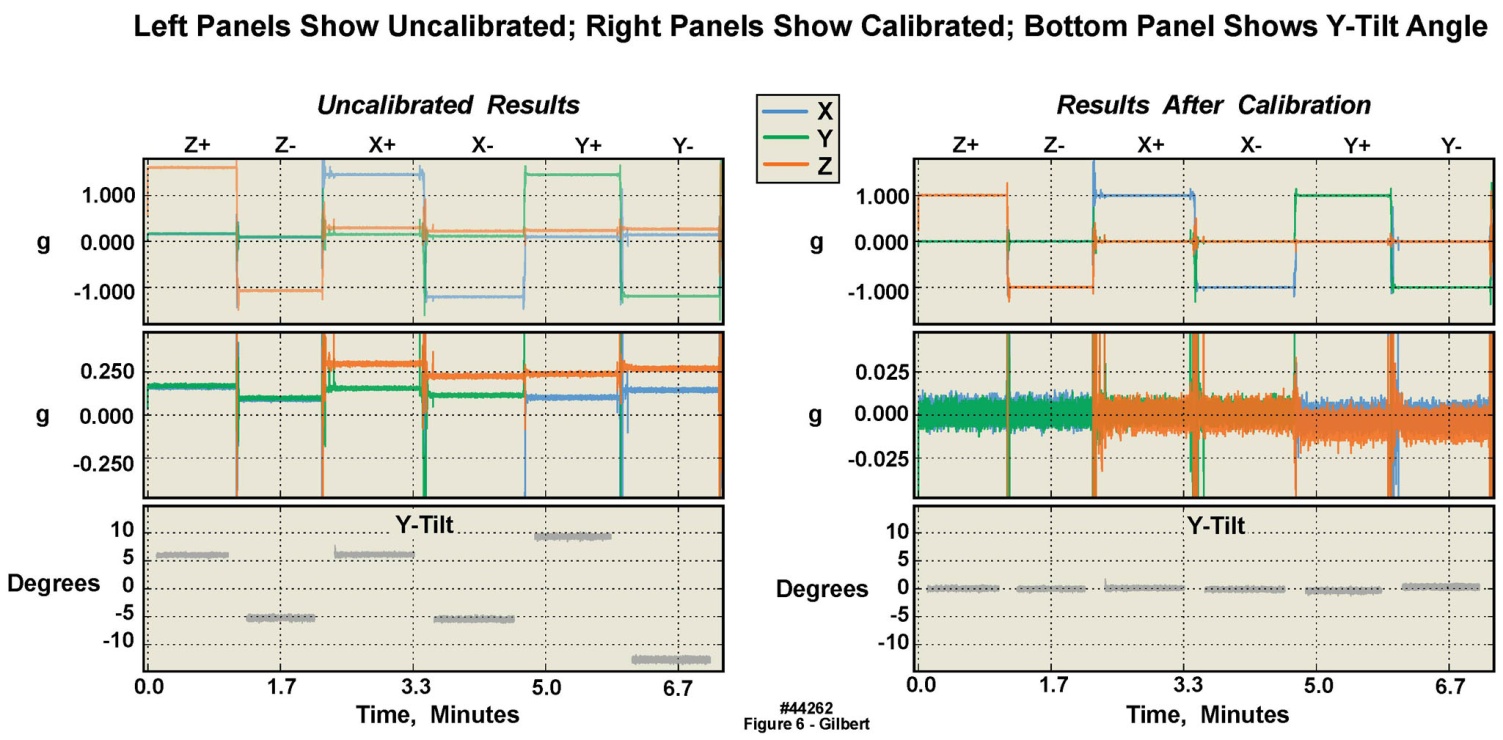 | Figure 6. Static calibration of 2 g accelerometer in six orientations in a single motion-only body-worn unit, illustrating significant offsets from “true” in uncalibrated versus calibrated data |
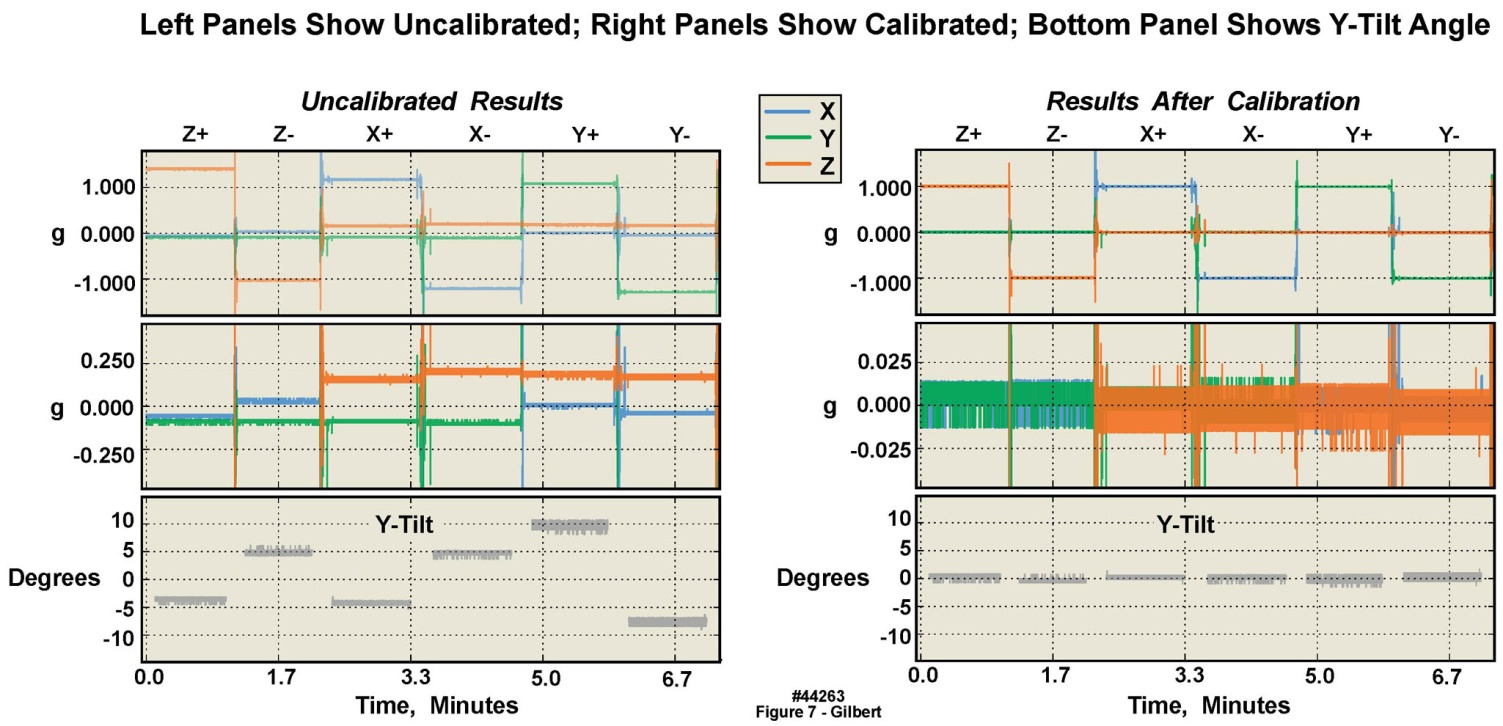 | Figure 7. Static calibration of 16 g accelerometer in six orientations in a single motion-only body-worn unit, illustrating significant offsets from “true” in uncalibrated versus calibrated data |
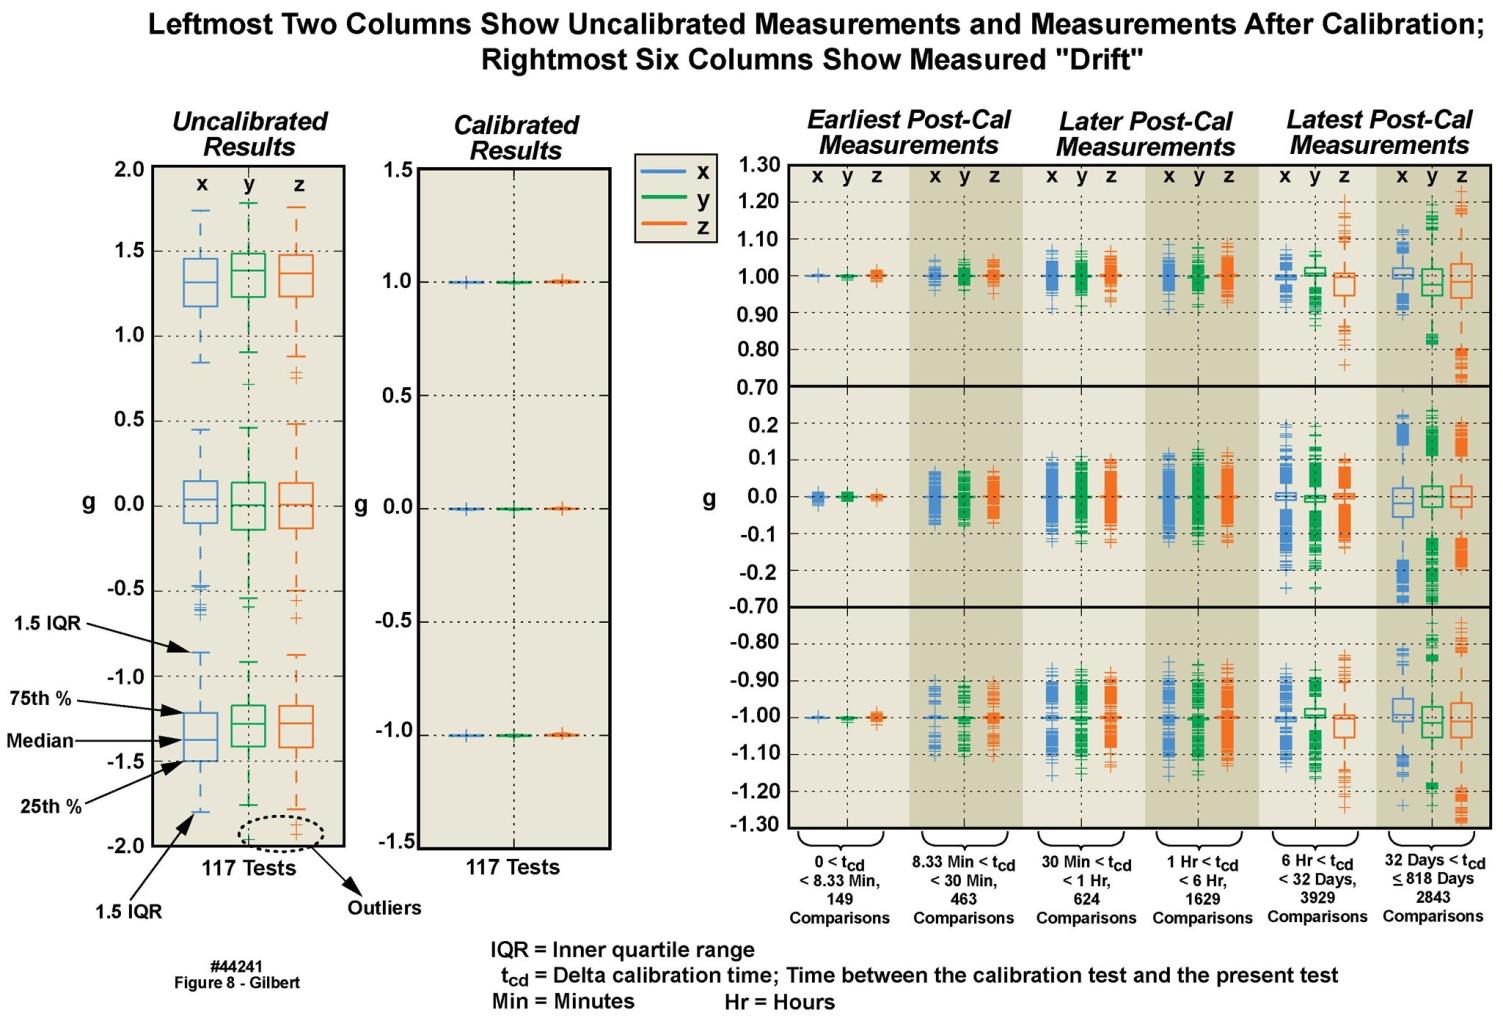 | Figure 8. Calibration variations in 2 g accelerometer among multiple motion-only body-worn units over an 818 day duration |
- We developed automated, purpose-specific algorithms which documented in a series of Excel spreadsheets a summary of acceleration values, including the minimum, maximum, median, mean, standard deviation, vector sum of the three axes, axis dependent slope, and axis-dependent 0 g offset of every body-worn unit. Frequency domain analysis was also included in the Excel summary for each sequence to evaluate the spectral characteristics of electrical noise in each unit. Additional analysis was executed with specially prepared Python programs. The resulting calibration data was made available to the end users.
2.4.2. Calibration Error and Angle Measurement
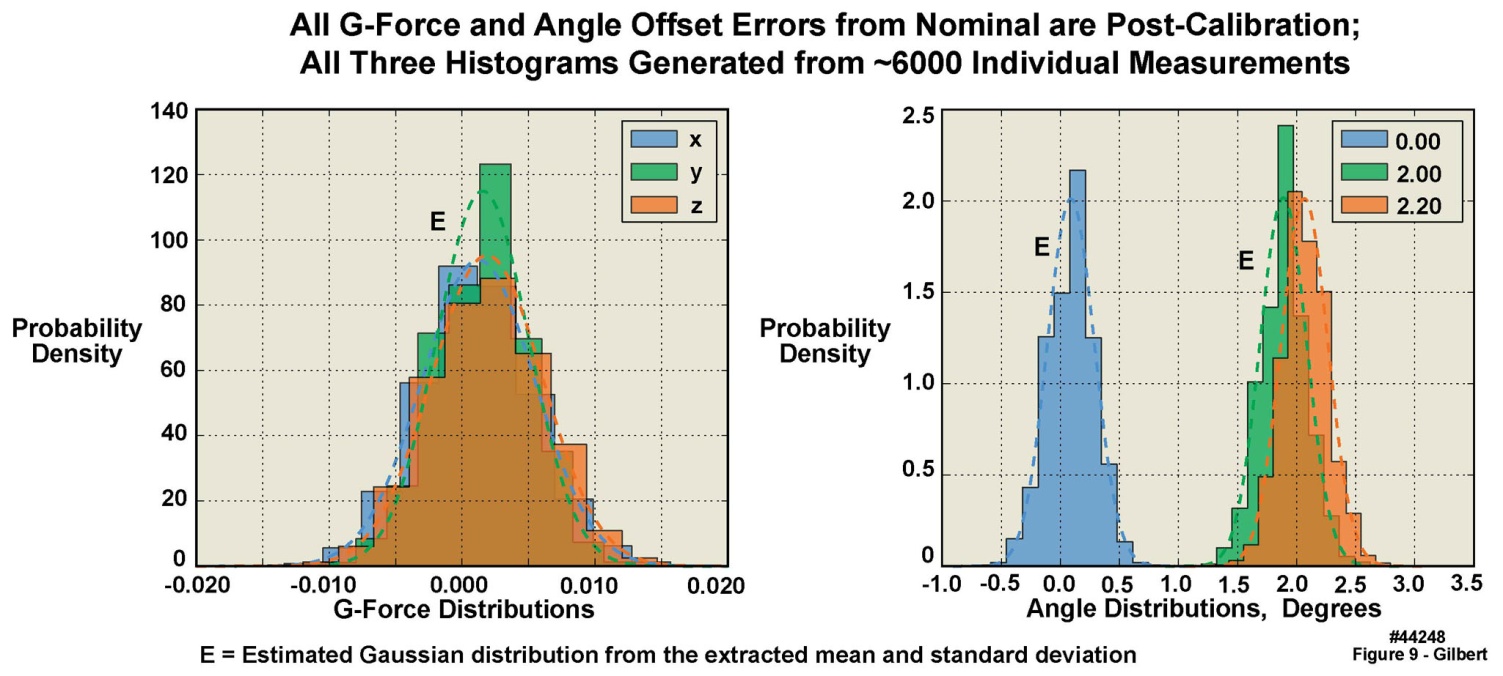
- Accurate angle measurements are important for studies such as gait integrity and limb range-of-motion analyses. To determine the angle accuracy of the units, an angle test was established, with tight controls on the test surface (see Section 2.3.1), employing a sine-bar and NIST-traceable gauge blocks, with four randomly selected units. The test was constructed such that one edge of each unit under test was raised from the horizontal by an accurately known number of degrees, creating an angle between the gravity aligned axis of each unit and the reference axis in the test fixture. The angle test suite uncertainty analysis demonstrated that the precision of the test configuration was ± 0.03 degrees (2σ uncertainty). The angle tests were performed in a manner similar to the x-y-z static tests described above: the units were positioned sequentially on each of their six sides on the sine-bar, with established offset angles of 0, 2.0, and 2.2 degrees. Figure 9, based on 6000 separate measurements, presents the results of tests of the 2 g accelerometers (again, with similar results from the 16 g accelerometers). The leftmost panel in this figure displays the measured g-force sample distributions when no gauge blocks were used to create an angle offset, i.e. 0 degrees. However, note that the values plotted are the offsets from either the 0 g or the 1 g readings, because the individual accelerometers in the triaxial set were not always perfectly aligned in the x, y, and z directions. These values are not the measured g-forces themselves, except for the one accelerometer that would naturally register a 0 g value with some offset error. The rightmost panels in this figure display the three different angle offsets created with the sine bar and gauge blocks. If the accelerometers themselves, and their alignment on the circuit board, were “perfect”, there should have been three spikes, one at 0 degrees, one at 2 degrees, and one at 2.2 degrees. However, because the accelerometers and their alignments on the circuit board were not “perfect”, a distribution of values was observed. Note that the measured distributions in Figure 9 appeared to agree with Gaussian distributions calculated from the mean and standard deviation of the measurements. However, in all cases, the measured mean values of the x and z tilt angles differed from their “perfect” values by less than .2 degrees, and for the y tilt angles, less than .4 degrees. Table 7 presents, for both the 2 g and 16 g accelerometers, the sample statistics for the 0 degree flat sine-bar, i.e., the measured statistical deviations from 0 g and 1 g when the units were placed in the six different orientations on the test surface. Note that in these tables, the numbers of digits to the right of the decimal places are not overstated, because they are with reference to the measurements that we made based upon the accuracies of the Starret surface plate, the Mitutoyo gauge blocks, and the Suburban Tool sine bar.
 | Figure 9. Angle and g-force test sample distributions of 2 g accelerometer in four motion-only body-worn units |
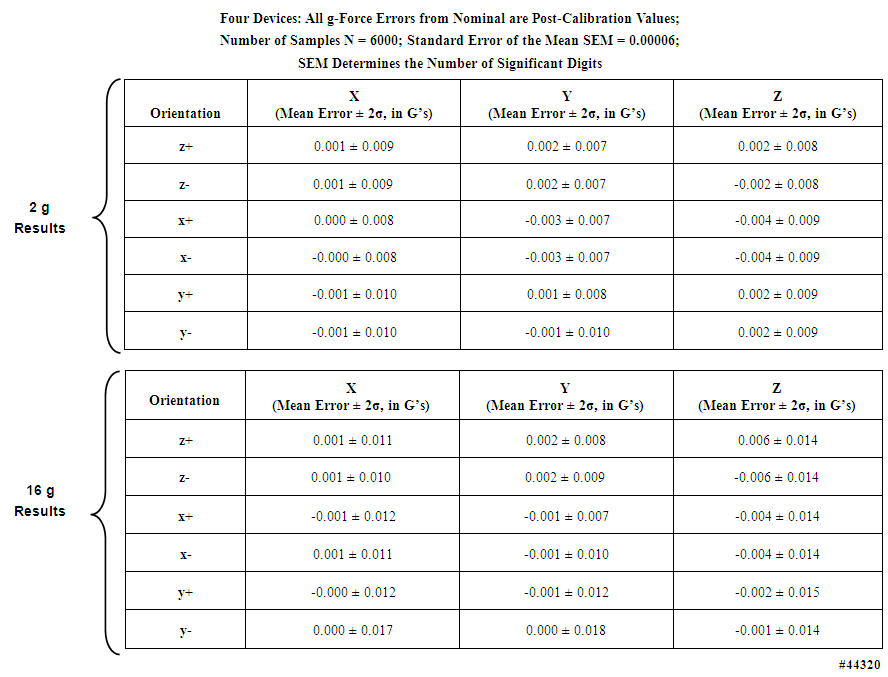 | Table 7. Static test sample distribution statistics of g-forces measured with 2 g and 16 g accelerometers in four motion-only body-worn units |
- Table 8, for the 2 g accelerometers, lists the mean error and uncertainty for the three measured angle offsets, in all six orientations (results for the 16 g accelerometers can be found in the Supporting Material). Table 9 lists the expected angles for all three tilt configurations for both the 2 g and 16 g accelerometers; four devices were verified. Figure 10 displays, for the 2g accelerometers, in the leftmost panel, angle measurements plotted for a complete angle test cycle during a forty-minute duration for the two degree test angle, while the rightmost panel tabulates the expected offset angles for the 2 degree reference tilt in all six orientations.
2.4.3. Dynamic Calibration in x, y, and z Axes
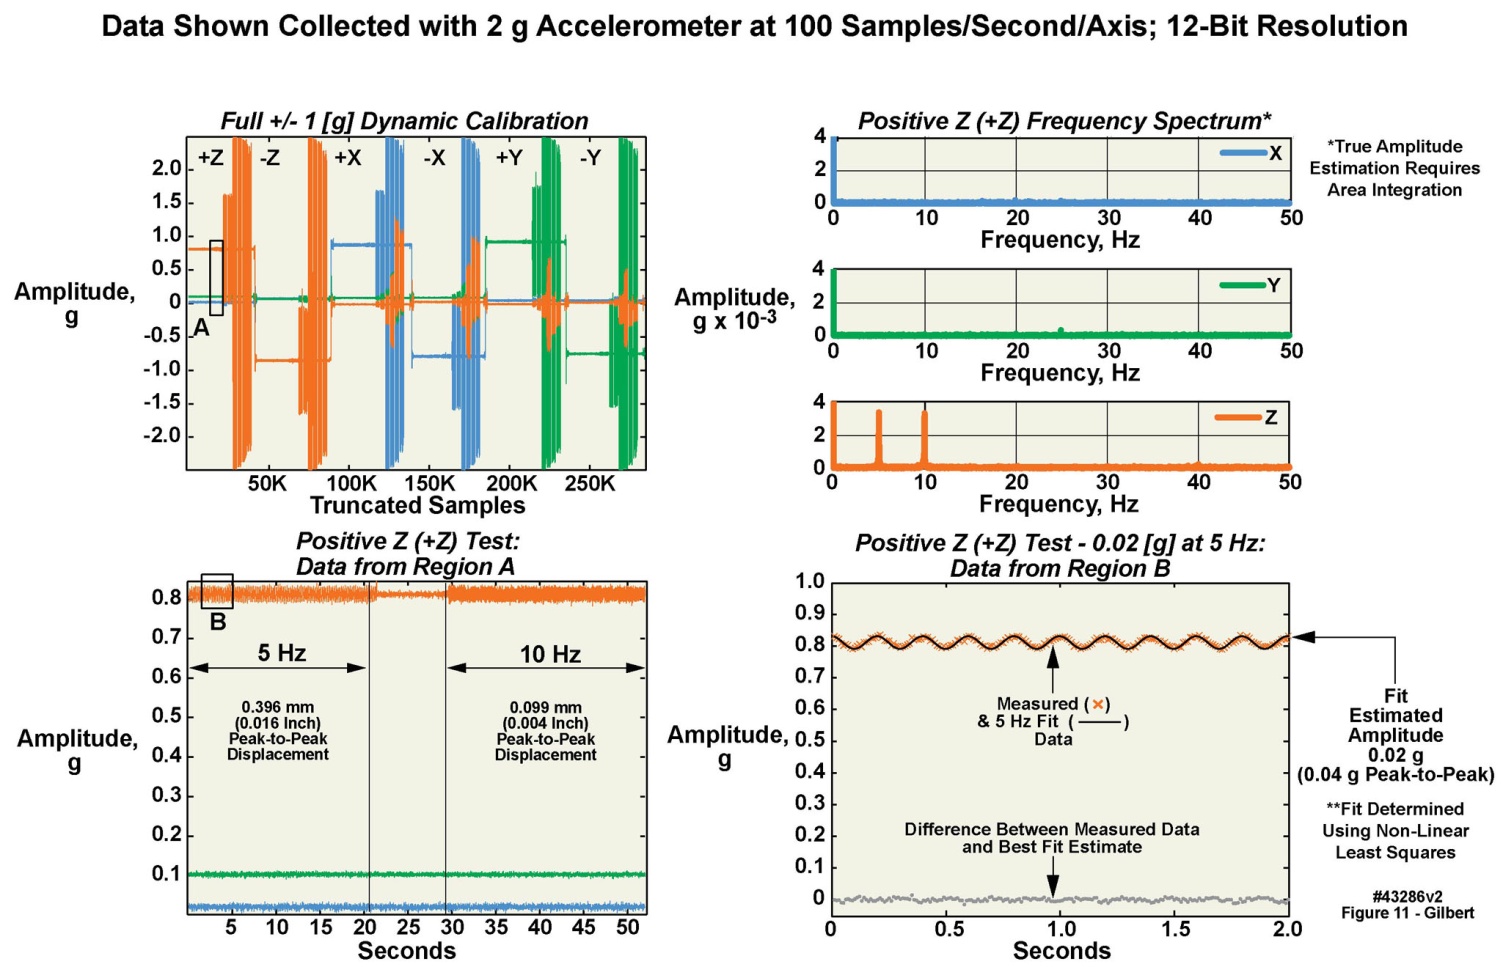
- Here we present a condensed description of our method of dynamically calibrating the motion-only body-worn units. A more thorough exposition of this somewhat complex process is available upon request to the corresponding author. The body-worn units were dynamically tested through a range of frequencies and gravitational loads, to calibrate their dynamic response, as illustrated in Figure 11 for the 2 g accelerometer in a single motion-only body-worn unit. Similar tests, with similar results, were conducted for the 16 g accelerometer in the same unit. Calibration was initially accomplished solely using a vibration test system (i.e., a “shake table”; see Table 5). The test platform allowed dynamic testing of up to sixteen units simultaneously. The units were subjected to acceleration rates of 0.02–15 g in four steps of 0.02, 1, 7, and 15 g (Figure 11 presents the data from the .02 g tests). At each step, two different test frequencies and associated different mechanical displacement levels were used. The frequencies spanned a range of 5-40 Hz in steps of 5, 10, 15, 20, 30 and 40 Hz. Six different positions were used to obtain +x, -x, +y, -y, +z and –z data. A piezoelectric accelerometer mounted on the test stage provided iterative closed loop feedback and could be referenced back to National Institute of Standards and Technology (NIST) test procedure TP3002. We augmented the piezoelectric accelerometer with a NIST-traceable laser displacement measurement unit as well. The dynamic verification was conducted at four maximum acceleration values spanning the useable range of all of the accelerometers. The dynamic test data was then offloaded from the sixteen units, and stored along with the laser displacement data. All data was made available to the end users in a similar fashion to the static test results. Figure 11 displays results from the test sequence as well as portions of data obtained from the dynamic tests for one unit, of the 2 g accelerometer, as the unit was sequenced through the four g levels and each of the six positions. The test sequence began with a quiet period with no acceleration other than gravity, as may be observed at the left portion of the figure. A positive acceleration of about +0.85 g is indicated on the z accelerometer axis (orange trace), and a slight positive indication on the x accelerometer axis (blue trace). The y axis is near zero. These traces mark the static gravitational level; at this phase of the test sequence no correction values had yet been applied.
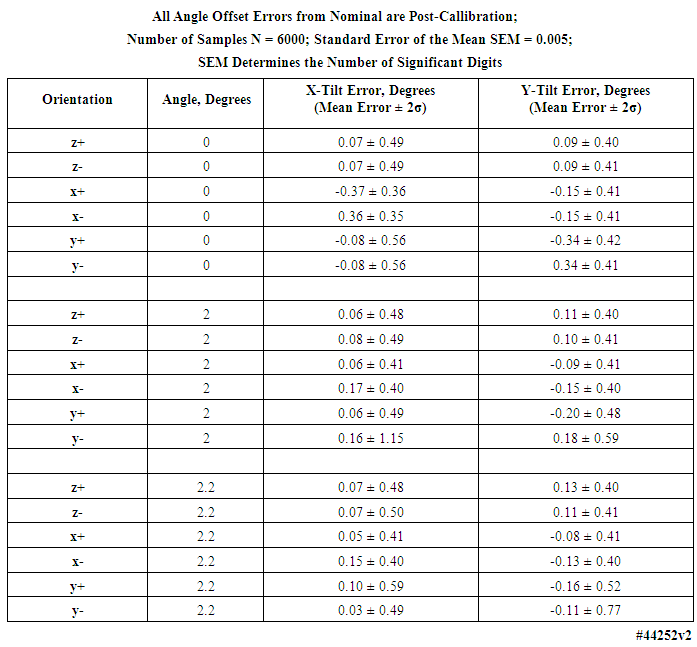 | Table 8. Angle test sample distribution statistics for 0, 2, and 2.2 degrees of tilt measured with 2 g accelerometers in four motion-only body-worn units |
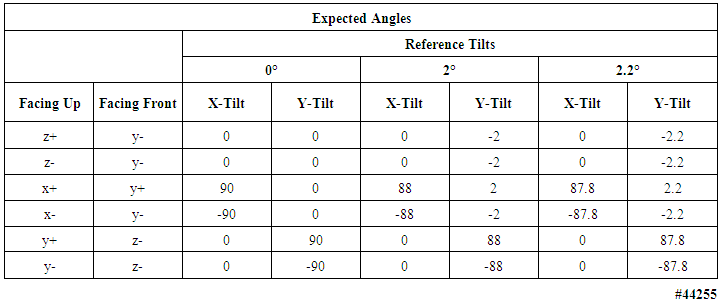 | Table 9. Expected angle offsets in six configurations of tilt tests of 2 g and 16 g motion-only body-worn units; four devices were verified |
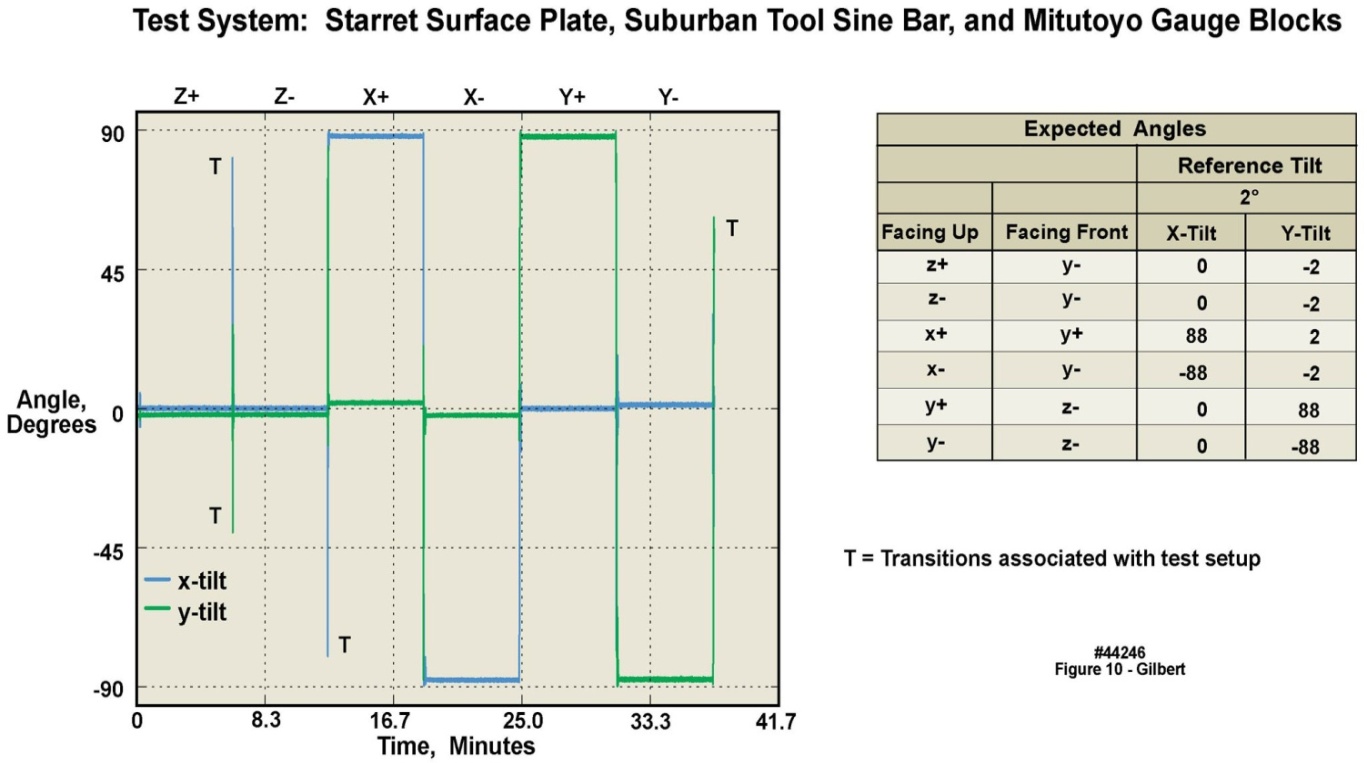 | Figure 10. Two-degree tilt angle test of 2 g accelerometer in four motion-only body-worn units over a 41 minute duration |
 | Figure 11. Example of dynamic 0.02 G calibration of 2 g accelerometer in a body-worn unit |
2.5. Physical Robustness of the Units
- Since early 2011 we have assembled approximately 200 of the body-worn units, with 117 placed in service in one way or another. One of the laboratories in our Institution has used approximately 70 of these units under the auspices of several written informed IRB-approved protocols; for each study, the study volunteers wore five units: left thigh, right thigh, left ankle, right ankle, and waist. Under these protocols, fresh batteries were installed in the units, which were then mailed to the study participants, who wore them for four days as directed, and then returned them to the study coordinators by mail. There were 154 separate data collection incidents between May 2011 and November 2013, i.e., spanning thirty months. Several of the earliest units were in repetitive use for nearly the entire duration of the studies. The numbers of reuses span from one to thirty, with an average number of reuses of eight, and a median number of reuses of five. A few were returned for repair, with the most significant problem being damage to the battery contacts, traced to an out-of-planarity installation of the battery contacts on the units’ PCBs. An assembly fixture was prepared to rectify this problem. These results underscored the ability to reuse the units multiple times over long durations, such that their assembly and test costs could be amortized over many usage cycles.
2.6. Apparel Options
- To be well tolerated by the subjects, the units had to be convenient to install and comfortable to wear. We developed a variety of Velcro-based waist and chest straps, elastic wrist bands and head bands, pockets that could be attached to clothing with Velcro, T-shirts with sewn-in pockets, clips that screwed onto the units for attachment to shoes through the laces or to clip onto belts, and so on. The units with pockets included markings indicating the correct installation of the units therein. Most of these variants worked well.
3. Alternate Implementations on the Same Basic Platform
- As described elsewhere in this manuscript, the body-worn unit is a “sensor-agnostic” platform designed to support alternate implementations as needed, serving not only as a motion data logger. Here we describe several of these additional implementations.
3.1. Motion Monitoring with High-Sample Rate ECG
- We developed a physically ruggedized version of the basic body-worn unit (Figure 12). This variant was specifically intended to support a team of professional climbers for a physiological study on a sponsored expedition to Mount Everest conducted in the Spring of 2012. Thirty eight of the units were delivered to the team with an eleven week lead time. Seven of the professional climbers who “summited” were wearing the ruggedized units. Although the ruggedized units employed the same basic suite of electronic components and the same software developed for the “civilian” units, a number of design changes were instituted to account for the harsh conditions of a protracted high mountain climb. See [18] for a complete description of these ruggedized units, including a discussion of our verification that the ECG circuitry was performing as intended.
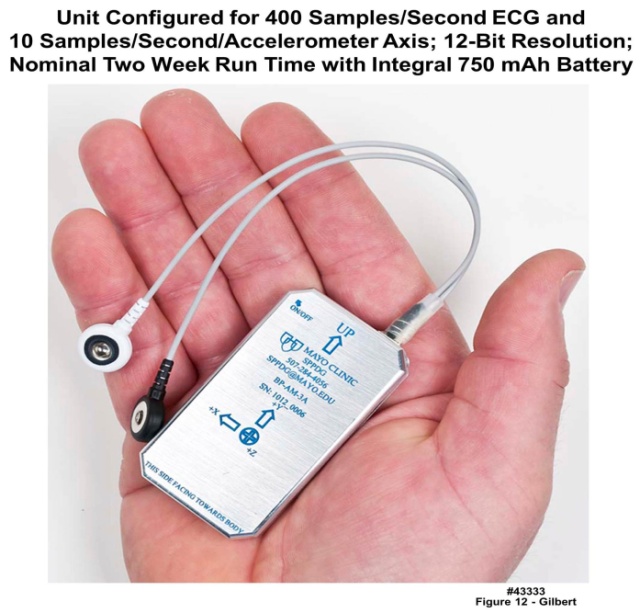 | Figure 12. Ruggedized body-worn unit containing three 3-axis accelerometers and ECG measurement circuitry; unit pictured here was a 2 ECG lead version, but a 3-lead version was also developed |
3.1.1. Example Results
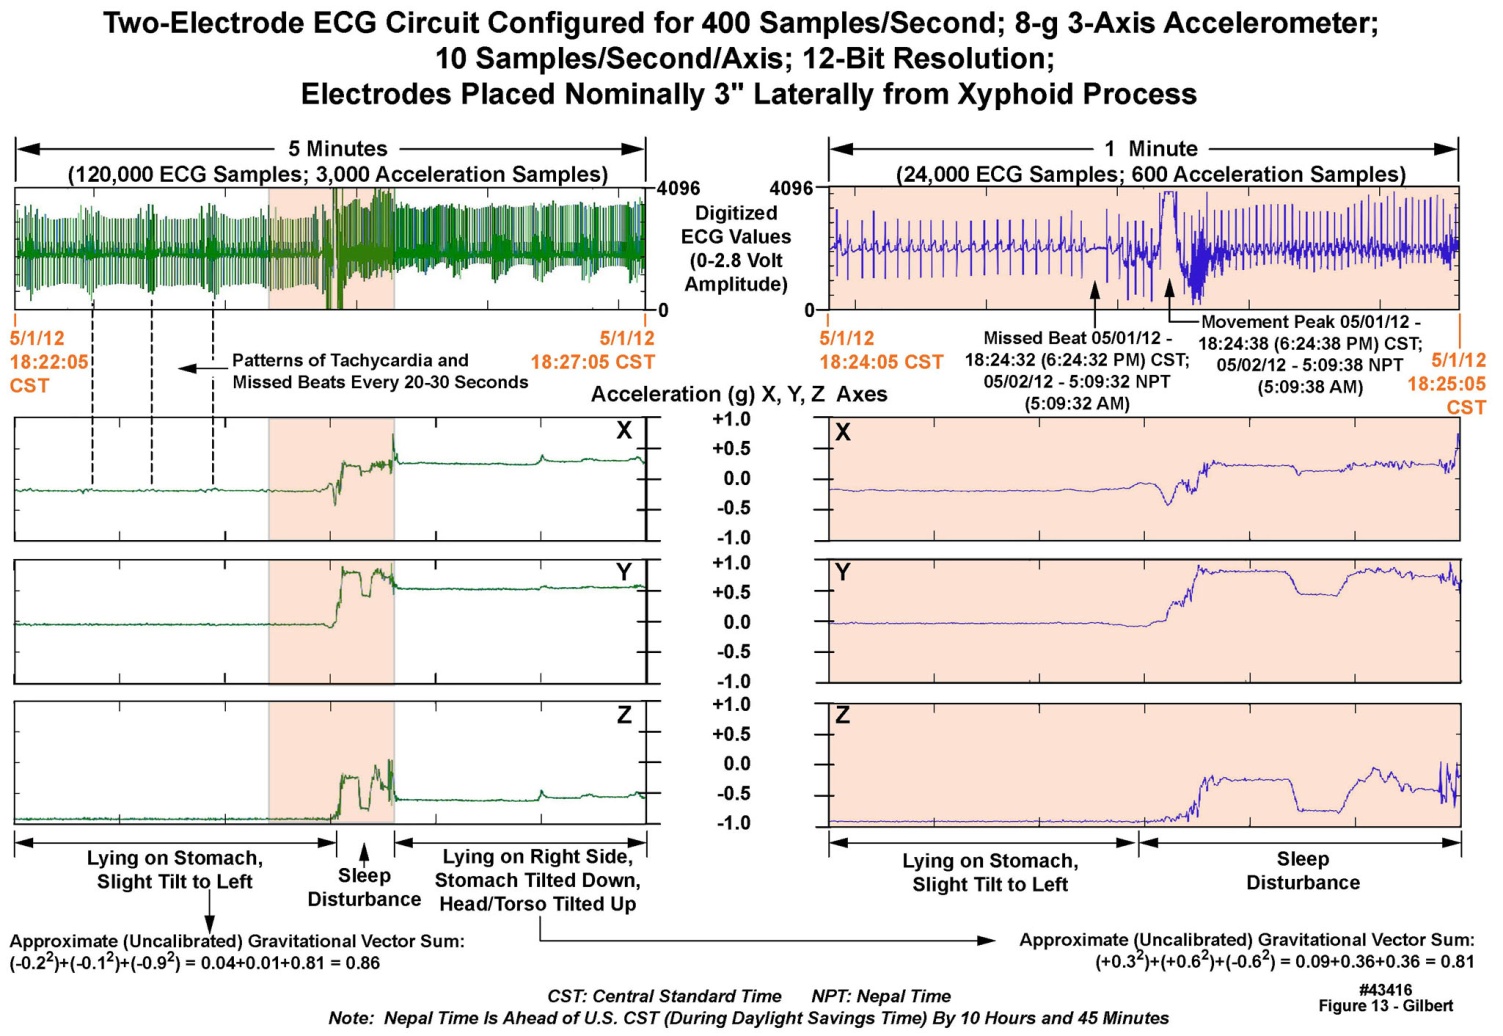
- Upon their return to us, all 38 units delivered actionable data, in combination totaling 97 GB of decompressed motion and ECG traces, which was passed to our cardiology colleagues for analysis. Figure 13 displays raw data recorded from one of the unit’s three-axis accelerometers and its ECG measurement circuitry during a sleep period at “South Base Camp”, 17,600 feet, over a five minute duration (left panels) and a one-minute expanded portion of the same set of records (right panels). Note in the upper right one- minute ECG panel, the “missed beat” in the ECG just prior to a change in sleeping position, as indicated by all three axes in the accelerometry data. The change in position was in turn coincident with the movement disturbance indicated in the ECG recording. The subject was initially lying on the two chest-mounted electrodes; the change in his position from “prone” to “right side down” disturbed the ECG recording for a few moments. Because the ECGs were recorded at 400 samples/second on all units, much higher resolution of the waveforms, than was apparent in this chart, was available for review as desired.
 | Figure 13. Five minutes of motion and ECG data recorded from a volunteer at Mount Everest South Base Camp |
3.2. ECG and Motion Recording, with Radio Frequency Transmission of Data from a Home Environment to a Medical Center or Other Monitoring Location
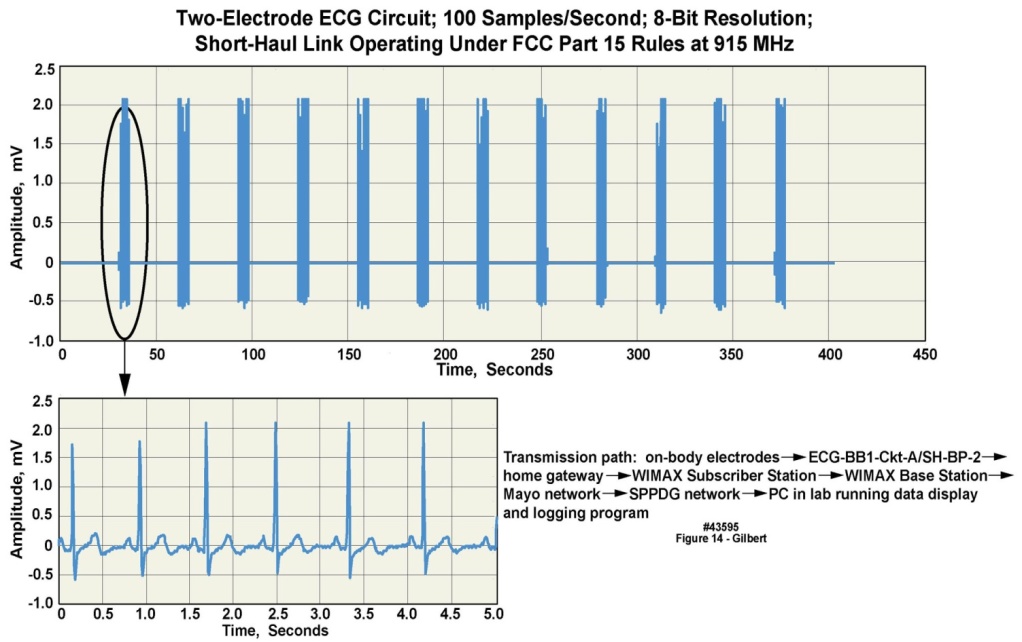
- One configuration of the basic body-worn unit platform supported motion and ECG recording, and a long-distance wireless transmission capability. The wireless implementation employed either “two-hop” or “three-hop” transmission approaches, with the first “hop” going from the body-worn unit to a “wireless gateway” of our design. From the wireless gateway several transmission implementations were developed: 1) a long-distance terrestrial bidirectional transceiver approach whose signals were able to reach an antenna on a medical center building as much as ten miles distant; 2) a two-hop approach that used terrestrial landlines; or alternately 3) a “three-hop” transmission, from the body-worn unit to the gateway, from the gateway to a satellite in geosynchronous orbit, and from the satellite to a ground station located on the medical center campus. The terrestrial wireless approach was demonstrated employing both WiMax and LTE protocols, transmitted on a radio frequency (RF) carrier in the 3.65-3.70 GHz band. We were granted access to this RF band under a ten-year nationwide nonexclusive license to our institution in July 2008 by the Federal Communications Commission (FCC), referred to by FCC as “3650-3700 MHz Radio Service”. During 2009 the end-to-end terrestrial wireless communications system was tested using radio frequency reference signals in three cities across the U.S., representing dense urban, light urban, and suburban environments respectively, and was found to operate reliably. The terrestrial landline approach was demonstrated using both DSL and cable modems. The three-hop satellite approach was demonstrated using a commercial channel of an Inmarsat satellite, illustrating that conceptually, an individual can be monitored in many worldwide locations.In 2012 we retested the terrestrial wireless, satellite, and landline systems described above, transporting clinically relevant ECG and motion data collected from a volunteer in his home environment. Figure 14 illustrates the ECG output employing the end-to-end WIMAX terrestrial wireless implementation. For all of these sets of demonstrations the body-worn unit was programmed to transmit 100 sample/second, 8-bit ECG data for five of every thirty seconds. The signal displayed in this figure was unfiltered, illustrating that attention to electrical design issues resulted in data that did not require post-receipt filtering. Higher sample rates and 12-bit samples could be accommodated by modifying the recording and transmission parameters in the unit’s firmware suite.
 | Figure 14. Multiple ECG data snapshots transmitted wirelessly from a volunteer in his private residence to a medical center |
3.3. ECG and Respiration Monitoring
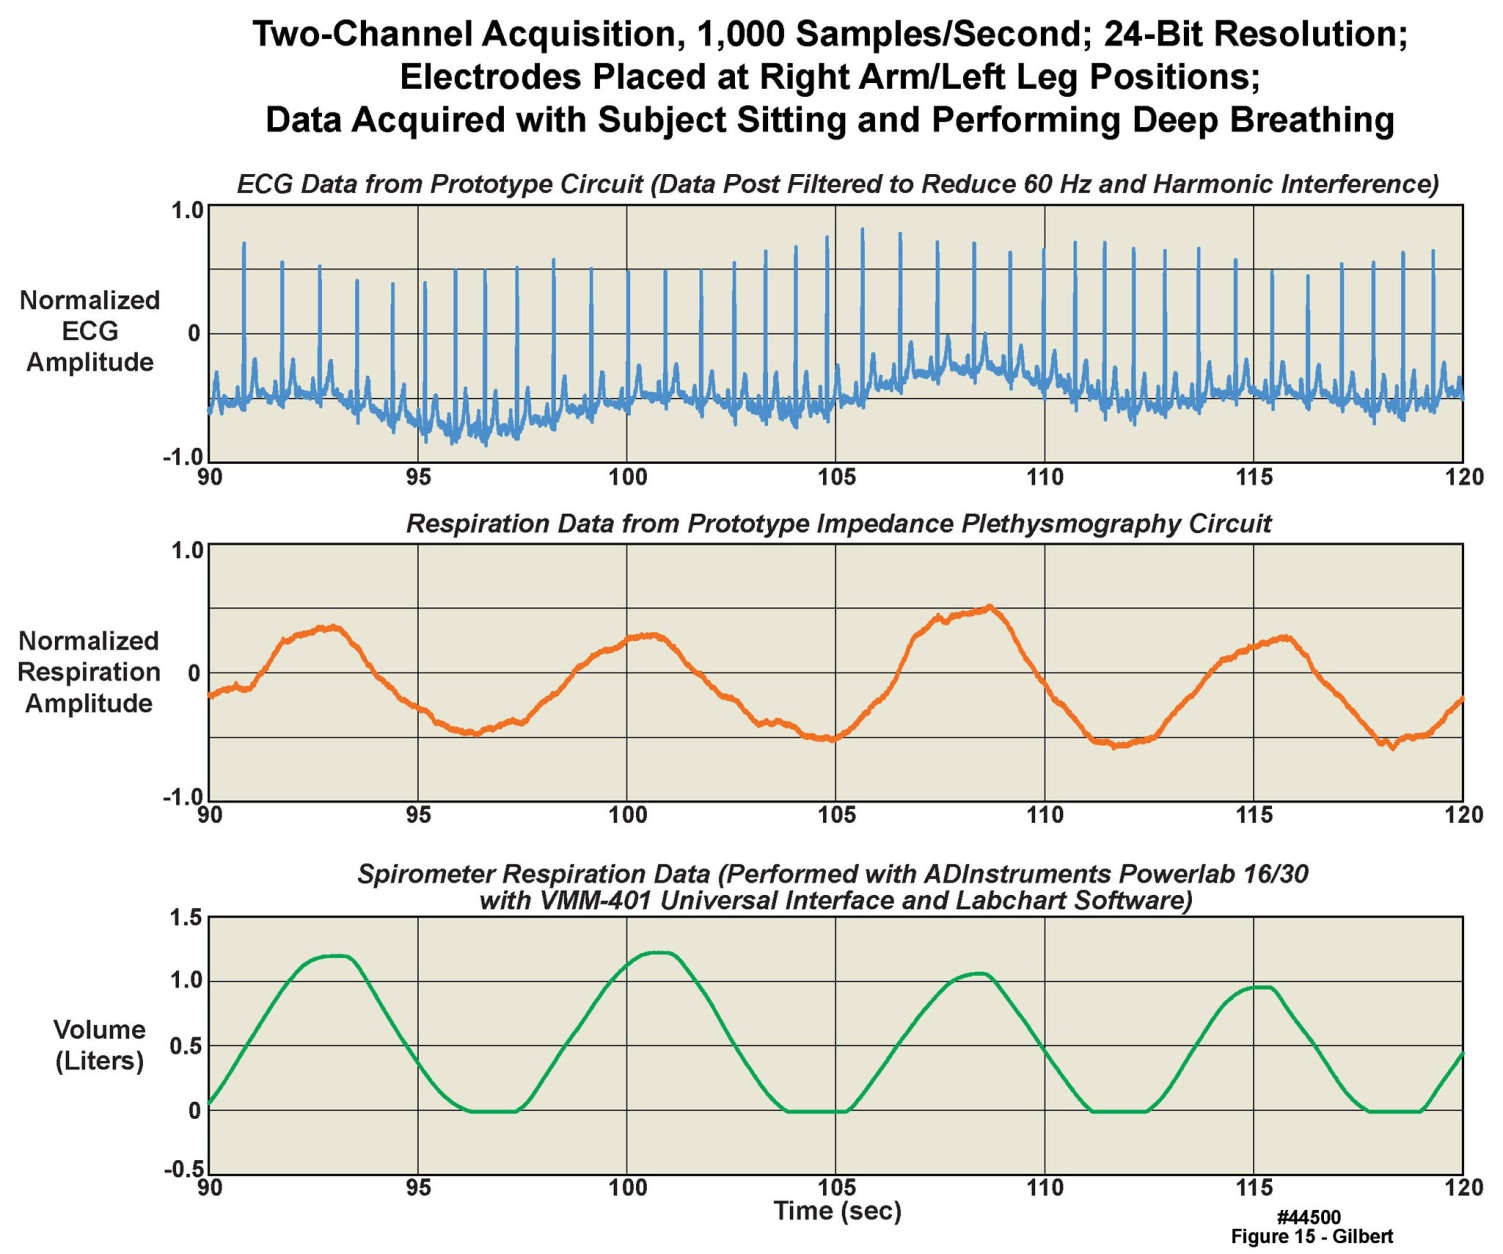
- We have demonstrated the combination of ECG and impedance plethysmography-based respiration recording, using a modified version of the same basic platform discussed throughout this manuscript. We tested a prototype unit, containing several experimental features, on five healthy volunteers. The three panels displayed in Figure 15 represent thirty seconds of data from a volunteer taking four tidal volume breaths, with simultaneously recorded respiration and ECG. The uppermost panel is single lead-pair ECG measured with the prototype system’s ECG circuitry. The middle panel displays the volunteer’s respiration measured with the impedance plethysmography circuitry in the prototype system. The data in each of these two panels was sampled at 1000 samples/second, 24 bits/sample. The lower panel is reference respiratory data from the same breaths, as measured by a commercial spirometer (ADInstruments Powerlab 16/30 with VMM-401 Universal Interface and Labchart Software). The vertical axis on the data from the commercial spirometer is calibrated in absolute volume, with the tidal end-expiratory volume assumed to be zero liters; the tidal volume from this data is thus roughly 1.2 liters. The data from the ECG circuitry and the impedance-based approach are in normalized units. The airflow-based respiration measured with the commercial spirometer was collected as a reference, in a first step toward calibration of the impedance plethysmography system. Note that, as expected, the ECG baseline moves up and down in concert with the respiratory cycles. Next steps would involve studies of the amount of measurement drift over time and other possible artifacts in the plethysmography approach compared to direct airflow-based spirometry. The impedance capability continues in development to achieve circuitry with much lower power consumption.
 | Figure 15. Measurement of ECG and respiration with a prototype combined ECG and impedance plethysmography measurement system, with data from a clinical airflow meter as a reference |
4. Measurement Results from Feasibility Case Studies
- Discussions over several years with physicians and research colleagues indicated that different desired measurement approaches would best be served by the use of from one to several units on the same individual. For fall detection and general center-of-mass activity and gait analysis measurements, a single unit at the waist or on the chest was considered to be sufficient. For other measurements, such as tremor in one limb but not the other, two units were thought best. Epilepsy specialists with whom we have collaborated have used as many as six units on their patient volunteers. Thus, to illustrate this range of implementations, in the following sections we provide two usage examples with one and five accelerometer-only body-worn units placed on the same individual.
4.1. An Initial Feasibility Case Study of Non-Clinical Multi-Day Use of Five Body-Worn Units
- Figure 16 illustrates unprocessed accelerometer data from five of the body-worn units placed on a volunteer during an eight-day ski trip in the Canadian Rocky Mountains, who maintained a time log of his activities. Based upon the stability of the onboard clocks, the fifteen panels of this figure represented, from leftmost to rightmost columns, a complete time-aligned seven-day set of recordings but with no recordings on the first day; a complete time-aligned sixty-minute set of recordings extracted from the seven-day recordings; and a complete time-aligned one-minute set of recordings extracted from the sixty-minute recordings. From left to right, the curved dashed lines and arrows at the bottoms of the columns illustrate the extracted sections. All three accelerometer axes recorded from each unit, labeled with different colors, are presented in the figure. The maximum accelerometer range in all axes was 16 g; however, the vertical axes in the chart were scaled differently depending on the maximum g levels recorded by the accelerometers. The individual panels represent, from top to bottom, two units worn on the right and left wrists, one unit worn at the waist, and two units worn on the right and left ankles. The sampling rates were set to100 samples/s on each accelerometer axis of all five units. The letters in the panels of Figure 16 represent events identifiable by a comparison between the activity time log and the data: A: non-skiing periods during each day and at night; B: active skiing periods during the days; RD (rest day): an entire day (day four) during which no skiing took place; S (skiing): a several-minute duration of active downhill skiing; L (lift): a several-minute duration spent riding a chair lift; and PP (pole plant): wrist recordings of alternate left-arm, right-arm ski pole plants. Note that the recordings from the wrists were quiet except for the pole plants; the waist unit was the most “quiet” because the mid-trunk remains relatively stable in a good recreational skier; and the ankle units displayed considerable high frequency behavior, indicative of the “chatter” of the skis over rough or icy terrain. Only one out of every 613 samples and one out of every four samples for the seven-day and one hour columns, respectively, are displayed in these charts. However, the individual panels could be expanded considerably in both amplitude and time to reveal significant additional “structure” in the recordings at almost any desired level of detail. For example, the vibrations from a lift chair crossing the pulleys of each lift tower could be clearly observed in an expanded-view chart not presented here. All data is displayed for the one-minute column.
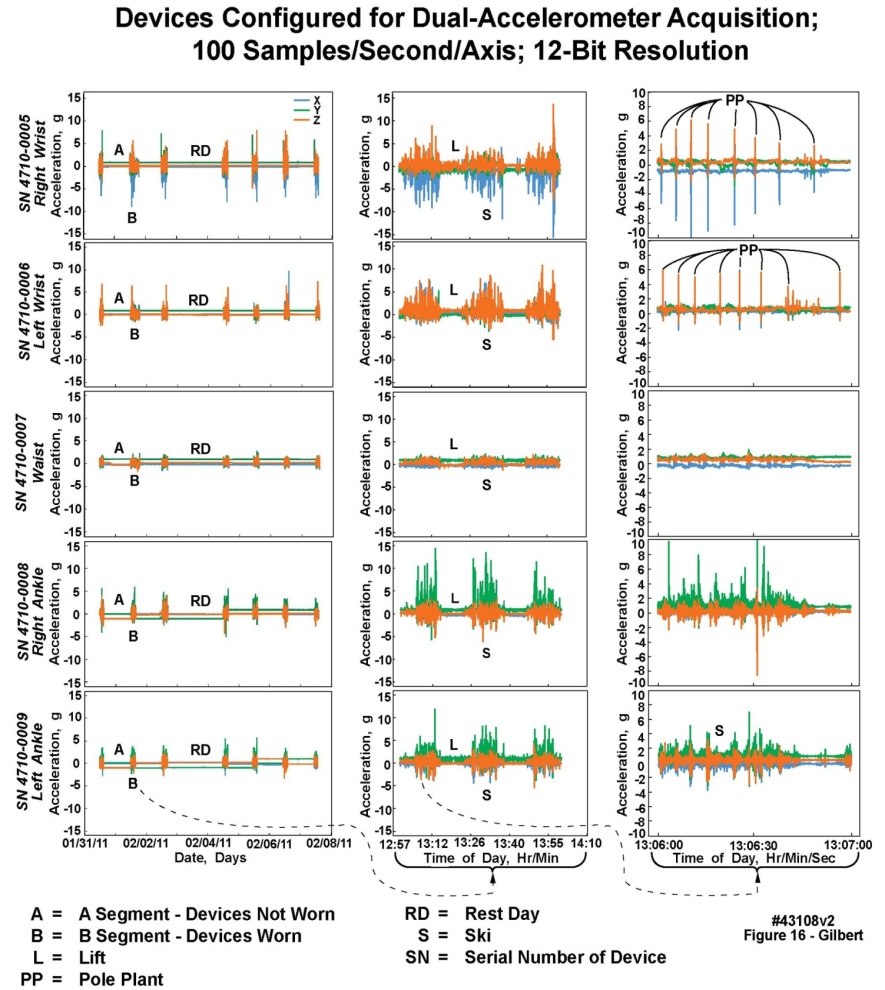 | Figure 16. Fifteen panels of data recorded continuously from five body-worn units worn at both wrists, both ankles, and the waist during an eight-day Rocky mountain ski trip, with recordings from both 2 g and 16 g accelerometers; successive rightmost panels depict increasingly fine temporal resolution extracted and displayed from the leftmost panels |
4.2. Initial Feasibility Case Study Using a Single Body-Worn Unit
- The body-worn units have been deployed into the Department of Orthopedics for gait and posture-related measurements [19-23]; in the Department of Neurology to measure and record tremor as an additional noninvasive part of routine instrumentation associated with movement disorder laboratory assessment; and in the Division of Cardiovascular Diseases to measure physical activity in a variety of conditions.
4.2.1. Initial Feasibility Study Using a Single Body-Worn Unit to Document and Assess Upper-Limb Tremor
- Figure 17 presents an example of recordings obtained during an evaluation of a patient volunteer who had Parkinson’s disease and associated neurologically confirmed tremor. The subject wore a single unit, placed first on the right wrist, and then on the left wrist. The Parkinson’s tremor was pronounced in the left wrist, but not in the right wrist. The segments of the chart marked with an “A” are motion artifacts during placement and removal of the units by the technician. In the two right-wrist “control” recordings, note the relative paucity of acceleration data. In the three left-wrist recordings, the test subject exhibited different levels of tremor depending on events, largely fatigue, that increased the volunteer’s tremor. The body-worn unit on the left wrist recorded an increasing range of acceleration values, in all three axes, as the tremor increased; but note that these panels present “raw” data. As predicted by the neurologist who collaborated on this project, movement in the +z/-z axis (dorsal/palmar) directions, i.e., outstretched wrist moving up and down, was the greatest due to the limb counteracting gravity. Movement in the +x/-x ulnar/radial axis, i.e., outstretched wrist movement left to right, was less. Finally, movement in the +y/-y cranial/caudal axis, i.e., outstretched wrist movement toward and away from the body, was minimal.
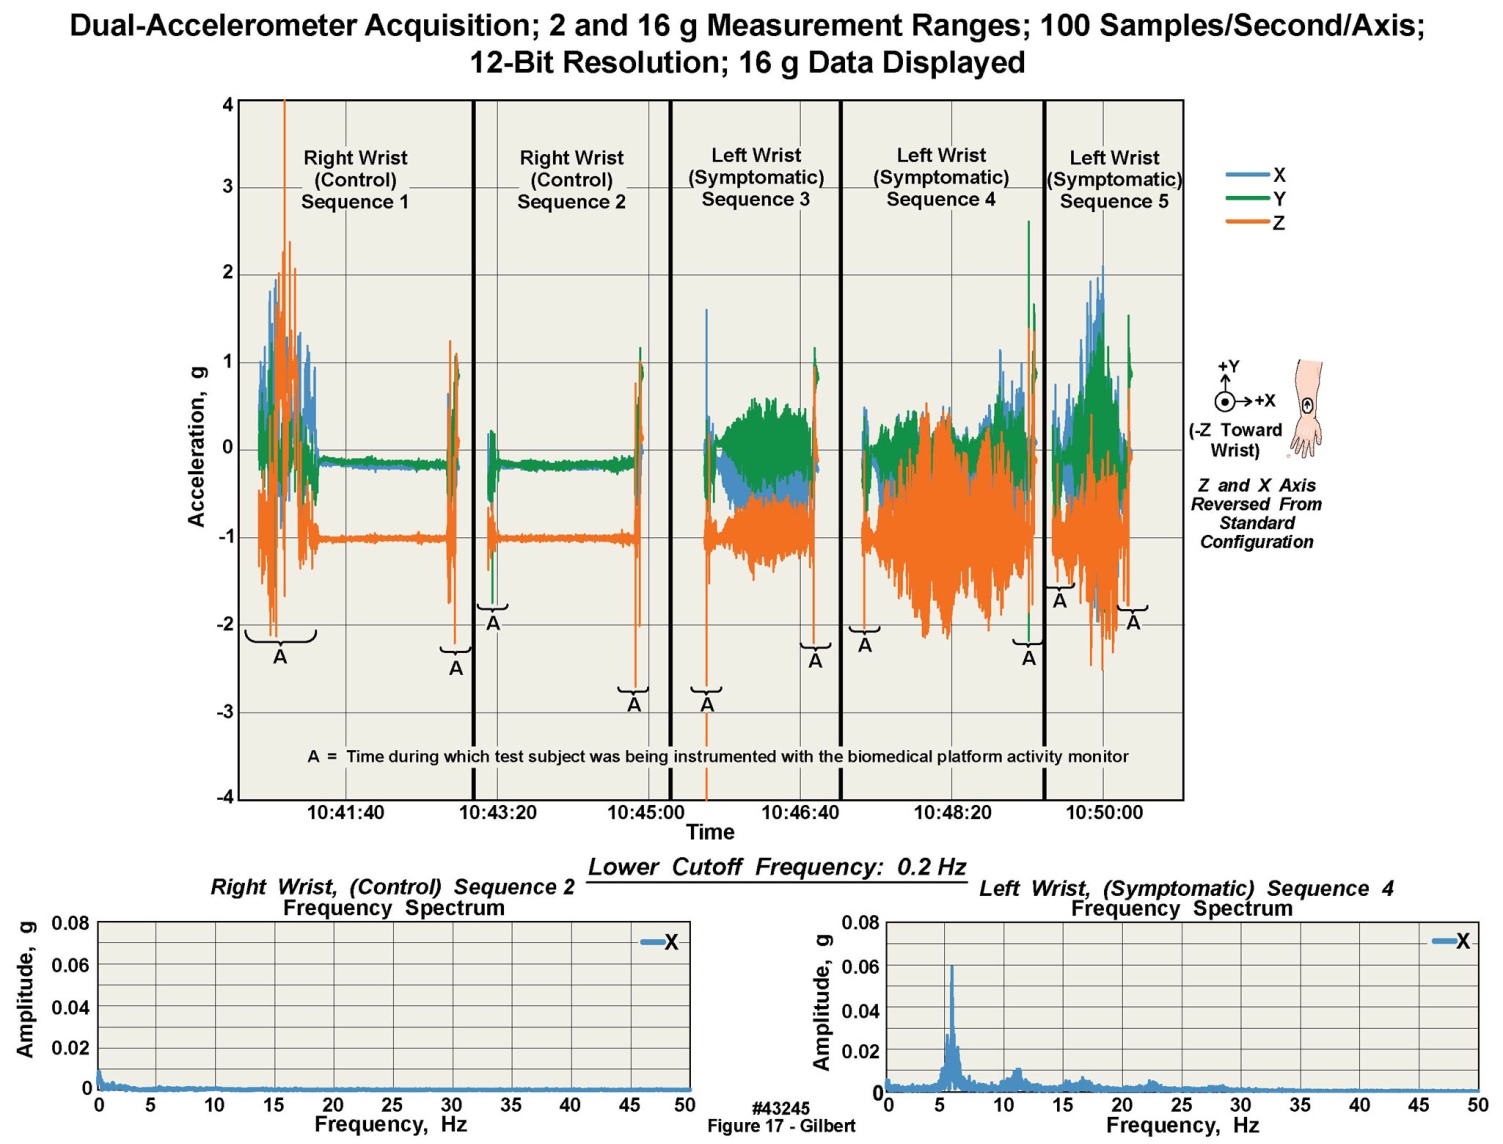 | Figure 17. Data acquired with a body-worn unit positioned alternately on each wrist of volunteer with Parkinson's tremor, with fast Fourier transforms of the data from each wrist also displayed |
5. Comparison to Similar Body-Worn Monitoring Units from the Published Literature
- In Section 1.1.4 and in Tables 1-4 we compared the design characteristics of a variety of body-worn motion-only data loggers according to the technical specifications available from the developers or other sources, with the same specifications from our own units. However, there is another approach to making such comparisons, i.e., by 1) reviewing the technical descriptions of units described in manuscripts published by the various developers; and 2) by comparing actual raw data produced and published by these same contributors with data collected by our units. Section 5.1 addresses 1), while Section 5.2 addresses 2). The published literature on body-worn monitoring units is extensive; those listed in the References section of this manuscript are but a selected subset. We derive several conclusions from reviewing those papers, as described below.
5.1. Engineering Implementations of Other Units
- Most manuscripts that we reviewed present only cursory descriptions of the hardware and software implementations of body-worn units under test. There are, however, several notable exceptions. One of the most complete descriptions of similar technology may be found in [2]. That development work was conducted nearly two decades ago when the available hardware incorporated into the described units were considerably less advanced than presently. Of the more modern devices, technical descriptions of the Shimmer units [6, 11, 13] are the most thorough. Most manuscripts do not describe the sampling rate and number of bits of precision in the digitized data, making their results difficult to compare to ours. However, [13] states sampling rates of 500 samples/second and 12 bits precision per sample, comparable to those of our own units (because the same microcontroller with an ADC incorporated onto the same chip is used in both the Shimmer units and in ours). We have programmed various sampling rates from 400 samples/ second to a maximum of 1000 samples/second, using the sampling capabilities of the ADC built into the microcontroller. The performance criterion of importance here is whether the number of bits per sample (e.g., 12 bits) and the sampling rate are sufficient to reproduce the QRS complex in the ECG recording. Our results and those of [13] are comparable in this regard, illustrating that both our unit and theirs exhibit sufficient performance. The bit resolution described in [2] might not be considered adequate at present (sampling rate is not explicitly stated), but was a significant accomplishment considering the era in which the work was conducted.If sampling rates and bit resolution are comparable between our units and those units in the literature [13], then the best remaining comparison criterion should be residual electrical noise levels in the collected data. Electrical noise levels are not described directly in the manuscripts that we reviewed; the reader must examine the baselines of the ECG signals not corrupted with physiologic noise to estimate residuals. Electrical noise levels in unfiltered data in [12] are quite high, likely due to the use of capacitive rather than contact electrodes for ECG measurements. In this manuscript, a review of Figure 14 shows a very small amount of residual noise on the baseline of the ECG waveform, and a slightly greater amount of noise on the ECG baseline in Figure 15; in Figure 13 (and in Figure 8 of [18], from the same unit as in this Figure 13), residual noise is the least of the three. These differences are because Figures 14 and 15 are from units whose designs were less optimized than that in Figure 13. Further, we asked an experienced physician to review these different ECG waveforms; all three waveforms were described as being of “diagnostic quality”.Manuscript [13] also presents two tables of current draw for their units under different conditions, which are roughly comparable to Figure 5 and Table 6 in this manuscript. Descriptions of calibration techniques are uneven; the most technically sophisticated can be found in [4], in which a mechanical system was designed to apply known or computable g forces to individual units in a single plane. We believe that the computer controlled, calibrated “shake table” that we employed is a superior approach, especially since it was able to elucidate the accelerometers’ ability to measure g forces as small as .02 g. However, the unit described in [4] is a reasonable alternative. The description in [9], spinning a unit in a circle with known radius and angular spin rate seems less adequate than either our method or that in [4].
5.2. Comparisons of the Type and Quality of Data Collected by Other Units
- We reviewed a cross section of the published literature, and some of the patent literature, to ascertain whether we could compare the “raw” data collected by our body-worn units with that collected by other roughly similar units. We discovered that the majority of the papers provided derived data rather than raw data at all [1, 3, 4, 10]; and a few of the manuscripts were expository and thus did not contain tables of derived data either [5, 9, 10]. The majority of manuscripts that described results from step counters or accelerometer-based units concentrated on derived data because the raw data delivered by such units requires considerable statistical post-processing to deliver actionable results. One notable exception is [2]; the authors presented very clear plots of raw accelerometry data to illustrate measurements on Parkinson’s patients (their Figures 1 and 2). Figure 17 in this manuscript also illustrates data from a Parkinson’s patient. However, whereas [2] concentrated on individual tremor cycles, we were more concerned with the “envelope” of the tremor and its frequency domain (Fourier) content, obviating the ability for direct comparisons between our work and that of [2]. Raw data from a gyroscope-based system appears in [11]; and in [6], where both gyro and accelerometer data are clearly presented together in several figures, but in scale-compressed or aggregated form which presents comparison difficulties. Finally, [20, 21] present clear plots of raw accelerometry data, but these measurements were taken using our own units (Figure 1).Review of a number of published patents illustrated that the majority dealt with the fall detection problem; therefore the included figures were primarily block diagrams. The one exception was [24], with Figure 7A-C presenting “fall signature” data; the format of the figure also did not allow for direct comparison with our movement results. Thus we conclude that it is difficult to compare raw accelerometry data from the published literature with our own results, or to compare this type of data amongst the published offerings of others. A more easily recognizable data signature must be employed if such inter-device comparisons are to be made.The ECG waveform is perhaps the best example of such a recognizable signature that may be employed for inter-device comparisons, with respiration signatures as a possible, but less reliable, alternative. Accordingly, we reviewed those manuscripts, including our own, that describe ECG measurements. This type of data is in two categories, direct ECG measurements, such as presented in [12], which may be compared, and data derived data from the ECG, such as analyses of R-R intervals over one or more test subjects, e.g. [13], which is difficult to compare. The raw ECG plots from Figures 5 and 6 in [12] illustrate that the QRS complexes can be well defined, indicating that the analog bandwidth and/or sampling rates of the electronics were sufficient to capture the QRS waveforms. Electrical noise on the “flat” segments of the ECG traces vary, as is evident in their figures, based not only on the electrical design (see above), but also on the types of electrodes employed. In comparison, Figure 14 in this manuscript shows clean ECG baselines and excellent definition of the QRS complex; and in the upper rightmost panel of Figure 13 (from a newer design), at the “missed beat” arrow, shows essentially no baseline electrical noise (confirmed by Figure 8 in [18] from the same unit as in Figure 13).
6. Discussion
- The many commercial variants of body-worn units that have appeared on the consumer market since the early 2000s are primarily oriented to a personal self-help model, and thus serve to support the health and wellbeing of the interested portion of the population. A large number of these units have been purchased and their strengths and deficiencies have been discussed or evaluated by several workers, e.g., [1, 10]. Conversely, we set out to design, produce, test, and field body-worn units intended for prescription by health care professionals to their patients to collect data of sufficient measurement quality to allow its conversion into clinically actionable information, from individuals immersed in their daily living environments. We have incorporated such features as: 1) ECG waveform monitoring; 2) rigorous static and dynamic calibration of the accelerometers in every unit to NIST-traceable standards; 3) accelerometer slope and offset correction to compensate for minor manufacturing differences; 4) autonomous multi-day operation without battery change or charging or any other intervention by the wearer, and 5) a stable time-of-day clock allowing the synchronization of data from multiple units worn by a single subject. This combination of features has already proven to be of value in initial tests on volunteers. Body-worn units designed, fabricated, and tested in this manner have resulted in a reliable physiological measurement capability, in a very small form factor, representing a set of potentially useful clinical tools for eventual monitoring of patients in their free-living environments.In addition, the programmable sample rates of 10 to 1000 samples/s on each analog input to the microcontroller, and programmable amplitude resolutions of 8 or 12 bits, give the healthcare professional the ability to observe long-duration behavior while retaining the ability to “drill down” to time slices as short as 2.5 ms. This capability is apparent in the uppermost two panels of the right hand column of Figure 16, where individual, alternating sub-second duration “pole plants” by the skier can be clearly observed, that have been extracted from a total eight-day record length.
7. Summary
- The work described herein arose from the hypothesis that rigorous engineering approaches could be applied to the development of new hardware- and software-based tools for the measurement of physiological variables in volunteers and eventually in the patient population of a medical center’s clinical practice. To demonstrate the validity of the hypothesis, we have designed, assembled, calibrated, and tested in both non-clinical and clinical settings a family of measurement-quality, body-worn monitoring “platforms”. Care has been taken in all hardware and software elements of this system to assure data integrity, and operation under most foreseeable use cases. These units were intended for use by health care professionals for biomedical and clinical research and for eventual use in the diagnosis and treatment of their patients. Because of that requirement, we intend to seek FDA medical device certification for these body-worn units when their technologies become sufficiently mature. The computer-based support requirements for such systems are within reach of most medical centers: desktop computers with present CPU “chips”, and 96 GB of local memory and several terabytes of disk storage are adequate to support the data volumes generated by these body-worn units. At present prices, the extended disk and memory requirements can be satisfied for less than $1500. The intent is that the units can be integrated into end-to-end clinical data recording, processing, and storage environments that are likely to be found in most U.S. medical centers now or in the future.
ACKNOWLEDGEMENTS
- The authors thank S. Bancroft, J. Bublitz, K. Buchs, C. Burfield, B. Buhrow, G. Delp, D. Holmes, T. Funk, W. Hurd, A. Issa, D. Jensen, B. Johnson, C. Johnson, M. Joyner, K. Kaufman, M. Kosel, B. McCoy, D. Moertel, R. Morris, M. Morrow, M. Nelson, S. Neumann, S. Polzer, S. Schreiber, D. Schraufnagel, S. Schuster, and J. Trautman for their contributions. This work was funded by grants from the Mayo Clinic.