-
Paper Information
- Previous Paper
- Paper Submission
-
Journal Information
- About This Journal
- Editorial Board
- Current Issue
- Archive
- Author Guidelines
- Contact Us
American Journal of Biomedical Engineering
p-ISSN: 2163-1050 e-ISSN: 2163-1077
2015; 5(1): 24-30
doi:10.5923/j.ajbe.20150501.04
Frequency Dependency of Postural Control Reaction Time during Subtle Anterior Translation of Standing Blindfolded Subjects
Shahrokh N. Sani 1, Charles J. Robinson 2
1Department of Physiology, College of Medicine, University of Arizona, Tucson, Arizona, USA
2Department of Electrical & Computer Engineering, and Center for Rehab Engineering, Science & Technology, Clarkson University, Potsdam, NY, USA
Correspondence to: Shahrokh N. Sani , Department of Physiology, College of Medicine, University of Arizona, Tucson, Arizona, USA.
| Email: |  |
Copyright © 2015 Scientific & Academic Publishing. All Rights Reserved.
The purpose of this study was to investigate the effect of external stimuli frequency on postural control reaction time. A Sliding Linear Investigative Platform for Assessing Lower Limb Stability (SLIP-FALLS) was employed to measure the reaction time in a short postural perturbation in the subject’s natural sway range while the subject stands on the platform. Postural control reaction time to external perturbations were measured by the time delay between the point by point average of the platform acceleration and head AP acceleration in 30 trials of the 1, 4 and 16mm 2AFC (2-Alternative-Forced-Choice) experiments. Anterior-Posterior head acceleration (Head Accl AP) were investigated among the movement and non-movement intervals for the healthy adults. A strong ringing signal was observed in Head Accl AP movement interval. Results showed that there is a strong correlation between the frequency of the external stimulus and the reaction time.
Keywords: Reaction time, Head acceleration, Postural control, Frequency dependency
Cite this paper: Shahrokh N. Sani , Charles J. Robinson , Frequency Dependency of Postural Control Reaction Time during Subtle Anterior Translation of Standing Blindfolded Subjects, American Journal of Biomedical Engineering, Vol. 5 No. 1, 2015, pp. 24-30. doi: 10.5923/j.ajbe.20150501.04.
Article Outline
1. Introduction
- According to the Center for Disease Control and Prevention, falls are the leading cause of deaths in over 65 age population [1-3]. In 2012, more than 3.12 million fall injuries were reported for aging adult in emergency departments and hospitals [4]. Reported injuries costs were more than 30 billion dollars [5].With progress in treatment of some fatal disease (cardiovascular disease, cancer and stroke), life expectancy has been increasing in last decades. Subsequently, more serious attention is needed for this crucial health problem. There are many investigation that identify fall risk factors in aging population [6-11]. In general, these risk factors are categorized into intrinsic and extrinsic factors. Extrinsic factors are related into environmental factors such as improper footwear and intrinsic factors are involved with age related physiological and psychological changes [12]. Dynamic balance is a complicated task that needs close contribution between vestibular, vision, and somatosensory system. It is more attention demanding task in comparison with other body poses (sitting). Attention demands increase with complexity of the postural task [13]. Reaction time is contributed to the prediction of falls [14] and is used to study the notion of attentional demands of postural control. It is defined as the time delay between the presentation of unexpected external perturbation and the response to that perturbation [15]. Lojoie et al. showed that elderly subjects have significantly slower reaction time in a narrow base standing position in comparison with young subjects [16]. It has been documented that reaction time is the age related parameter and is one of the significant markers of central nervous system functional failure in aging people [17-18]. According to the “information loss model” both young and old people response to external stimuli by using the same sequential order of steps. Each step takes special amount of time depend on available information about subject’s posture [19]. In other words, if less information is available that means more time will be needed to process through each step and overall process time will be longer. Haywood et al. hypothesized that the aged wastes our ability to process and analyze postural information [20]. Reaction time has been studied throughout the paper. A negative power law relationship was observed between reaction time and the frequency of perturbations that could be affect reaction time commutation. This paper describes that the quickness of reaction times can differ depending upon the frequency of external stimulus and this frequency dependency should be considered as an important parameter in reaction time measurements.
2. Methode
2.1. Participants and Test Protocols
- The study participants were 9 healthy adult subjects and without lower limb peripheral neuropathy. They were asked to stand on the transitional platform and were blindfolded during all trials. In each trial, a subject heard four verbal instructions from the headphone: “ready”, “one”, “two” and “decide”. Each stimulus interval was 4s long. When the subject heard the word “decide”, (s)he had to press the wireless doorbell button once or twice based on perceiving a movement in interval one or two. The length of the platform movement was 16 mm, 4mm, and 1mm. A set of 30 trials maximum was collected for each subject. The platform position and acceleration, the subject’s anterior posterior and medial-lateral centers of pressure (APCOP and MLCOP), lower limb EMG signals and head acceleration in the X, Y and Z directions were collected at 1000Hz and also processed into engineering units and stored at 100Hz.A 2-Alternative Force Choice (2AFCi) psychophysical procedure was used to determine the acceleration threshold at displacements of 1, 4 and 16mm. The experiment was continued until the subject’s detection acceleration threshold or 30 trials was reached. Finding the subject’s psychophysical threshold for the perception of a given displacement was the main goal during the 30 trials [21].The stimulus was given in interval 1 or 2 and the subject was compelled to choose by button press the interval in which (s) he perceived a movement. The platform acceleration value either increased (for non-detect) or decreased (for a pair or triad of detects) in the next trial based on a modified Parameter Estimation by Sequential Testing (PEST) paradigm [22].
2.2. Biomechanical Response to 1, 4 and 16mm Perturbation
- A Matlab based GUI (Graphical User Interface) created to analyze the subjects’ head acceleration data in adjustable movement and non-movement time interval length during 30 trials of 2AFC experiments (see Figure 1). The designed software was able to adjust the movement and non-movement time interval length. In each trial, 15 to 19s of head AP acceleration data were recorded by our sensor. Initially we designed the GUI to analyze the subjects’ head acceleration data, and it was then extended to analyze all sensory data. As you can see in Figure 1, the Directory Selection panel let us select different subjects’ files and load their data. Each Subject’s file had 148 excel files that included all 16mm, 4mm, and 1mm Quiet Standing and 2 AFC trials data. For 1 mm and 4 mm displacement, the interval 1 movements usually start after 4s and interval 2 movements after 8s. For a 16mm displacement, interval 2 movements usually start at 10s. Figure 2 shows platform position and acceleration (AP) in movement interval during thirty 1, 4 and 16 mm 2AFC experimental displacements. The patch line plot has been used to show the moves over all 30 trials.
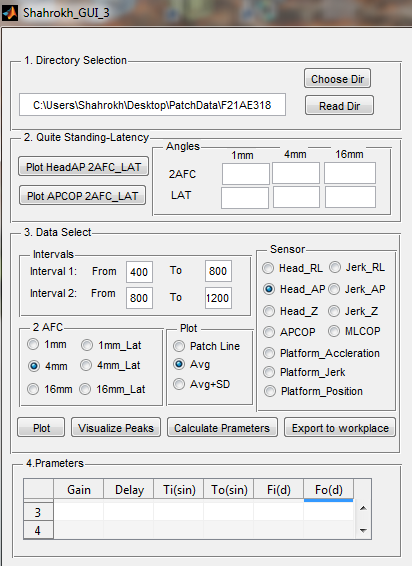 | Figure 1. Matlab Based GUI to Analyze Biomedical and Biomechanical Data |
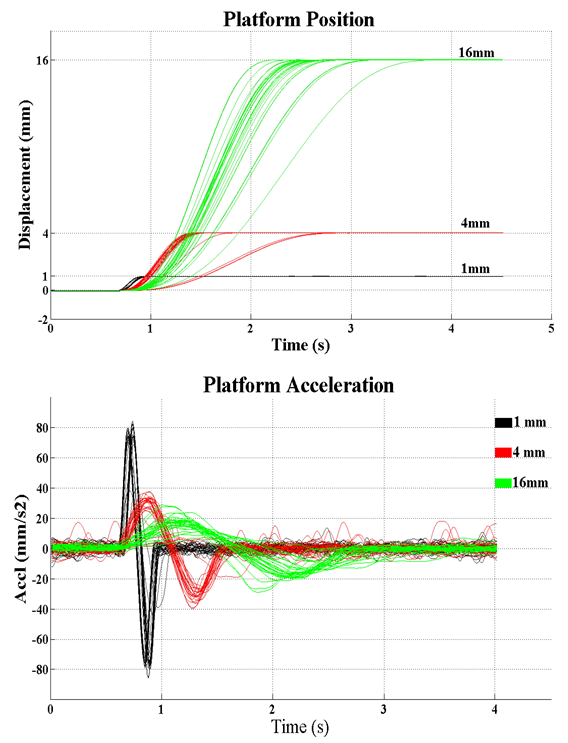 | Figure 2. Movement interval platform position and acceleration patch lines during thirty 2AFC trials of 1, 4, and 16mm translations |
3. Results
3.1. Anterior-Posterior Head Acceleration in Movement Interval
- We consider Subject’s head AP acceleration as only biomechanical response to the perturbations. Head AP acceleration in movement intervals during 30 trials of the 1, 4 and 16mm 2AFC experiments has been shown in Figure 3.
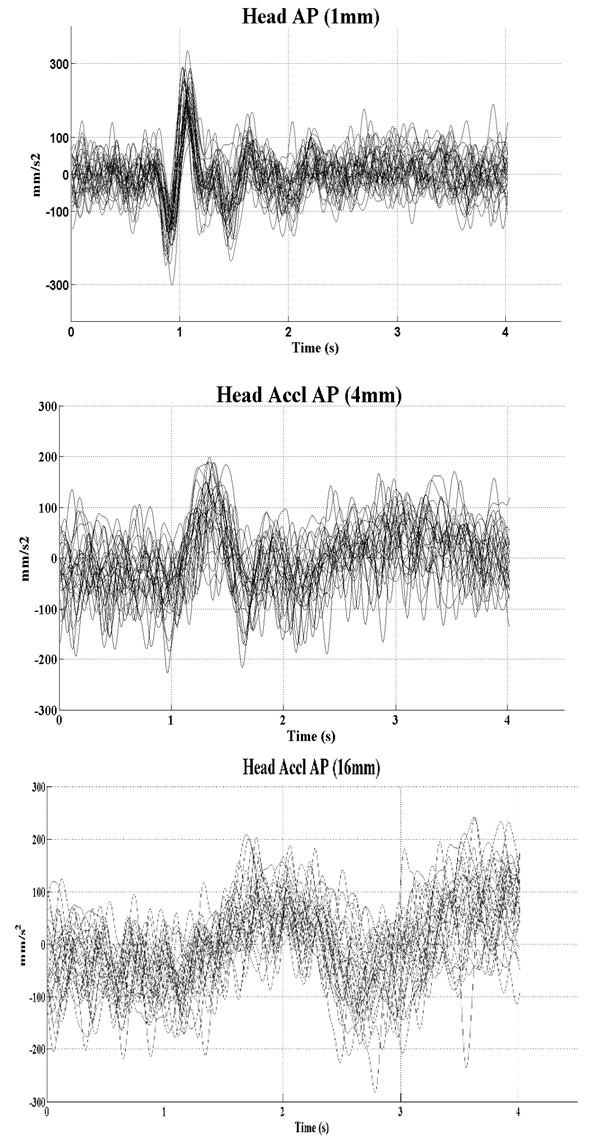 | Figure 3. Head AP acceleration patch lines in movement interval during thirty 2AFC trials of 1, 4, and 16mm translations |
3.2. Observation of Reaction Time
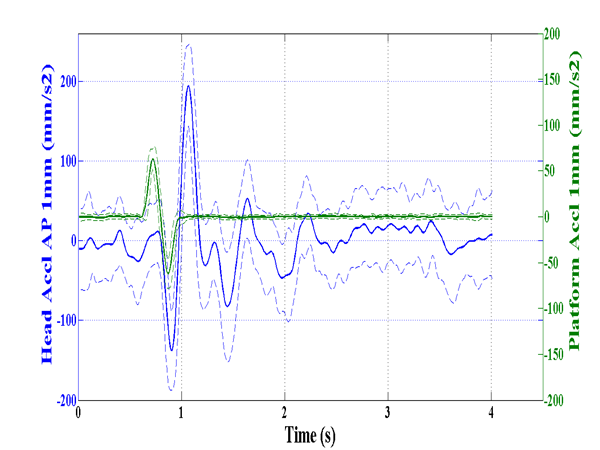
- We considered the point-by-point ensemble average of platform acceleration in 30 trials to be the input to our human postural system, and the ensemble averaged head AP acceleration as one output. Figure 4 shows the point by point average of the platform acceleration and head AP acceleration in 30 trials of the 1, 4 and 16mm 2AFC experiments in same plots.
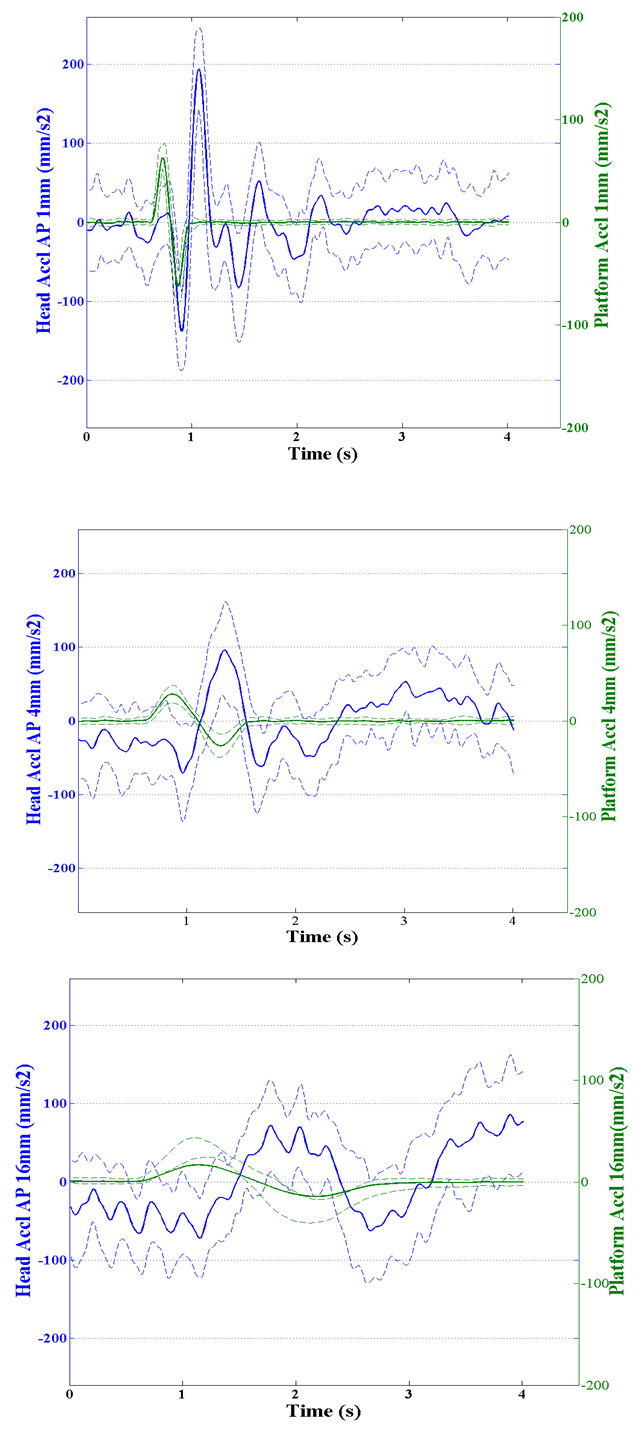 | Figure 4. Ensemble averaged (±S.D.) platform acceleration; and ensemble averaged Head AP acceleration |
 | Figure 5. Reaction time between platform acceleration as an input and Head AP acceleration as an output |
3.3. Correlation between Stimulus Frequency and the Reaction Time
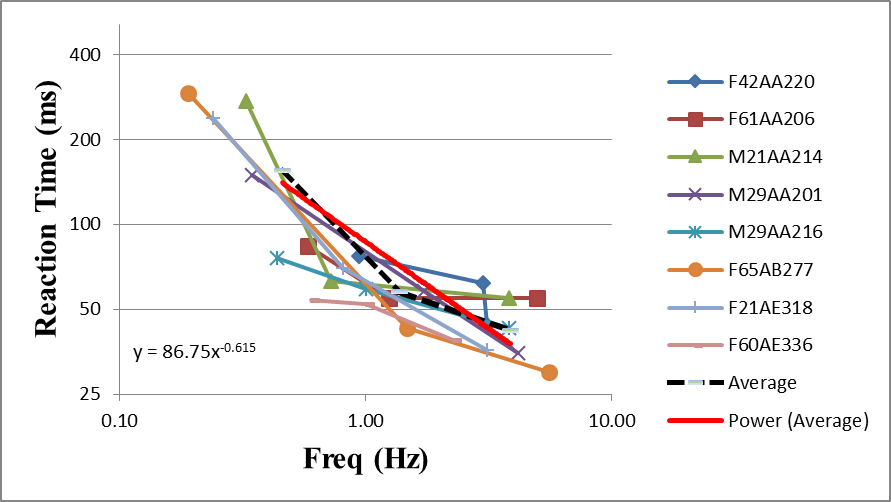
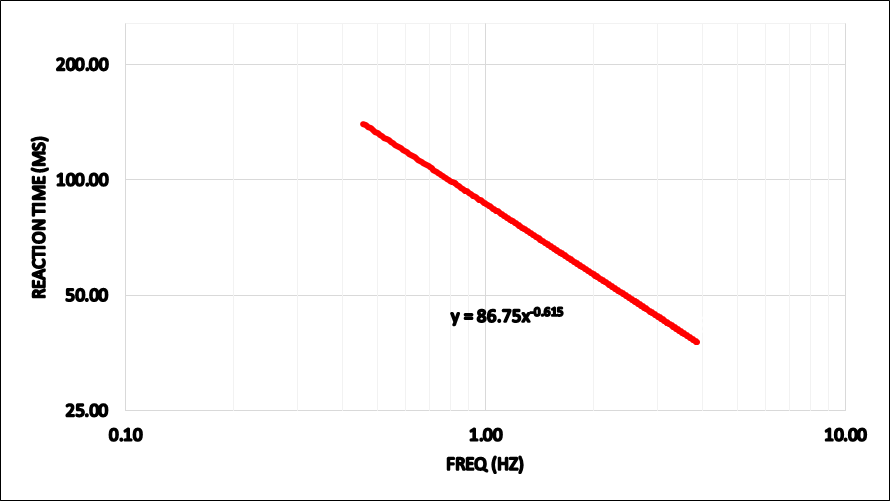
- Figure 6 shows the reaction time versus different frequencies of perturbation (1mm, 4mm, and 16mm) in 9 healthy subjects. A negative power law exists between head AP reaction time and stimulus frequency. In Figure 7 we used the power trendline (R2=0.947) to show this negative power law in our study population.
 | Figure 6. Frequency dependence of the Reaction time between platform acceleration as an input and Head AP acceleration as an output |
 | Figure 7. Power trendline that shows the relationship between head AP reaction time and stimulus frequency |
4. Discussion
- A Matlab based GUI (Graphical User Interface) was created to study the transference of acceleration from platform motion to subject‘s head. Different movement displacements (1mm, 4mm, and 16mm) in 2AFC experiments helped us investigate the frequency dependence of subject’s postural control reaction time. We studied here the effect of the external perturbation frequency on the postural control reaction time. A negative power law relationship was observed between the frequency of perturbation and a subject’s reaction time. Our study revealed that the reaction time is the frequency related parameter. In other words, the frequency of stimulus should be considered as a significant factor in reaction time computations. What does stimulus frequency related decline in reaction time imply? It could imply changing in input sensory systems information associated with the frequency of the stimulus [23].
 Abstract
 Reference
 Full-Text PDF
 Full-text HTML