-
Paper Information
- Paper Submission
-
Journal Information
- About This Journal
- Editorial Board
- Current Issue
- Archive
- Author Guidelines
- Contact Us
American Journal of Biomedical Engineering
p-ISSN: 2163-1050 e-ISSN: 2163-1077
2014; 4(4): 88-100
doi:10.5923/j.ajbe.20140404.03
A Measurement-Quality Body-Worn Physiological Monitor for Use in Harsh Environments
 Abstract
 Reference
 Full-Text PDF
 Full-text HTML
Daniel J. Schwab1, Clifton R. Haider1, Christopher L. Felton1, Erik S. Daniel1, Orhun H. Kantarci2, Barry K. Gilbert1
1Special Purpose Processor Development Group, Department of Physiology and Biomedical Engineering, Mayo Clinic, Rochester, USA
2Department of Neurology, Mayo Clinic, Rochester, USA
Correspondence to: Barry K. Gilbert, Special Purpose Processor Development Group, Department of Physiology and Biomedical Engineering, Mayo Clinic, Rochester, USA.
| Email: |  |
Copyright © 2014 Scientific & Academic Publishing. All Rights Reserved.
We describe the development and application of a body-worn data collection unit designed specifically for continuous long-duration recording of physical activity and electrocardiograms of extreme athletes and explorers in very harsh environmental conditions. These ruggedized body-worn units produce measured data of high amplitude and temporal resolution such that the post-processed data can be used for the analysis and assessment of the effects of extreme physical stress on these individuals, including cold conditions and high altitude effects. We will describe the approach employed in the development of these units, including design and assembly methods, and initial results recorded from researchers and from professional mountain climbers in acclimation and ascent of Mount Everest during Spring 2012.
Keywords: Body-worn unit, Biometric sensors, ECG, Harsh environment, Extreme athletes, Biomedical electronics
Cite this paper: Daniel J. Schwab, Clifton R. Haider, Christopher L. Felton, Erik S. Daniel, Orhun H. Kantarci, Barry K. Gilbert, A Measurement-Quality Body-Worn Physiological Monitor for Use in Harsh Environments, American Journal of Biomedical Engineering, Vol. 4 No. 4, 2014, pp. 88-100. doi: 10.5923/j.ajbe.20140404.03.
Article Outline
1. Introduction
- It is hypothesized that the environmental effects of prolonged exposure to the temperature and altitude of the Mount Everest environment mimics and accelerates the cardiovascular and cardiopulmonary deterioration observed in compromised elderly patients. To investigate further, in January 2012 the Mayo Clinic teamed with the National Geographic Society and the North Face apparel company to sponsor an expedition to Mount Everest, to compare and contrast with a large earlier body of such work, e.g. but not limited to [1-5]. The instrumentation employed in earlier projects was substantial, and the experiments meticulously conducted. However, one of the elements that has improved since those previous studies is the evolution of miniaturized electronics. Our engineering group was tasked to prepare and field autonomous (i.e., without requiring any user interaction once under study) physiological monitoring units sufficiently rugged, small and unobtrusive that they could be worn comfortably by medical researchers and climbing team members. The purpose of these units was to collect high temporal and spatial resolution motion andelectrocardiogram (ECG) data throughout the duration of the expedition, in very harsh environmental conditions. Although our group [6-9] and others [10-16] have developed body-worn units including motion and and/or ECG measurements, they were intended for civilian use in environmentally benign environments, not for such challenging conditions.
1.1. Development of Requirements for a Ruggedized Body-Worn Unit
- We began the development of requirements through an analysis of the physiological variables to be measured as well as the environmental stressors that would be experienced by the units. The final requirements list made it clear that a nearly “clean sheet of paper” design would be required, not only to incorporate ruggedization features, but also to incorporate a very low power-drain three-lead electrocardiogram (ECG) measurement and recording capability as well. The challenges associated with the rapid development of body worn ECG and motion monitoring were subsumed into two broad categories. The first category was the intended environmental / operational environment; the second category was the engineering challenge of creating, testing, and fielding the body worn units within three months, a duration dictated by the departure date of the teams for Nepal.
1.1.1. Physical Design Challenges
- The ruggedized body-worn units (hereafter referred to as the Everest units) had to support the ECG capabilities, the extended operating durations, and the harsh environment features. The units had to provide at least a two-week run time, at very cold operating temperatures, to minimize the need to swap devices during the final summit climb. These performance demands, combined with numerous environmental challenges, mandated that extra precautions be taken to insure robustness of the Everest units. The list of challenges included making the unit not only wearable and nonirritating for the climbers, but in addition, to accommodate the following conditions: 1) ruggedness to survive extreme physical activity; 2) coordinated placement of the unit within climber apparel; 3) reduced ECG lead lengths to minimize lead breakage and electrode disconnects; 4) a means of eliminating accidental and undesired activation or deactivation; 5) assurance of electronics and battery survival at operating temperatures from 37o C to perhaps as low as 10o C (the skin surfaces of climbers in extremely cold environments are typically far lower than their core temperatures); 5) unit survival in the face of significant changes in atmospheric pressure, i.e., sea level (760 mm Hg) to 29,000 feet (237 mm Hg), requiring that the units not be hermetically sealed; 6) low-humidity (0%) environments (creating increased susceptibility to electrostatic discharge (ESD); 7) high humidly (100%) environments (due to climber perspiration under layers of clothing); 8) ingestion of moisture-saturated air, resulting in condensation of water droplets on the circuit board; 9) high incidence of gamma ray-induced “single event upsets” in the microcontroller electronics caused by the low level of atmospheric shielding at the high altitudes; 10) provisions to hot-swap ECG electrodes, ECG leads, and batteries; and 11) the availability of an easily observed visual indicator of proper operation at high ambient light levels.
1.1.2. Operational Design Challenges
- The units had to be small and comfortable enough not to interfere with climbing activity or sleep, and needed to operate continuously on their wearers, 24 hours per day for up to two weeks, without requiring a battery change or any user intervention i.e., autonomous operation. The climbers requested “larger” units (in the X and Y dimensions) if their “thickness” (the Z dimension) could be minimized. A high ECG temporal and amplitude sampling resolution of 400 samples per second (SPS), 12 digital bits per sample was requested to obtain the needed resolution for post-climb analysis of heart rate (HR) and heart rate variability (HRV). We decreased the temporal resolution of the motion detecting accelerometers from 100 SPS to10 SPS per accelerometer axis [4-7], recognizing that the physical demands on the climbers would degrade their activity levels. The ability to change ECG electrodes and leads was required, but the electrodes needed to remain on the skin for many days between changes. The units needed to support the ability to perform periodic data offloads to a laptop computer, as well as allowing for battery changes (although neither action was ultimately undertaken by the climbing or physiologist teams). Simplicity of usage was critical since fatigue, lack of sleep, physical discomfort and lowered blood oxygen saturation levels could affect the decision-making ability of the climbers and the physiology team members. Thus the units were designed to require no user intervention save for activation of a recessed mechanical on/off switch on the side of the unit’s aluminum case. Operation could be easily verified by means of a light emitting diode (LED) indicator.
2. Materials and Methods
2.1. Ethics Statement
- All human studies, described in the manuscript, were Health Insurance Portability and Accountability Act (HIPAA) compliant and approved by Mayo Clinic's Institutional Review Board, under Mayo IRB Protocol #10-006608 00 on December 7, 2010. Informed written consent was obtained from all subjects prior to the studies.
2.2. Overall Description of the Body-Worn Units
- We developed the Everest units based upon proven results from previous generations of motion only data loggers, described in [6-9]. Although both two-lead and three-lead versions were developed, it was decided to use the two-lead implementation to minimize discomfort for the climbers. Figure 1 is a comparison of the typical patient-oriented units developed first (on the right) and the units worn by the climbers. Note particularly the thinner profile of the Everest units. Both generations of devices employed a platform concept, in that there was a common core set of components, circuit functions, and firmware: the microcontroller (µC); nonvolatile NAND flash main memory; high precision timing crystals; universal serial bus (USB) communication port; other support circuits such as voltage regulators, switches and light emitting diode (LED) indicators. This suite of components formed the platform to which other functions were added, specifically for this application, ECG. Figure 2 is a detailed block diagram of the Everest units; Figure 3 depicts the front and back sides of the Everest unit printed circuit board (PCB), with the components identified.
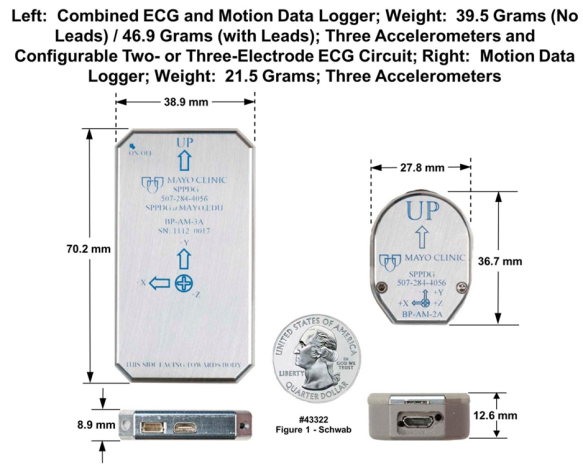 | Figure 1. Two versions of body-worn monitoring units. Leftmost unit is the “Everest unit”, dimensions are 38.9 mm X 70.2 mm X 8.9 mm; weight is 47 grams with leads. Rightmost unit is a motion-only recording unit employed in preclinical studies (43322) |
2.3. Sensor Suite
- The Everest units were designed to accept a number of on-board and off-board sensors. The following sections will describe these elements.
2.3.1. Accelerometers
- The Everest units contained three accelerometers to provide a choice of measurement ranges. The first accelerometer was a selectable dual-range 2 or 8 G component; one range or the other could be used, but not both at the same time. The higher sensitivity 2 G range was intended for fine motion measurement for the monitoring of breathing for units placed on the chest. The 8 G range was applicable for general motion measurements. The 16 G accelerometer was suitable for the largest amplitude motion measurements such as extreme athlete monitoring. The 16 G accelerometer could be used by itself or in combination with the 2/8 G accelerometer, thereby providing the capability to capture both large amplitude motion events (16 G) and finer motion events (2 G) at the same time. In addition to the different ranges, different sample rates such as 10, 20, 50, 100, 200 or 400 samples per second (SPS) and sampling amplitude resolution could be selected by the setup technician for each of the different accelerometers. The accelerometers provided an analog output voltage that was digitized by the integral analog-to-digital converter (ADC) within the µC. For example, the setup technician could select 8, 10 or 12 bits of amplitude resolution at the different rates just described, with individual rates and resolution tailored for each accelerometer if desired.The third accelerometer was a quad-range component with selectable ranges of 2, 4, 8, and 16 G, and an integral 10-bit ADC, and could support selectable sampling rates of 1 to 5,000 SPS (this component was referred to as the digital accelerometer, because of its digital serial interface to the µC). In addition, this component incorporated a built-in wake up on event- inertia-orientation function with programmable levels and integral temperature sensing as well. The digital accelerometer could be used independently or in combination with the other two (either or both) accelerometers. Temperature sensing was also integrally provided with this accelerometer.
2.3.2. ECG Circuitry
- Because of the intended long-duration operation required of these units, we designed a very low power noncommercial implementation of the ECG circuitry (Figures 2 and 3). The ECG circuit consisted of multiple analog amplification (gain) stages, the first of which was a differential input instrumentation amplifier with a gain of nominally ten, followed by a 0.5 Hz high pass filter (gain of one) and then a 200 Hz low pass filter with a gain of 100. The final stage was an operational amplifier with manually configured fixed gain or end-user-controlled programmable gain. The default gain for this output stage was one; thus the gain of the entire amplifier chain was 1000 (i.e., 10 x 100). In the two-electrode configuration that was ultimately employed, the current requirement was 100 µA at a 2.8 V regulated supply voltage, i.e., 0.3 mW power consumption. The circuit relied on the 100 dB common mode rejection feature of the instrumentation amplifier to cancel externally induced noise and common mode signals such as those produced by muscle movements. Figure 4 presents the results from a variable-rate ECG test, with input to the unit’s two electrodes from an ECG simulator, which varied the simulated heart rate at specific intervals spanning 15 seconds to 1 second. This ECG simulator waveform was digitized, stored in the unit’s nonvolatile memory, offloaded, and then processed on a computer to verify correct operation of the ECG circuitry when compared to the settings on the simulator. A higher fidelity three electrode ECG circuit configuration included an additional dual operational amplifier to provide an active cancellation signal path back to the body (Figure 2), commonly known as the Right Leg drive (RLD) or Wilson Central Terminal (WCT) function. This circuit provided better rejection of noise and other common mode artifacts at the expense of increased power consumption. The current requirement was nominally 135 µA, with a power consumption of 4 mW. The three-lead implementation was not used by the teams because it was decided that one less electrode over a multi-week duration, with few opportunities to change clothing, would result in the minimum amount of skin irritation. The gain of both of the ECG circuits was adjustable, either manually by a support technician or via user programming. The sample rate could also be varied under user control in a similar manner to the accelerometers; sample rates could range from 10 samples per second (SPS) to 800 SPS; 400 SPS was selected for the Everest expedition. Recent updates to the real-time operating system (RTOS) running on the unit’s microcontroller now allow 1000 SPS on the ECG electrodes and simultaneous 100 SPS on each of at least six other inputs to the µC, while simultaneously decreasing the instantaneous power requirements on the unit’s battery by more than 70%.
2.3.3. Stable Clock Source
- Figure 2 illustrates several other features of the Everest unit. Included in the platform core group of components was the µC, which had an internal timekeeping function that required an external crystal. The crystal used in the Everest unit had a tolerance of +/- 3 parts per million (+/-3 PPM), i.e., much more time-stable than the commonly available +/- 20 and +/- 10 PPM crystals. This timing function was used as a data logging time stamp, and also to wake the unit up at a precise time to begin a sampling sequence. The timed activation feature allowed the unit to turn itself on at a precise time.
2.3.4. Circuit Board
- The Everest unit circuit board, depicted in Figure 3, was 36 mm wide, 48 mm high and 1.0 mm thick. The board cross section contained eight 0.016 mm copper metal layers, seven FR4 [IT180] 0.1 mm and 0.127 mm thick dielectric layers, as well as 716 total drilled holes, the smallest of which were 0.25 mm in diameter. The board was populated with 363 components, including 30 active semiconductors; the remaining 333 were passives. The largest components were placed on the upper surface of the board, as identified in the left panel of Figure 3. The right panel depicts the lower surface of the board, containing the smaller and thinner components. Many components were tightly spaced to minimize distance between them and thus overall in-path inductance, which in turn was critical in the supply decoupling paths to minimize overall system noise. This design approach was based on “lessons learned” during the development of body-worn units for clinical applications [6-9], augmented for this application.
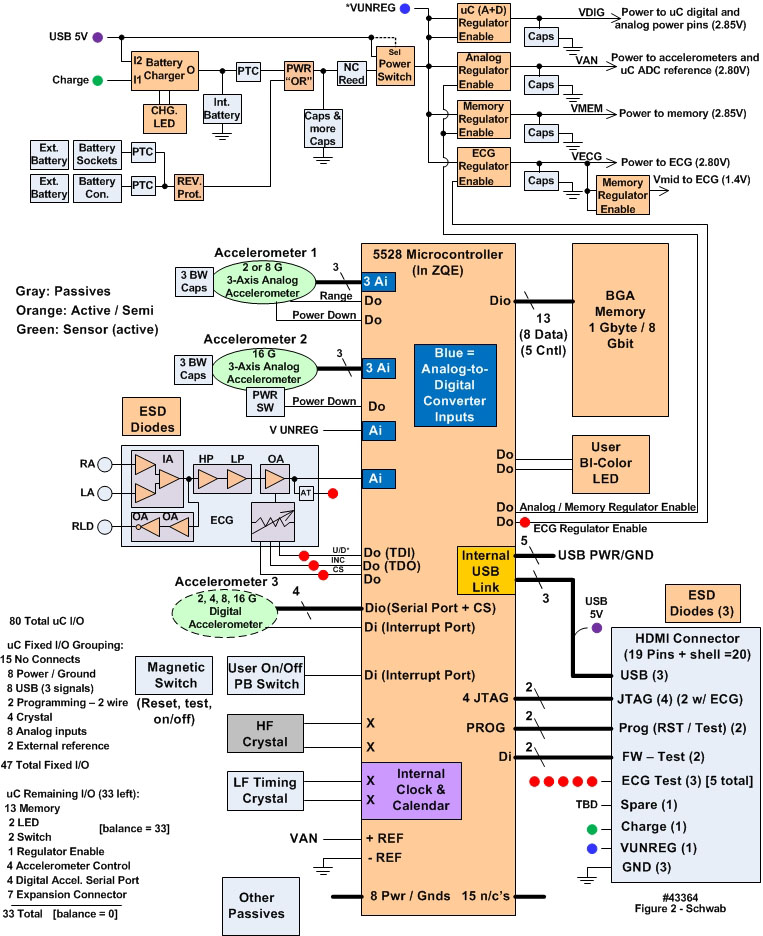 | Figure 2. Detailed block diagram of the Everest unit’s hardware configuration (43364) |
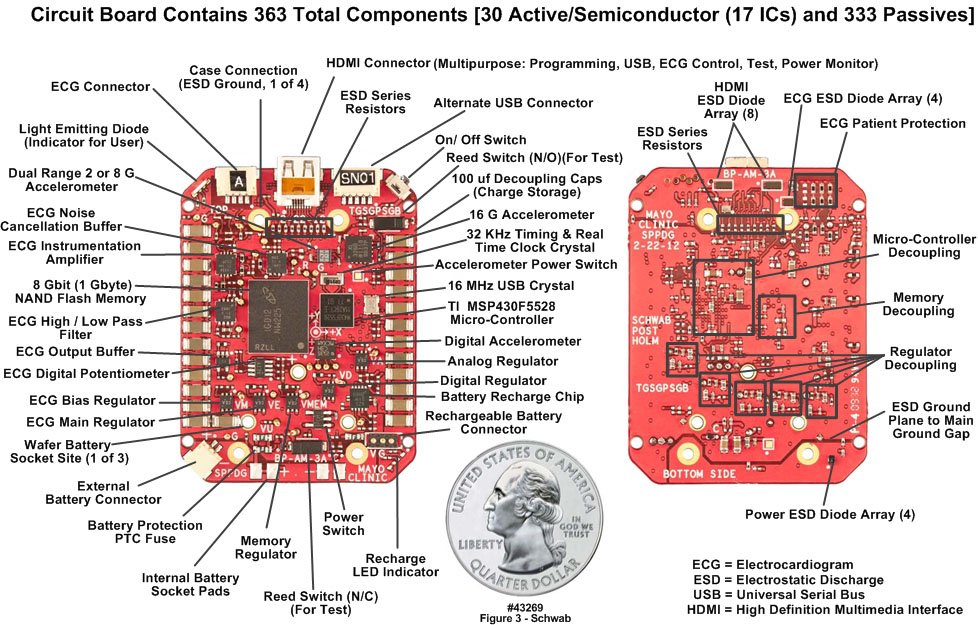 | Figure 3. Everest unit populated printed circuit board front and back sides (43269) |
2.3.5. Choice of Batteries
- Provisions were made to allow the circuit board to be used with batteries of different sizes and shapes, thereby enabling different run times and case packaging options to meet various end-user requirements. We identified a total of three batteries that could be plugged directly into the edge of the circuit board; the respective capacities were 400 mAH, 750 mAH (used in the Everest units) and 1600 mAH. The smaller and larger batteries would allow for, or require, smaller or larger aluminum cases respectively than depicted in Figure 1. In addition to the plugin battery provisions, options were included to employ a half-dozen different types of thin-film batteries, both primary and secondary cells, which could be placed to the side, or on top of, or underneath the circuit board, ranging in capacity from 45 mAH to 1200 mAH.
2.4. Harsh-Environment Hardening of the Everest Units
2.4.1. Circuit Board Encapsulation
- In a recognition of the harsh physical environment to which these units would be exposed, each Everest circuit board was encapsulated in a fully aluminum housing, unlike in the units intended for clinical applications (rightmost image in Figure 1), in which one half of the clamshell case design was polycarbonate. As is apparent in Figure 1, the case has a thin profile to provide the best end-user comfort. The connector interfaces, switch and light emitting diode (LED) operational indicator are labeled in Figure 3. The activation switch (near the upper right corner of the upper surface of the PCB) was recessed to prevent inadvertent deactivation of the units. The LED was protected under a translucent dome on the rightmost corner of the case. The ECG connector, located adjacent to the LED indicator, could support a maximum of four leads. The large connector centered at the top was a nineteen-pin micro High Definition Multimedia Interface (HDMI) connector that served the following purposes: USB data offload and device configuration, microcontroller programming, ECG circuit monitor and gain adjustment, battery charging and unit diagnostics. The clamshell aluminum housing (Figure 1) provided a mechanically robust and environmentally protective shell, was lightweight, and provided an ESD shielding cage (i.e., a “Faraday cage”) for the electronics. The thin case was milled from solid aluminum plate material, incorporating a rabbet joint at the matching upper and lower case edges. The two sides of the case were connected with six drilled-and-tapped screws. Serial numbers and an X-Y-Z axis designator were milled into the outer surface of the upper lid for identification and tracking purposes. The thin form factor allowed the unit to be placed in small pockets sewn into the climbers’ moisture-wicking undershirts, centrally located on the chest above the xiphoid process. This placement provided a tight fit of the unit within the pocket, close to the climbers’ chests, to allow the measurement of small movements of the chest wall during respiratory cycles, and to be in close proximity to the ECG electrode skin patches. The placement also minimized ECG lead lengths, which in turn minimized lead bending and potential breakage, and minimized increases in ECG electrode contact resistance and mechanical electrode stresses caused by “tugging” on the wires.
2.4.2. Protection against Electrostatic Discharge
- The aluminum protective shell did not completely solve the ESD shielding issue. Other contributors to the ESD vulnerability included the ECG leads themselves, inadvertent ESD events when the units were removed from the wearer, when the units were being connected to a computer with a USB cable for data offloads, and when batteries were replaced. To minimize these sources of ESD damage, inputs and outputs (I/O) including power were augmented with aggressive ESD protection components, including shunt capacitors and ESD clamp diodes to “case ground”. The connection path lengths for these capacitors and diodes were carefully controlled to ensure minimal resistance, and more importantly, minimal inductance. The goal was to provide the absolute lowest possible “ESD event” impedance path from any input or output line to the case. The low impedance paths were implemented using multiple copper layers for the connection paths, including the use of two mechanical screw connections from the circuit board to the case at each of the extreme ends of the circuit board. At one end were the ECG and HDMI connectors, while at the other end was the battery replacement access point; both ends required ESD protection. In addition, the ESD ground return path copper plane metallization was isolated from the main PCB ground plane through the use of ferrite chips, which served as low-loss inductors at low frequencies but high impedance series elements for the high frequency ESD transients. The combination of the low impedance shunting (capacitors and diodes) with high impedance series ferrites succeeded in isolating ESD transients from the sensitive electronics.
2.4.3. Protection against Other Confounding Electrical Disturbances (Shielding)
- The electronic circuits had additional provisions to minimize transient events and electrical disturbances, including multiple capacitors to provide broadband localized decoupling at every electrical component power connection pin. Small case size (0.5 mm length) 0.22 µF capacitors were placed as close as possible to the power pins, also to minimize series inductance; combined with short and direct return paths, the combined structure provided a low impedance path for the highest frequencies. The next capacitor was a medium-sized (1.0 mm length) 2.2 µF capacitor exhibiting the next lowest impedance to assure mid-band frequency decoupling. Finally, large (3.0 mm length) 100 µF capacitors provided the lowest frequency decoupling path. This suite of three capacitors, combined with their proximity placement, was selected for minimal loss, minimal inductance, and best decoupling. Additional shielding and protection on the circuit board was achieved through the incorporation of multiple power and ground planes. The circuit board contained eight metal layers: two for signal, with the remaining six for power, ground and component attachment on the outer two surfaces. These multiple planes provided lower inductance and increased capacitance (due to the adjacency of the planes), and also shielded the sensitive signal layers. Finally, on all signal and power layers a complete ground ring surrounded the edge of the board, with multiple vias connecting the rings (on each layer) to the multiple ground planes in the board. Thus for the signals the implementation was a shield (board planes and rings) within a shield (outer case).
2.4.4. Protection from the Effects of High Humidity
- Because of the likelihood of water vapor condensing inside the unit, a 3M Novec 1700 electronic grade hydrophobic and oleophobic protectant was applied to both sides and all edges of the populated PCB. In addition, the connector end of the aluminum case was dipped in the protectant, to ensure that no surface would support condensation on the case or on the PCB at these connector-to-case interfaces. During installation of the PCB into the case, an additional silicon rubber sealant was applied at the connector-to-case interfaces to eliminate any possible gap.
2.4.5. Protection against Inadvertent Deactivation and Lead Breakage
- In addition to the recessed position of the activation switch, a timing loop in the microcontroller software required the switch to be physically activated continuously for two seconds (displayed on the LED indicator) for a change in switch position to be considered a valid event by the microcontroller software. To minimize the chance of ECG connector disconnects and to provide strain relief for the ECG leads, small flexible wires ran from the ECG connector to a strain relief junction, where they were soldered to larger, more robust, though still flexible ECG lead wires with ECG snap connectors at the distal ends matching those on the ECG electrodes. Care was used to optimize ECG lead positions at the strain relief junction so that there would be no lead crossovers when the units were installed in the apparel pocket.
2.5. Verification of the Measurement Consistency and Calibration Stability of the Units
- In addition to the validation of the low power ECG circuitry as described in Section 2.2.2 and in Figure 4, we wanted to verify the measurement consistency and repeatability of the body-worn units both individually and as a group. The two measurement sets to be verified were the ECG circuitry (as noted above) and the accelerometers. However, there was an extremely limited time available, eleven weeks, from the initiation of the project to the delivery of the units to the professional climbing team before they departed for Mount Everest. Further, we had only limited access to the team prior to their departure. We used different approaches to test the ECG repeatability and the accelerometer stability, as described next.
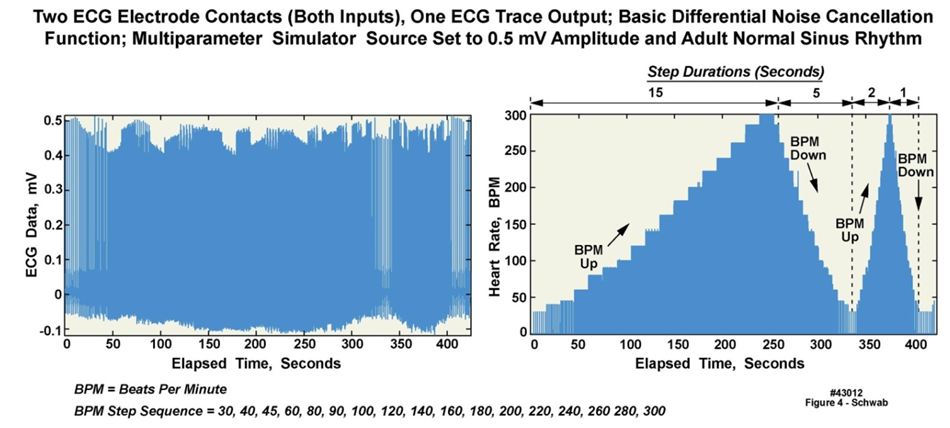 | Figure 4. ECG simulator waveforms acquired with ECG circuitry in Everest units (43012) |
- Figure 5 displays a ten-second duration of eight ECG data waveforms, collected from eight of the nine climbers at an elevation of approximately 400 m during a pre-climb physical evaluation. A single biomedical monitor (serial number 1112-0010) was employed to verify that the fixed gain ECG amplifier chain (as a power-saving strategy, automatic gain control circuitry was not implemented) would be viable for a variety of different subjects; note that all of the units were set to the same amplifier gain. As can be seen in the figure, six of the eight waveforms were captured entirely; the waveforms of only two individuals (climbers One and Two) were driven slightly over range using that single gain setting. This slight overdrive for two of the climbers was viewed as acceptable, because their heart rates and heart rate variability would still be determinable even if their ECG waveforms were slightly overdriven. In addition, the ECG electrode contact resistance was expected to increase over time, which in turn would cause a reduction in signal amplitude for all of the climbers. Aside from the testing conducted with an ECG simulator as described in Section 2.2.2 and Figure 4, there was no other way to test consistency, since ECG waveforms vary somewhat among individuals, and because even a single individual’s ECG waveform varies slightly over time.
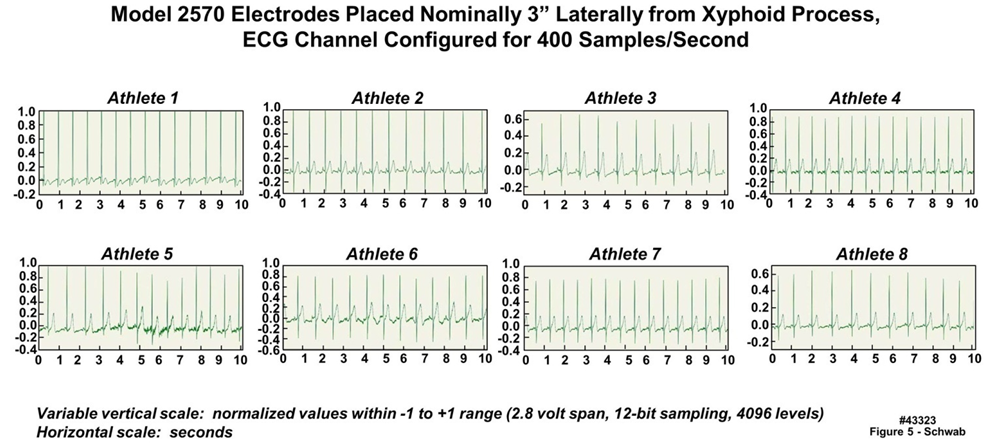 | Figure 5. Data acquired from eight athletes using a single Everest unit configured with two-electrode electrocardiogram (ECG) recording capability (43323) |
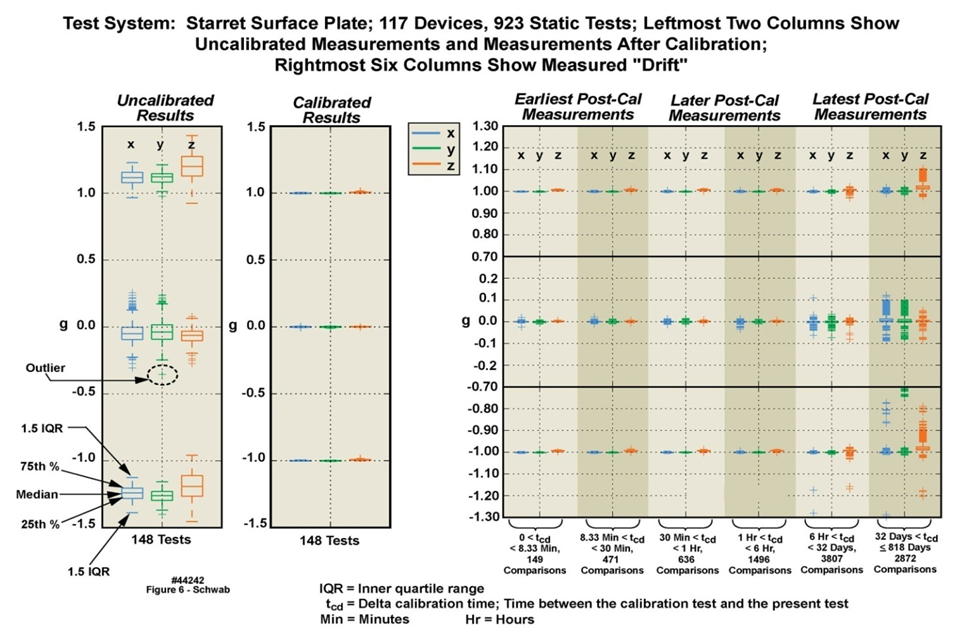 | Figure 6. Variations caused by drift in the 16 G accelerometers incorporated into 117 motion-only body-worn units (rightmost unit depicted in Figure 1) over an 818 day duration (44242) |
2.6. Support Software Residing on a Host Laptop Computer
- Software was developed on a Microsoft Windows PC platform that supported the following capabilities: A) offloading of sensor data from the unit’s nonvolatile memory; B) configuring sensors and sampling of those sensors; C) assessing the amount of memory “filled” by data; D) retrieving the unit’s serial number, model name and firmware code revision; E) retrieving device errors and resolving those errors; and F) setting sampling start and stop times (duplicating the activation switch).The design goal of the host software was the provision of a simple interface that could support users with different areas of responsibility. Some users would only need to execute the basic operations of starting and stopping sampling, as well as offloading data. Other more sophisticated users might be involved in sensor configuration. During the Everest expedition, the Mayo research team elected simply to exchange “data full” units for previously unused units, returning all of the units to the development team at the conclusion of the expedition.
3. Initial Tests of the Units in a Harsh Environment
- Three weeks prior to the departure of the team for Nepal, three amateur mountaineers executed a climb of The Moose’s Tooth, a 2000 foot tower of rock and ice located in the Central Alaska range, during which they negotiated 25 “pitches”, of approximately 5.9 difficulty. The units performed without incident and returned clean, noise-free raw data spanning several days. These results increased our confidence that the units would perform well on Mount Everest.
4. Results
4.1. The Expedition Teams
- The climbing team consisted of nine members. Seven of the climbers who reached the summit, including the only individual who did so without supplementary oxygen during the 2012 climbing season, wore these units throughout the expedition’s duration. Data was collected both from the climbing team and from the five-member research team, with data from the latter group used only for quality verification purposes. The two ECG electrodes were located 4-6 cm to the left and right of the sternum respectively, and several cm above the xiphoid process. All members of the research team were in good-to-excellent health and physical conditioning. However, because they were not as inured to the hardships of high altitudes or as altitude-acclimatized as the professional climbers, the research team members described their extreme discomfort even at base camp (17,600 feet), due to oxygen deprivation, extreme cold temperatures, and uncomfortable sleeping conditions. They experienced hypoxia, sleep apnea, Cheyne Stokes respiration, nausea, loss of appetite, and vomiting.
4.2. Examples of Raw Data Collected by the Everest Units
- We now illustrate the type and quality of data that the Everest units were able to collect for detailed analysis. The raw data, when decompressed, approached 100 gigabytes. Figure 7 is a multi-panel chart illustrating both ECG and motion data collected from one of the Everest units, worn by “professional climber 6”, while at base camp. The data in this chart is an extract from the entire multi-day recording, time-logged by the unit’s time-of-day clock as 5:09 AM Nepal time, May 2, 2012, during a sleep period. The upper left and right panels depict ten minutes and two minutes of ECG data at 400 SPS); the lower left and right panels depict ten minutes and two minutes of three-axis accelerometry data at 10 SPS across all accelerometer axes. The colored vertical strips in the leftmost panels define the two minutes of data displayed in expanded-time mode in the rightmost panels. Note 1) the change in position of the wearer as illustrated by the motion data, and the associated motion artifact in the two-minute ECG data; 2) the three vertical lines in the leftmost panels, illustrating a pattern of 3-5 rapid beats every 20-30 seconds; and 3) the “missed beat” in the rightmost ECG waveform panel a few seconds before the sleeper changes position.Figure 8 is a multi-panel chart presenting ECG data only, also from “professional climber 6”, during the same sleep period as described above. The upper leftmost panel depicts one hour of data. The upper right panel is a ten-minute extract from the one-hour panel, as demarcated by the colored strip in the one-hour panel, and so on from the upper left, to the upper right, to the lower left, to the lower right panels, down to ten seconds of resolution. Note 1) the excellent reproduction quality of the ECG waveforms; 2) the repetitive anomalous ECG patterns in the ten-minute and one-minute panels; and 3) the missed beat in the ten-second panel. The waveforms in Figures 7 and 8 are presented “as is”, i.e., with no postprocessing to suppress electrical noise, attesting to the value of careful electrical design and implementation of the units.
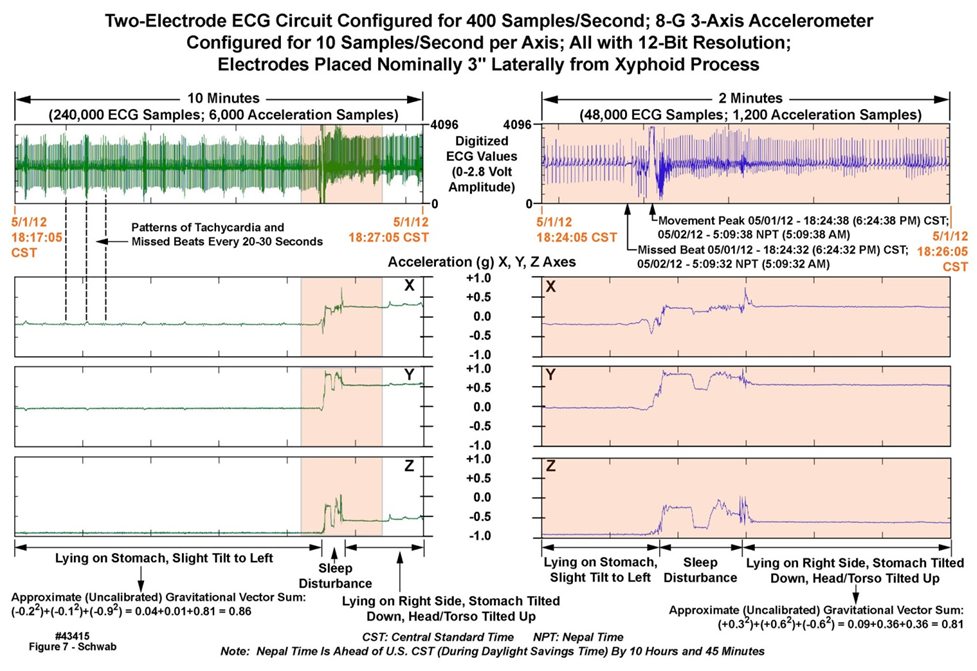 | Figure 7. Ten minutes of ECG and motion data collected at Everest base camp with a body-worn unit (43415) |
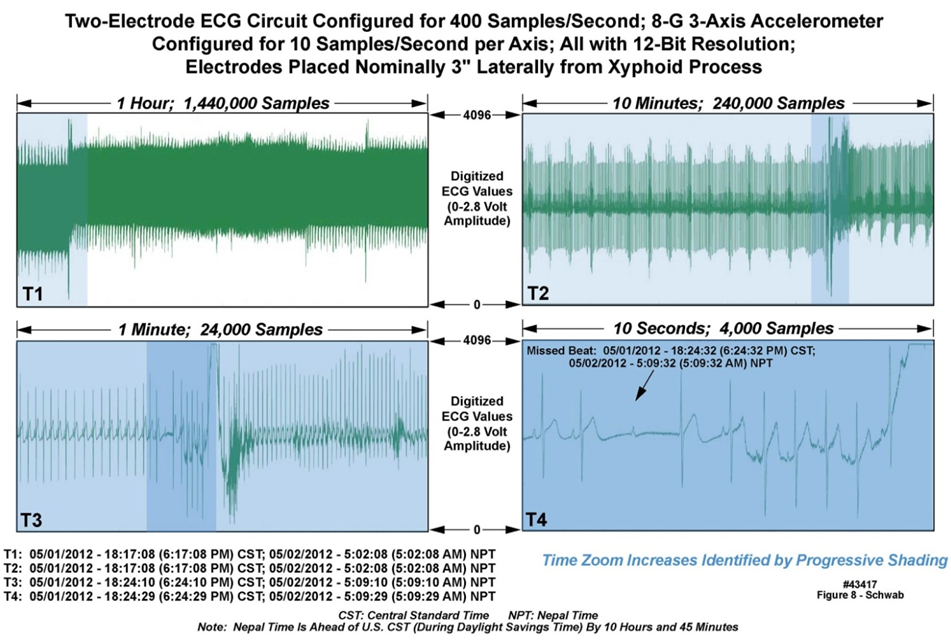 | Figure 8. One hour of ECG data acquired at Everest base camp with a body-worn unit (43417) |
5. ECG Data Processing, Extraction of Heart Rate and Heart Rate Variability
- Postprocessing of the data can be carried out in a number of ways. Figure 9 presents one example of such postprocessing, on ECG data from “professional climber 1”, recorded on April 30, May 2, and May 5, 2012 respectively in the late and early afternoon time periods. Algorithms were used to identify the R-waves in the ECG patterns (upper row), and then to compute statistical measures based on such elements as R-R interval (lower row). Although a complete discussion of the algorithms is beyond the scope of this manuscript, a brief step-by-step description of the postprocessing employed for Figure 9 is as follows: 1) The raw data was converted from unsigned integer values to floating point and scaled to correspond with the measured 0-1 V range; 2) the DC voltage baseline was removed from the data; 3) the time derivative of the data was calculated to increase the sensitivity to the R-wave; 4) R-waves were detected using a physiologically relevant threshold and refractory period; 5) ordered statistics evaluated the likelihood of a useful R-wave versus artifact; 6) extreme amounts of motion at points of predicted artifact were used to ignore time-periods where statistically the R-wave measurements were corrupted; 7) detected locations of the R-waves were mapped back onto the original signal and displayed; 8) beat-to-beat heart rate was calculated and displayed; 9) moving average heart rate parameters were displayed; and 10) statistical measures of heart rate were estimated and overlaid.
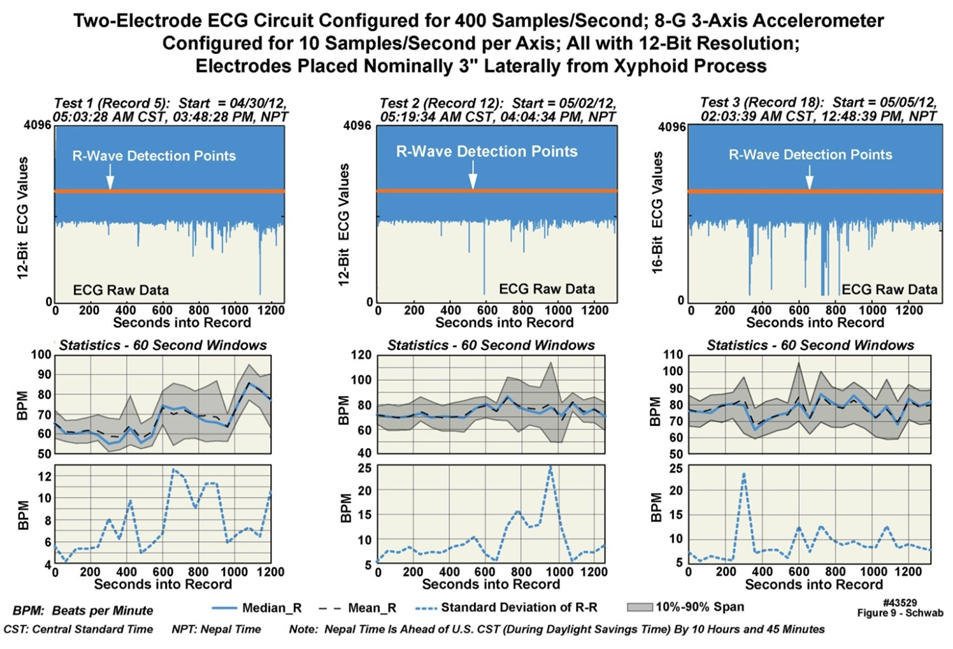 | Figure 9. Examples of ECG data postprocessed from Mount Everest Expedition (43529) |
6. Discussion
- We have described the design approach employed in the development and fielding of ruggedized body-worn physiological monitoring units that have demonstrated the ability to survive some of the harshest physical environments that extreme athletes and explorers may be subjected to. Within an eleven-week span more than 40 of these units were designed, fabricated, and tested, with careful attention to every hardware and software detail. The units were operationally tested in Alaska, and then deployed to Mount Everest. The returned data was of sufficiently high quality that post processing to extract physiological information was possible without the need to filter out, e.g., unwanted electrical noise. These units are being applied in preclinical studies that rely on their programmable measurement capabilities and on their physical robustness. The ruggedized design approach may well be extended to other such units with different measurement capabilities in support of a variety of extreme athletes for, e.g., cardiovascular and fitness training, or to the military for use in harsh environments.
ACKNOWLEDGEMENTS
- The authors thank the following individuals for their contributions: S. Bancroft, C. Burfield, T. Funk, A. Issa, B. Johnson, K. Kantarci, B. McCoy, D. Moertel, S. Neumann, S. Polzer, S. Schreiber, and C. Anker and other members of the Mount Everest professional ascent team. This work was funded by the Mayo Clinic.
Conflict of Interest Statement
- We report no Conflicts of Interest with regard to all of the authors.