Ola S. Abdalsalam1, Alaa Aldeen Awouda2
1Department of Biomedical Engineering, Sudan University of Science and Technology, Khartoum, 11123, Sudan
2School of Electronic Engineering, Sudan University of Science and Technology, Khartoum, 11123, Sudan
Correspondence to: Ola S. Abdalsalam, Department of Biomedical Engineering, Sudan University of Science and Technology, Khartoum, 11123, Sudan.
| Email: |  |
Copyright © 2014 Scientific & Academic Publishing. All Rights Reserved.
Abstract
Diabetes is a worldwide spreading disease according to the World Health Organization (2009). In order for diabetic patients to adhere a strict diet, exercise and medication; an accurate and reliable ways of glucose concentration measurement must be available. The frequent puncturing of skin in the invasive measuring devices may cause an increase in skin permeability; at the same time non-invasive techniques produce a high percentage of error compared to the invasive techniques. A Joint non-invasive technique was proved to reduce the root mean squared error of prediction. The goal of this study is to suggest a reliable, painless and portable device for glucose measurement, by joining two Scattering Spectroscopy methods; one based on the Raleigh scattering theory and the other is based on the linear relation between glucose concentration and the scattering angle. The readings of each method was evaluated against a reference invasive device (Omnitest® plus from B|Braun); using the Clarke Error Grid Analysis (EGA) and the Mean Squared Error of prediction (MSE). The Rayleigh Scattering Theory based measurements of glucose concentration produced better measurements than the linear relation between glucose concentration and scattering angle (θ) with 72.7% of the reading falling into region A (clinically accurate), 27.3% into region B (clinically acceptable) and MSE of (368.4). The two techniques were then combined using the mean value, it was found that the mean does not contribute to the clinical accuracy of the measurements, but the overall MSE value was reduced to (398.7). This indicated that the MSE of the linear relation measurement can be reduced by combining its results with the Rayleigh based measurements.
Keywords:
Non-invasive Glucose measurement, Scattering Spectroscopy, Rayleigh Scattering theory, Near-Infrared
Cite this paper: Ola S. Abdalsalam, Alaa Aldeen Awouda, Non-invasive Glucose Monitoring Using Scattering Spectroscopy, American Journal of Biomedical Engineering, Vol. 4 No. 3, 2014, pp. 53-59. doi: 10.5923/j.ajbe.20140403.01.
1. Introduction
Diabetes is a chronic disease in which the body does not make, or does not properly use insulin. According to the World Health Organization, 170 million people have diabetes worldwide and this number may well double by the year 2030 [1].In 1996 the crude prevalence of diabetes in Sudan for population between the age of 25 and 65 was 3.4 (3.5 among men and 3.4 among women) [2]. The invention of blood glucose monitoring equipment gave people with diabetes accurate and reliable ways of caring for themselves outside a hospital or doctor's office. The invasive measurements depends on test strips which uses the biochemical reaction to display glucose concentration values, later on electrochemical reaction based devices were introduced; These devices were better in terms of accuracy and speed [3]. However, some studies suggested that the frequent puncturing of the skin might cause an increase in skin permeability which consequently affects the concentration of tissue analytes [4].The non-invasive approach had appeared recently. It started with studying glucose molecules and the response and effect of glucose presence on optical, chemical and electrical aspects [3]. Chemical approach is susceptible to degradation over time via consumption, photo-bleaching or denaturation. Electrical approach can cause skin irritation [3], and need fluid extraction in order to perform accurate measurements [3]. Therefore, this study focuses on optical methods for non-invasive glucose measurements.
1.1. Light-Tissue Interaction
Light-Tissue interactions are limited and few, however in details each interaction can lead to several consequences and therefore a variety of potentials. There are major optical parameters that affect the interaction between light and matter such as: Wavelength of the incident light, Power or energy of the incident light, Spot size, Irradiance or radiant exposure, The pulse duration, Polarization state of the incident light, The absorption coefficient, The scattering coefficient and the Mueller matrix describing the stroke parameters [5]. The basic light-tissue interactions are remission, scattering and absorption. Remission is the propagation of light back from the tissue surface generally toward the source. Absorption in tissue causes the absorbing molecule transitions from its ground state to an excited state [5].The scattering of light may be thought of as the redirection of light that takes place when an electromagnetic (EM) incident light encounters an obstacle or non-homogeneity, such as a particle. When the EM photon interacts with the particle, it causes the particle to oscillate periodically with the same frequency as the incident photon [6].The oscillation results in a periodic separation of charge within the molecule, which is called an induced dipole moment. The oscillating induced dipole moment is manifest as a source of EM radiation.Using the scattering coefficient for glucose, measurements are based on the measurement of temporal changes of the scattering properties of a tissue, which is caused by dynamics of refractive index matching [7]. It can be used for both in vitro and in vivo measurements.The increase of the refractive index of the interstitial fluid decreases the relative refractive index of the scattering particles and, consequently, decreases the scattering coefficient [8].
1.2. Overview of Non-invasive Glucose Measurement Technologies
The most promising technologies used for glucose concentration measurements are NIR Spectroscopy diffuse transmittance, FIR Spectroscopy, Raman Spectroscopy, Polarimetry, Photo-acoustic Spectroscopy, Optical Coherent Tomography and NIR Diffuse Reflectance. Each method has features predictive of commercial viability, as well as, technical problems to overcome.NIR Spectroscopy Diffuse transmittance (absorption)Glucose produce one of the weakest NIR absorption signals per concentration [9], it is responsible for less than 0.1% of the NIR absorption in the body where water is the major absorbent component in the body [10]. Another disadvantage of this technique that the NIR spectroscopy absorbability, is also affected by the use of medication, blood haemoglobin levels, variation in the biological processes, hydration and nutrition, and the irregular pressure of the measuring head on the finger[10]. As a consequence, multivariate calibration methods have to be used [9].FIR SpectroscopyFIR Spectroscopy is the only optical based measurement that does not require an external energy source. The measurement is predicted by measuring thermal energy, and the thermal energy is then calculated by the Plank distribution function. This method has two main problems, the signal size of human thermal emission is very small, and the device needs to incorporate a cryogenically cooled infrared detector, which is inconvenient [10].Raman SpectroscopyRaman spectroscopy monitors fundamental vibrations. The use of Raman Spectroscopy compared to the NIR Spectroscopy exhibit less overlap, and it is less affected by the presence of water, since water has low Raman cross-section. However, the re-scattering and re-absorption of the light in the tissues makes the detection of the Raman signal difficult [9].PolarimetryThe linear polarization vector of light will rotate when the light is passed through a substance, and the rotation is proportional to the concentration of the substance. This method depends on the thickness of the layer transversed by light; the wavelength of light; temperature and the PH of the solvent. Therefore, the measurement must be obtained under standard conditions [9]. Another problem with this technique is that, the signal must be able to pass from the source through the body without total depolarization; therefore tissue thickness must not exceed 4mm [9]. This implies that the measurement is most probably taken at the aqueous humor. However there is a time lag of 30 min between blood glucose value and the aqueous humor signal [10].Photo-Acoustic Spectroscopy (PAS)Compared to the optical absorption techniques, the photo-acoustic methods offer higher detection sensitivity, as it is influenced by optical absorption coefficient; thermal expansion coefficient; specific heat and acoustic velocity [9].Optical Coherence Tomography (OCT)OCT is based on detection of back-scattered photon with an interferometer. The scanning mechanism in the reference arm enables the detection of photon of different depth in the sample. It has better spatial resolution than PA but a smaller imaging depth [9].The problem with OCT is that, OCT is only applicable under normal physiological conditions for the following reasons [9]:1. Several body osmolytes may change the refractive index mismatch between ISF and scattering centre in the tissue.2. OCT signal slope is dependent on tissue heterogeneity and motion artifacts.3. Substantial skin heating or cooling significantly changes the OCT slope.NIR Spectroscopy Diffuse reflectanceThe intensity of the reflectance depends on both the scattering and absorption coefficients [9]. NIR diffuse measurements performed on the finger and cuticle have shown good correlation with blood glucose, with only 10% of predictions not clinically acceptable. However, scattering coefficient shows a linear change as a function of temperature [9].This technology provides high clinical acceptability. It provide easier processing and signal acquisition than the OCT and the Raman Spectroscopy techniques. It is less affected by the physiological parameters of the human body than the OCT, polarmitery and NIR Spectroscopy diffuse transmittance. Therefore, this study suggests a reliable, painless and portable device for glucose measurement, by joining two Scattering Spectroscopy methods. The combining of two techniques is supposed to reduce the mean squared error of measurements and increase the reliability of the results [11].
2. Methodology
2.1. The Rayleigh Scattering Theory
In order to describe light scattering, the Stokes parameters [12] were used. These parameters give a full description of the light intensity and the degree and type of polarization of the light. The relation between the intensity and polarization in the strokes parameter is described below:S0 = Is = intensity of scattered light.S1 = Qs = polarization along the x and y axis.S2 = Us = polarization along a 45◦ and -45◦ axis.S3 = Vs = circular polarization on the x-y plane.The general relationship between the Stokes vectors for the incident light and the scattered light is given by the Mueller amplitude scattering matrix [12]: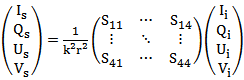 | (1) |
Two theories are frequently used to describe the scattering properties of human tissue; the Rayleigh and Mie scattering theories. Rayleigh scattering can be applied to particles of any shape which have sufficiently small size parameters. Mie scattering theory can be applied to spherical particles of any size, although for very large particles the time required for the calculations becomes prohibitive, with increasing problems of convergence and numerical accuracy. The Mueller matrix for Rayleigh scattering is described in equation (2).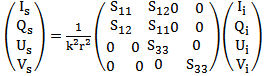 | (2) |
Where: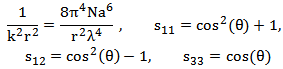 Therefore the intensity of scattered light (Is) can be calculated according to equation (3), where m is the relative refractive index of the particle, N is the density of scattering particles and a is the particle radius:
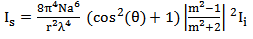 | (3) |
2.2. The Relation between Scattering Angle and Glucose Concentration
The magnitude of the effect of dissolved glucose upon optical properties in glucose solution has been seen to have four different effects. Two of them describe the modification in both the velocity of light and the scattering coefficient. The consequences affect the light intensity, modulation depth and phase shift, which are observed in multiple-scattering media [13]. For biological tissue it is hard to predict or estimate glucose concentration since tissue scattering is caused by a variety of substances and organelles. These different refractive indices have to be taken into account; assuming that only glucose induces a change in the refractive index of the medium [13].The technology used in this study is based on the direct effect of glucose on the scattering properties of the organ. Glucose decreases the mismatch in refractive index between scatterers and their surrounding media, leading to a smaller scattering coefficient and, consequently, a shorter optical path and a smaller scattering angle [14] shown in figure (1).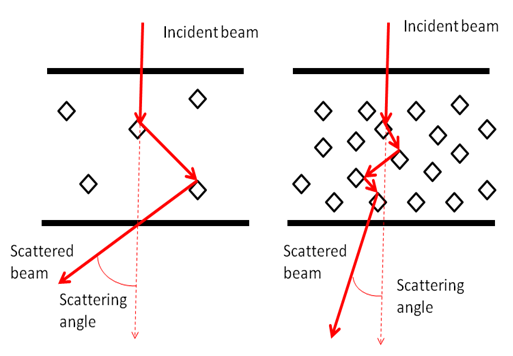 | Figure 1. The change in scattering angle due to the change in glucose concentration |
2.3. Glucose Measuring Approach
For a short pulse of light [5], the change in temperature is given by equation (4) | (4) |
 = temperature change due to light beam absorption (℃).
 = tissue density (gm cm-3).
  = heat capacity (J ℃-1 gm-1).
 = radiant exposure (J cm-2)Considering that
  is pre-determined where
 ,
,  is measured with a temperature sensor and a reasonable estimation of
  for human tissue [5], the attenuation coefficient
  can be calculated easily.The Beer-Lambert modified law states that, the attenuation in intensity between the incident beam
  and the final output beam
  through any matter (in the case of this study the matter refers to human tissue) is effected by both the scattering and the absorption coefficients
  and
and  of the tissue in addition to the path length d.
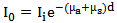 | (5) |
With the  already calculated using equation (4), the Beer-Lambert law can be rephrased considering
  is the intensity of scattered light.
 | (6) |
A linear position detector was used to calculate the average scattering angle, θ. The relative refraction index m in a tissue is the ratio between the refraction index of extracellular fluid and cellular membrane;  and
and  respectively [15].
 | (7) |
Substituting the values of  and θ in the Rayleigh equation, and rearranging the equation, the value of N can easily be calculated and glucose concentration equation (9) can be derived from experimental results.
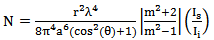 | (8) |
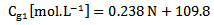 | (9) |
Glucose concentration is then measured using the direct relation with the scattering angle θ; where the increase in θ indicates a decrease in the glucose concentration and vice-versa. Using experimental results, the relation between the two was described by the equation (10).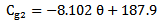 | (10) |
2.4. System Design
Figure (2) shows the designed prototype block diagram. A Near Infra-Red (NIR) source is placed above the measurement site, index finger; the NIR beam travels through the tissues creating a scattering pattern. A signal acquisition unit consisting of a linear position detector [16] was used to detect the scattering pattern of the NIR spectroscopy and the change in light intensity due to the interaction with human tissue. 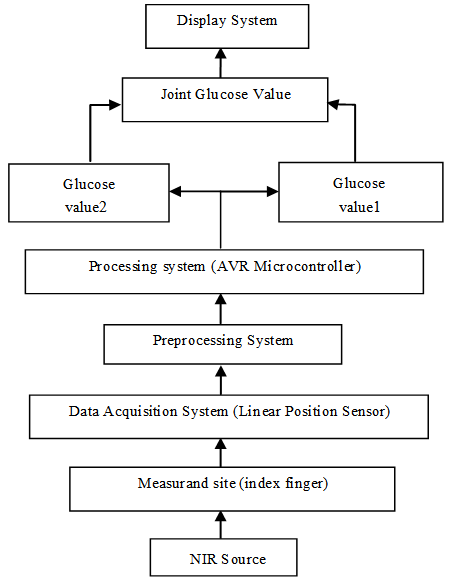 | Figure 2. The designed prototype block diagram |
The acquired signal was pre-processed and prepared to become a proper input for the microcontroller. An AVR microcontroller (ATmega16) was used to process the signal and calculate the equivalent glucose concentration using Rayleigh theory and Beer-Lambert law and the linear relation between glucose concentration and scattering angle.The final readings of glucose concentration were combined using the mean. The final results were then displayed on an LCD.The system design was simulated using PROTEUS 7.8i, and the software algorithm was built using CodeVisionAVR.
2.5. System Evaluation
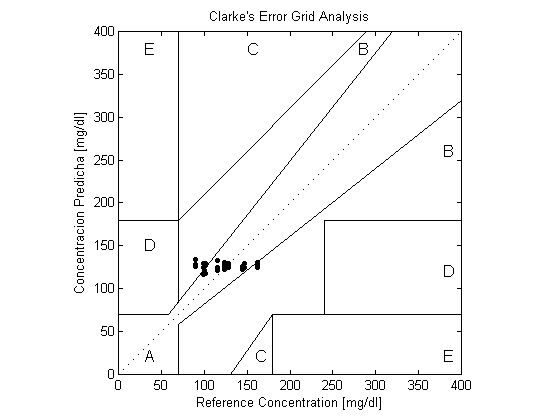
The prototype was tested on 55 volunteers in the age range of (20-30) years old (15% males, 85% females, and 22% diabetic). 20% of the readings were not considered in the evaluation of the prototype, since the linear position detector can detect scattering angles within the range of (-10◦ to 10◦), therefore the range of glucose concentration that can be measured using the Rayleigh theory and the linear relation is (106.8 to 187.9 mg/dl).The readings were evaluated against the invasive measurements of Omnitest® plus meter using the Clarke Error Grid Analysis (EGA). The Clarke error grid analysis was implemented using MATLAB 7.10. The Mean Squared Error (MSE) was calculated for each method as well.The mean of the two values of glucose concentration was evaluated as well using the EGA, and the MSE. The final results of the system were compared with other non-invasive measuring devices.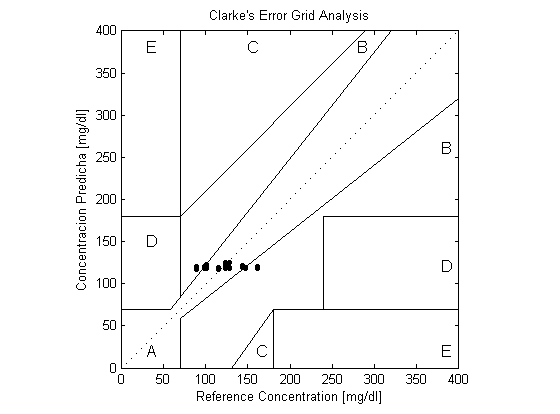 | Figure 3. Clarke Error Grid Analysis of the Rayleigh scattering results |
3. Results and Discussion
3.1. Scattering Spectroscopy Results
The Rayleigh scattering measurements produced better result compared to the linear relation results, with 72.7% of its readings falling into region A, 27.3% in region B and MSE equals (368.4). Using the mean to combine the two scattering based measurements, it was found that 59.1% of the result fell into region A, 40.9% into region B and the MSE was (398.7).As shown in table (1), the use of the mean did not increase the clinical accuracy of the measurement, as it reduced the number of readings falling into region A of the EGA. However, the MSE of the linear relation based measurement had been reduced significantly when combined with the Rayleigh based measurements.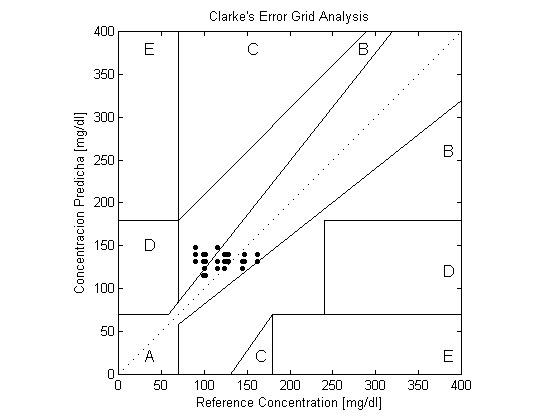 | Figure 4. Clarke Error Grid Analysis of the linear relation with scattering angle |
 | Figure 5. The Clarke Error Grid Analysis of the mean value of both scattering spectroscopic techniques |
| Table 1. Glucose Concentration Evaluation Results Using EGA and MSE |
| | | Clarke Error Grid Analysis | Mean Squared Error (MSE) | | Region A | Region B | | Rayleigh Scattering Theory | 72.7 | 27.3 | 368.3950 | | Linear equation between Scattering angle and glucose Concentration | 63.6 | 36.4 | 525.8483 | | The mean of the two values | 59.1 | 40.9 | 398.6916 |
|
|
3.2. Evaluation against Other Non-invasive Devices
Table (2) compares the results obtained during this study with the occlusion spectroscopy based device, Orsense NBM device [14]; the GlucoTrack device (that uses combination of three independent technologies: ultrasonic, electromagnetic, and thermal) [17]; and the joint Electrical-Optical device [11]. It is noticeable that the joint Electrical-Optical device produced the highest clinical accuracy compared to the four devices, due to its use of two independent glucose measuring techniques; consequently more reliable readings are produced.The prototype produces better clinical accuracy (region A) than the GlucoTrack Device, since the optical parameters are better correlated with glucose concentration than the physical parameters used in the GlucoTrack.However, when compared to The Orsense device, it was found that the Orsense device provide better clinical accuracy than the mean results; that is due to the use of both reflected and transmitted light, acquiring a dynamic signal and the use of multispectral sources [14]. Nevertheless, the results based on the Rayleigh scattering theory provided higher clinical accuracy versus the Occlusion Spectroscopy based device, that is due to the incorporation of the attenuation parameters and the temperature deviation during the measurement, while calculating the Rayleigh parameters. | Table 2. The Percentage of Measurements Falling into Region A and B (clinically acceptable) According to EGA, and The Reference Measuring Device used to evaluate each Device |
| | Evaluated Device | Clarke Error Grid Analysis | Reference Device | | Region A | Region B | | Mean Scattering Spectroscopy results | 65.9 | 34.1 | Omnitest® plus | | Rayleigh Theory based results | 72.7 | 27.3 | Omnitest® plus | | Orsense NBM Device | 69.7% | 25.7% | FreeStyle (Abbott Ltd.) | | GlucoTrack Device | 50% | 42% | HemoCue® (Glucose 201+). | | Joint Electrical-Optical Device | 77.86% | 22.14% | Accu-Check Sensor |
|
|
4. Conclusions
This study proposed a non-invasive measurement system for glucose concentration; using the Rayleigh scattering theory and the linear relation between scattering angle and glucose concentration. The scattering angle used in both methods was measured using a linear position detector.In order to produce a Rayleigh based glucose concentration, the temperature change during the measurement was calculated, and then the attenuation coefficient of the tissue was determined. The attenuation coefficient was applied into Beer-Lambert law in order to calculate the intensity of scattered NIR light,  . The
. The  and the Scattering angle θ were then used in the Rayleigh equation to calculate the density of glucose particles within the tissue, finally the equation relating the glucose density with glucose concentration was derived from experimental results.The linear equation relating glucose concentration with scattering angle was directly derived from experimental results. The mean value of the two scattering methods was calculated as well.The readings were evaluated against the Omnitest® plus invasive meter using the EGA and the value of the MSE. The Rayleigh scattering theory produced higher Clinical Accuracy (72.7% in region A) and smaller value of MSE (368.4) compared to the linear relation and the mean results of the two Scattering methods.The mean results produced 59.1% clinical accuracy, which is less than the two scattering methods separated. This can be explained by the assumption that each scattering method has a higher accuracy in a different range of glucose concentration values. Therefore, when combined they reduce each other's accuracy.The EGA results of the study were compared to other non-invasive devices. It was found that the optical measurements of glucose produced better clinical accuracy than the physical measurements. It was also found that the Rayleigh based measurement has more potentials of producing reliable glucose measurements than Occlusion Spectroscopy measurements, however its measurement can be further enhanced by combining it with another non-scattering based technique such as electrical impedance or PAS.
ACKNOWLEDGEMENTS
The deepest gratitude to Elbarbary Medical Company, the suppliers of B|Braun Omnitest® plus meters in Sudan, for providing the invasive device and all its supplement.The authors would also like to convey thanks to Dr. Yasin Hamdan and the School of Mechanical Engineering, Eng. Mohammed Yahiya and the Department of Biomedical Engineering, Alyaa Specialized Medical Centre and all their laser clinic staff.
References
| [1] | Mirza Azizul Hoqe et al. "Achievement of Awareness in a Diabetic Population", Journal of Medicine, vol 10, pp 7-10, 2009. |
| [2] | MurtadaN .Elbager, Mohammed A. Eltom et al. "A Population-Based Study of the Prevalence of Diabetes and Impaired Glucose Tolerance in Adults in Northern Sudan", Diabetes Care, Volume 19, Number 10, October 1996. |
| [3] | John L. Smith." The Pursuit of Noninvasive Glucose: “Hunting the Deceitful Turkey”, Biophotonic Journal, 2006. |
| [4] | Jurgen C. de Graaff et al. “Influence of Repetitive Finger Puncturing on Skin Perfusion and Capillary Blood Analysis in Patients with Diabetes Mellitus”, American Association for Clinical Chemistry, December 1st, 1999. |
| [5] | A.J. Welch, M.J.C. van Gemert, Optical-Thermal Response of Laser-Irradiated Tissue, 2nd edition, Springer Science and Business Media, 2011. |
| [6] | W. Hahn. "Light Scattering Theory", Department of Mechanical and Aerospace Engineering, University of Florida, July 2009. |
| [7] | Janet A. Tamada, PhD et. al., "Noninvasive Glucose Monitoring", American Medical Association, November 17, 1999—Vol 282, No. 19. |
| [8] | Alexey N. Bashkatov, Elina A. Genina, Valery V. Tuchin, "Handbook of Optical Sensing of Glucose", Chapter 19, Taylor & Francis Group, 2009. |
| [9] | Joseph Thomas Andrews et al. "Non-Invasive Glucose Monitoring Techniques: A review and current trends", Birla Institute of Technology, India, October, 2008. |
| [10] | David C. Klonoff "Noninvasive Blood Glucose Monitoring," Diabetes Care, Volume 20, Number 3, March, 1997. |
| [11] | E. Guevara and F.J. Gonz´alez."Joint optical-electrical technique for noninvasive glucose monitoring ", Revista Mexicana De Fi'sica, October 2010. |
| [12] | Pieter van der Zee. "Measurement and Modeling of the Optical Properties of Human Tissue in the Near Infrared", Doctor of Philosophy (Ph.D), University College of London, England, December, 1992. |
| [13] | Matthias Kohlt, Matthias Essenpreist and Mark Copet." The influence of glucose concentration upon the transport of light in tissue-simulating phantoms", Phys. Med. Biol., volume 40, pp 1267-1287, 1995. |
| [14] | Orna Amir et al. “Continuous noninvasive glucose monitoring technology based on occlusion spectroscopy," Journal of Diabetes Science and Technology, Volume 1, Issue 4, July 2007. |
| [15] | John S. Maier et al. "Possible Correlation between Blood Glucose Concentration and the reduced Scattering Coefficient of Tissue in the Near Infrared", Optic Letters, Vol. 19, No. 24, December, 1994. |
| [16] | Yen-Liang Yen et al. "Real-Time measurement of glucose concentration using position sensing detector," Nano/Micro Engineered and Molecular Systems (NEMS), 3rd IEEE International Conference, January 2008. |
| [17] | Ilana Harman-Boehm et al., "Noninvasive Glucose Monitoring: A Novel Approach," Journal of Diabetes Science and Technology, Volume 3, Issue 2, March 2009. |
 Abstract
 Reference
 Full-Text PDF
 Full-text HTML