-
Paper Information
- Previous Paper
- Paper Submission
-
Journal Information
- About This Journal
- Editorial Board
- Current Issue
- Archive
- Author Guidelines
- Contact Us
American Journal of Biomedical Engineering
p-ISSN: 2163-1050 e-ISSN: 2163-1077
2014; 4(1): 17-24
doi:10.5923/j.ajbe.20140401.03
Network Dynamics and Spontaneous Oscillations in a Developing Neuronal Culture
 Abstract
 Reference
 Full-Text PDF
 Full-text HTML
Jude PJ Savarraj1, Alan WL Chiu2
1Department of Biomedical Engineering, Louisiana Tech University, Ruston, LA, 71272, USA
2Applied Biology and Biomedical Engineering, Rose-Hulman Institute of Technology, Terre Haute, IN, 47803, USA
Correspondence to: Jude PJ Savarraj, Department of Biomedical Engineering, Louisiana Tech University, Ruston, LA, 71272, USA.
| Email: |  |
Copyright © 2012 Scientific & Academic Publishing. All Rights Reserved.
Biological neuronal networks are highly complex and studying such networks is important to understand its functionality. Neuronal networks are dynamic especially during the developmental stages of the brain where new neurons and synapses form and will continue through the lifespan of an organism. Developing networks in in vitro often self-organize into functional networks that produce spontaneously synchronizing oscillations even in the absence of external stimuli. The nature of network dynamics and its relationship to spontaneous oscillations and synchrony is not well-known. In this study this relationship is investigated. Neurons from newborn rat cortices were extracted and cultured over transparent microelectrode arrays. Neurons and neurite extensions were traced by imaging the culture at different stages of development. The anatomical connectivity was mathematically abstracted as a simple undirected graph. Simultaneously, multisite basal activities were recorded using microelectrodes and analyzed for the degree of synchrony. The networks were found to be neither random nor completely organized, but rather semi-random (also known as small-world networks). Spontaneous oscillations were observed once neurons began to form local connections. The network exhibited global synchronous oscillations when small-world network properties began to emerge. Our results indicate that the ability of networks to self-organize into a small-world network correlates with origin of sustained synchronous activity.
Keywords: Neuronal oscillations and synchronization, Small-world networks, Graph theory, Signal processing, Micro electrode arrays
Cite this paper: Jude PJ Savarraj, Alan WL Chiu, Network Dynamics and Spontaneous Oscillations in a Developing Neuronal Culture, American Journal of Biomedical Engineering, Vol. 4 No. 1, 2014, pp. 17-24. doi: 10.5923/j.ajbe.20140401.03.
Article Outline
1. Introduction
- The mammalian brain is composed of billions of neurons each making thousands of connections to each other via synapses. Neurons receive and transmit information via dendrites and axons. Neurons and synapses form an intricate network that is responsible for the information processing capacity of the brain. The underlying anatomical structure of the nervous system has been studied since the beginning of last century [1]. A connectome of an organism is defined as the mapping of the organism’s neuronal connections. It incorporates information on various types of neurons, the number and position of synapses, synaptic weight and the direction of connectivity. Connectomics is the discipline that involves mapping connectomes of different species. Caenorhabditis elegans is currently the only organism whose complete connectome is available [2]. Due to technological constraints, research in connectomics is limited to small neuronal populations and organisms. However considerable progress is underway in the field of functional connectomics, where, rather than anatomical connectivity, activity-related maps are studied [3]. The mathematical analysis of neuronal networks requires anatomical connectivity information of neurons and their extensions. Graph theory is the branch of mathematics used for the analysis of such networks. Neurons and neurite extensions are represented as nodes and edges. Once the network is quantified, it can be subjected to further analysis. Networks are ubiquitous in nature and are generally classified as regular-networks, where ideally each node in the network has same number of edges, or random-networks, where the edges between nodes are defined by a probabilistic distribution [4]. However, most real-world networks, including neuronal networks, are neither regular nor random, but fall in-between. These networks are called small-world networks with shared properties of both regular and random networks [5] [6].One way to quantify and compare network functionality is through the analysis of synchronization. Synchronization is defined as simultaneous behaviour and has been observed in the physical and biological systems [7]. There are several examples of synchrony in the nervous system [8]. The first documented instance of synchronization in the human brain was in electroencephalography (EEG) [9] activity which was a result of simultaneous activity of millions of neurons. Neuronal synchronization plays an important role during various behavioural states of the organism. For instance a small network of neurons called central pattern generators, found mostly in the spinal cord, produce rhythmic behaviour even in the absence of stimuli and sensory feedback [10]. Rhythmic behaviour have also been observed in brain regions responsible for working memory and long-term memory [11], episodic memory [12], sleep [13], resting states [14], information processing and learning [15], and pattern recognition [16]. Oscillations also shape the development of neuronal circuitry during neuronal embryogenesis [17]. It plays an important role in the shaping of visual pathways [18], cortical circuits [19], embryonic cells and hippocampal circuits [20]. Disruptions in synchronous behaviour are associated with number of diseases. Epilepsy is a classic example of abnormal synchronization and is attributed to a number of factors [21]. Alzeimer’s disease [22], ADHD [23], bipolar disorder [24] are few diseases that are also associated with abnormal synchronization. While much work has focussed on the functional aspects of neural synchrony, the factors responsible for the origin of synchrony are poorly understood. Understanding the mechanisms supporting neuronal synchrony may be essential for the development of treatment options for disorders associated with disruption in synchrony.In this study, the correlation between anatomical connectivity and function in developing neuronal networks is investigated. Anatomical connectivity information was traced and multisite recordings were simultaneously obtained. Since an in vivo model setup is not possible due to practical constraints, a neuronal culture in vitro model is employed. It has been reported that dissociated neuronal tissue can self-organize into functional units that are capable of producing spontaneous electrical activity [25]. Neurons explanted from new born rat pups are cultured on transparent dishes embedded with microelectrodes. Fluctuations in extracellular potential at multiple locations are measured. After a viable network is established, neurons and neurites are traced manually from high resolution images at different regions of interest from three to nine Day in Vitro (DIV) of development. Multisite recordings were obtained during the same period. By employing certain assumptions, the network is represented as a simple undirected graph. Data from multisite recordings were analysed to find correlations between structure and function.
2. Materials and Methods
2.1. Experimental Setup and Hardware
- A microelectrode array (MEA) is an 8-by-8 grid of microelectrodes embedded within a glass substrate that is conducive to neuronal growth. It is used in studies that require monitoring of local field potential and simultaneous imaging. The diameter of each electrode is 30µm with an inter-electrode distance of 200 µm. The recording area is surrounded by a glass well within which neuronal cells are cultured. Local field potentials from electrodes are transferred to the amplification stage of the hardware via contact pads at the sides of the dish (Figure 1). Cortices were explanted from 1-2 day old Sprague Dawley rats by cervical dislocation and placed in 10ml of basal media immediately after extraction. Composition of basal media is as follows; fetal bovine serum (25 ml), horse serum (25 ml), glucose solution in deionized water (125mg/ml, 1.25ml), glutamine in sterile deionized water (20 mg/ml, 1.25 ml), penicillin-streptomycin solution (1.25 ml), ham’s F12 media (98 ml) and basal media eagle (98.25 ml). The protocol was approved by the Institutional Animal Care and USE committee (IACUC) at Louisiana Tech University where the experiments were performed. After removal of meninges, cells were mechanically dissociated by titration with trypsin and ethylenediaminetetraacetic acid (EDTA). The number of viable cells in the extract is determined by a hemocytometer count and the cells required for the appropriate plating cell density is estimated.
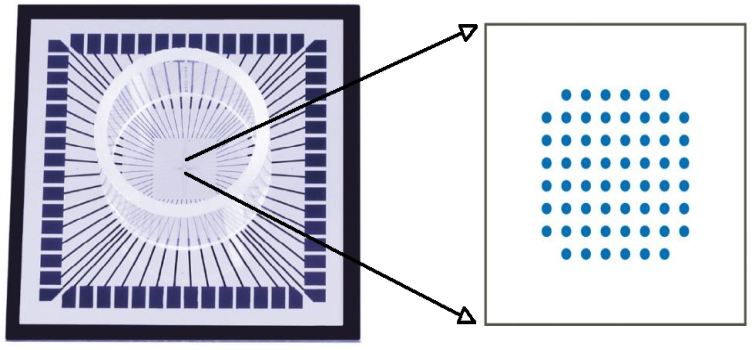 | Figure 1. Schmatic layout of a MEA recording dish.It is a 8-by-8 grid of TiN electrodes surrounded by a glass-ring within which the cells were cultured. The contact pads are seen at the edge of the dish. Simultaneous imaging and recording is possible using MEAs |
2.2. Graphical Abstraction
- A small section of the culture network (~ 800 µm by 400µm) was chosen for imaging purposes. Multiple bright-field microscopic images (40x magnification) of the section were taken and were combined to form a montage. Presence of healthy neuronal populations, without cellular debris obstruction, in the electrode vicinity was an important criterion for choosing the region. Imaging of the same region was performed from third day in vitro (DIV 3) to ninth day in vitro (DIV 9). Neurons were distinguished from glial cells by their irregular shape and neurite extensions. Since individual synapses cannot be seen at this magnification, it is assumed that two neurons have a link if they have intersecting neurites. Extracted anatomical structural information is abstracted mathematically as a graph with assumptions listed below. A graph, G = (V,E), where ‘V’ is the node set and ‘E’ denotes an edge set. An example of a simple undirected graph is shown in Figure 2.
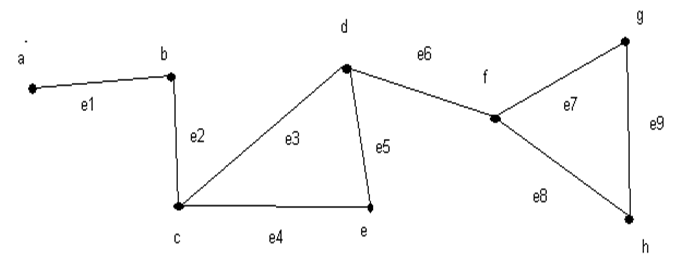 | Figure 2. Illustration of a simple undirected graph with nodes and edges. The node set E, is given by E={a,b,c,d,e,f,g,h} and the edge set is given by V={e1,e2,e3,e4,e5,e6,e7,e8,e9} |
 | (1) |
 | (2) |
2.3. Measures of Synchrony
- Multi-site basal activity recording were obtained from regions of the culture where cell density was most optimal for imaging. Daily recordings were obtained from DIV 3 to DIV 9. After DIV 9, the quality of the culture begins to deteriorate. Correlation coefficient and cross correlation analysis were measures that were used to calculate the degree of synchrony between all possible electrode pairs. Correlation coefficient (CC):CC between any two random variables X and Y is defined as the ratio of products to products of their standard deviation.
 Where σX and σY are the standard deviations of X and Y respectively, μX and μY are the mean values. Cross-correlation: Measure of similarity between two signals as of function of the time lag between them is the cross-correlation between the two signals. It is mathematically given by,
  Where, f and g are discrete signals and ‘m’ is the time lag of the sample interval term.
3. Results
3.1. Network Dynamics
- Isolated and infrequent spontaneous electrical activity was observed as early as DIV 3 when neurons began to extend neurites to neighbouring neurons. This activity persisted through all days of recording. Small connected clusters began to emerge by DIV 6 (Figure 3). Graph isomorphism of traced networks during different stages in development is shown (Figure 4). Individual neurons that are isolated from a cluster either migrate towards a nearby cluster and establish connectivity with it or perish. Smaller clusters sometimes join together to form larger clusters. By DIV 9, the clusters are tightly connected to each other, facilitating the propagation of electrical activity that spans throughout the network. This stage of development was also characterized by strong correlated activity across more than two electrodes.
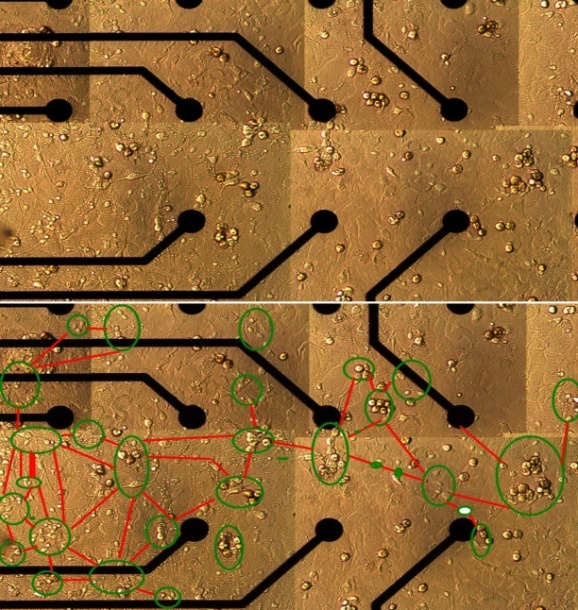 | Figure 3. Representation of a small-subsection of the electrode grid. It is overlaid with the traced network. The growth of a neuronal network over the embedded is clearly seen. The green circles represent groups of neurons with tight local connectivity. The red lines are traces of neurite extensions between clusters of neurons |
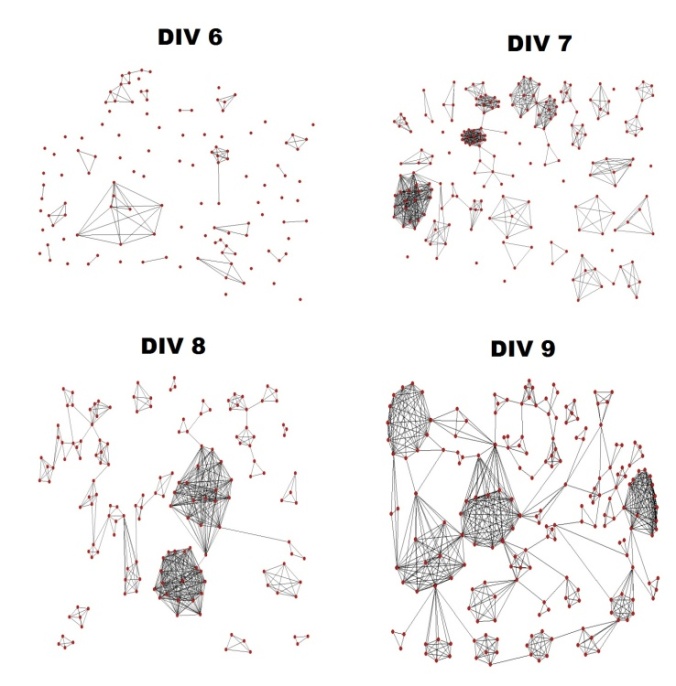 | Figure 4. Graphical representation of culture networks from DIV 6 to DIV 9. Clusters increased size by absorbing unconnected neurons in the vicinity. Clusters that were formed earlier during development had the tendency to grow into larger than others. By DIV 8 and DIV 9, only a small portion of the dish are unoccupied by neuron.. Networks were drawn using the graph analysis and visualization software Pajek (Batagelj et al, 2003) |
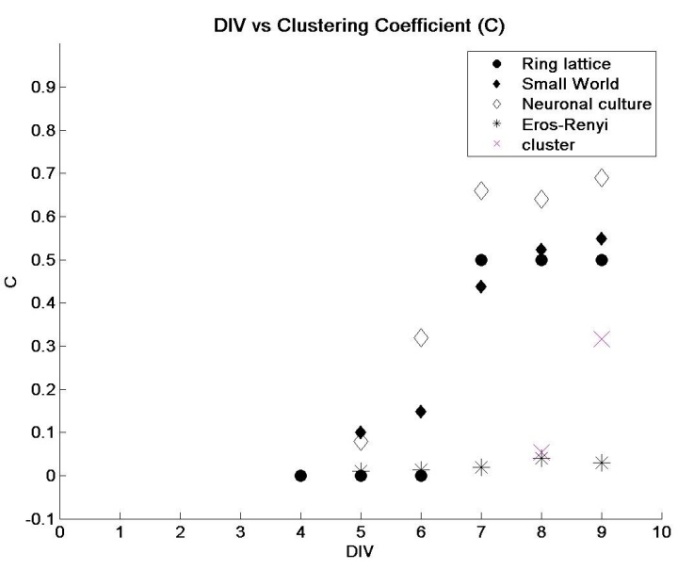 | Figure 5. The clustering coefficient of the network is compared with different network models during different days in vitro. Neural cultures networks have a much higher local CC in comparison to other models CC of the clusters were much lower |
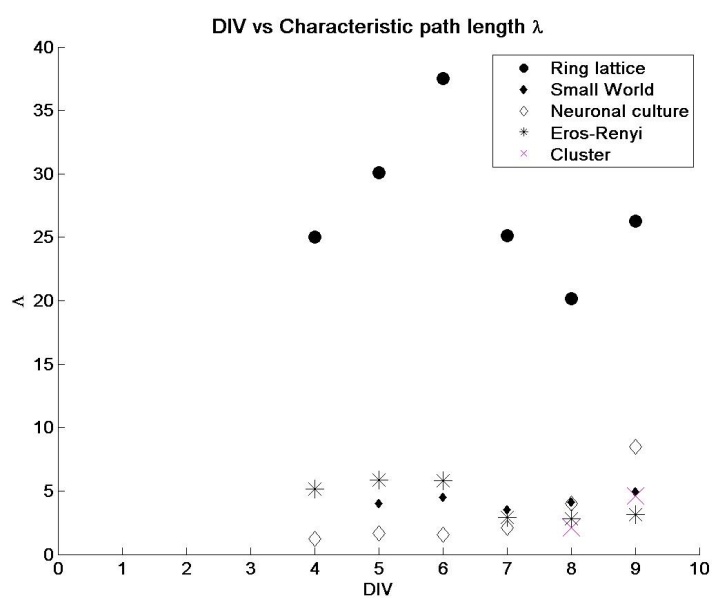 | Figure 6. The characteristic path length of the network is compared with different network models during different days in vitro. Neural culture networks have a much lower value. CC of the clusters was comparable to that of random networks |
3.2. Functional Results
- Spontaneous spiking activity was changes in the extracellular potential due to the activity of single neurons. The emergence of spikes is shown in Figure 7. The increase is spiking phenomenon at this stage of development coincides with an increase in the overall cluster index of the network i.e., the local connectivity.
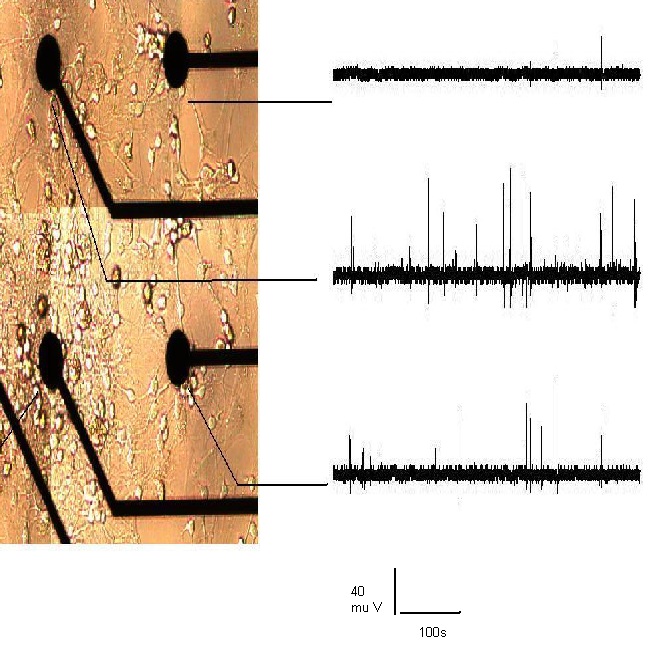 | Figure 7. Spontaneous activity began to emerge as early as DIV 3. Shown above is the activity from a DIV 6 recording. Clusters of neurons are seen around the electrode vicinity. Neurons are often irregular in shape with neurite extensions and astrocytes are rounder with dark edges. By DIV 6, neurons are in the process of forming tightly packed clusters |
4. Discussion
- Metabolic network of E.Coli [27], nervous system of caenorhabditis elegans nematode worm [2], social networks and computer routing networks [6] are some examples of complex networks in the physical and real world. The interactions between the network’s elements gives rise to rich dynamics that determines the behavior of the system. Networks were typically modeled as either regular or random networks until it were discovered that most real world networks are neither regular nor random, but fall in-between. They are classified as small-world networks. Dissociated neurons in culture organize themselves into networks that produce spontaneous and synchronized oscillations [28]. They retain several functional properties of their intact in vivo counterparts [29]. However, the changes in network characteristics that correlate with the emergence of synchronous activity are unclear. In this study, neuronal network evolution during development was quantified and transitions correlating with synchronized activity were investigated. Network characteristics:After plating neurons on MEA dishes, neurites began to emerge within 24 hours. At this stage, neurons appear to be evenly distributed across the MEA dish surface without preferential attachment to any particular region. By DIV 3, neurons extended their neurites to neighboring neurons. During the same period, isolated low-frequency (less than two events per minute) spiking activity was observed. Since spiking activity was absent prior to the development of neurite extensions, it is unlikely for a set of isolated neurons to produce endogenous activity. Neuronal growth factors and signaling molecules play an important role in how neurites connect with other neurons [30]. By DIV 5, the emergence of clusters of neurons was observed (figure 4). Clusters are a small network of tightly packed neurons. At this stage of development, spatially isolated neurons and smaller clusters (~ three to four neurons per cluster) either migrated towards larger clusters or perished (Figure 4). After DIV5 (Figure 5), a rise in CI was observed and by DIV9 it was similar to that of regular-networks (exact values are tabulated in Table 1). Similarly, as the network self-organized, a decrease in the characteristic path length (Figure 6) was noticed, and the numbers were similar to that of a random network (Table 2). By DIV 9, the network also began producing synchronized oscillations over a wider area. We hypothesize that for wide-spread synchronous oscillations; the activity must originate at a cluster near an electrode and spread to other regions within a short span of time. A network that has a high CI and low λ may facilitate this hypothesis. The anatomical connectivity of the culture follows a small-world pattern of connectivity [31]. After the initial phase of activity that was characterized by isolated spiking events, the activity became more sustained but with poor correlation (Figure 8, DIV 7). The average correlation coefficient of the network was 0.3247 at DIV 7, followed by a three-fold rise by DIV8 and DIV9 (figure 8, DIV 8-9). During the same period there was a rise in the CI and lowering of λ. This supports the earlier hypothesis that the evolution to a small-world network characteristic makes the process of sustained oscillations easier.
| |||||||||||||||||||||||||||||||||||||||||||||||||||||||||||
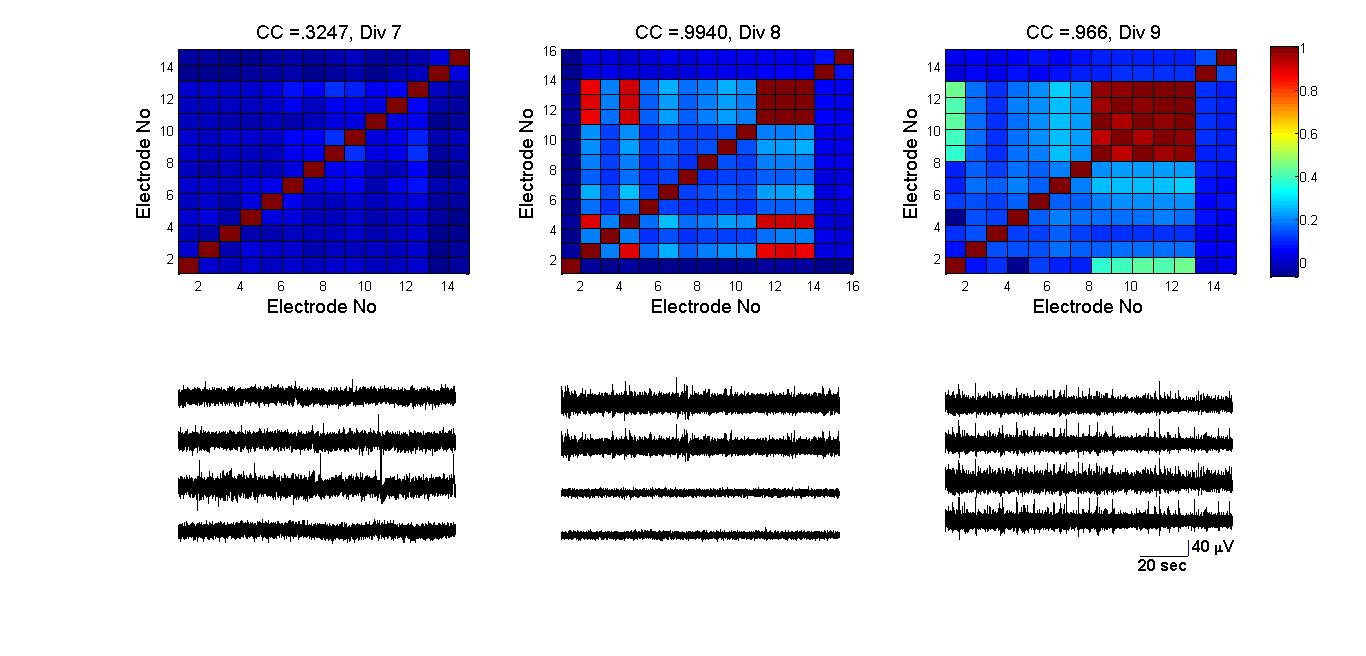 | Figure 8. Basal activity from four most active electrodes and the ccorrelation coefficient map for all electrode pairs from DIV 7 to DIV 9. The color bar represents the Correlation coefficient value (dimensionless unit). There was an almost 3-fold rise in average CC (0.32 to 0.96) in the four most active electrodes. The amplitude of the oscillations varied from 20 µv to 40µv and lasted for hundreds of seconds. During DIV 8 and DIV 9, there was an increase in the number of tightly connected clusters (figure 4) suggesting that increase in cluster index contribute to an increase level of synchrony in the culture |
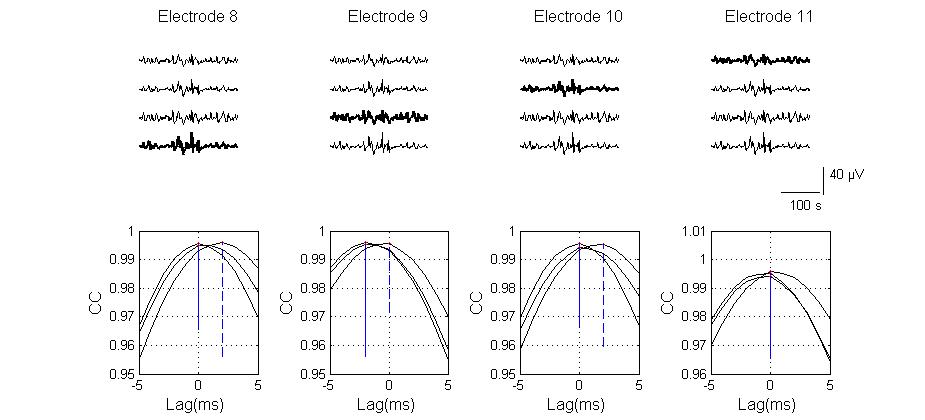 | Figure 9. Cross-correlation function of a small sample of signals across various electrodes is depicted. (Top) a segment of DIV 9 basal synchronized activities from the four most active electrodes are plotted. The highlighted signal is the electrode with respect to which the correlation function is calculated. (Bottom) plot electrode pair-wise cross-correlation (CC) of the four signals as a function of time shift .The maximum activity time lag between synchronizing electrodes is < 5 ms indication a strong synaptic-mediation of activity and existence of short path lengths between electrodes |
5. Conclusions
- It appears that dissociated neuronal culture self-organize into networks with small-world properties. Such properties may be important for the origin and persistence of synchronized oscillations. Theoretical studies that involve building computational models of neuronal sub-systems can benefit from such anatomical connectivity information. Simultaneous investigation of network dynamics and function could help understand a variety of neurological diseases such as tumor, Alzheimer’s, epilepsy and autism. Diseases can be modeled as disruption in networks and such models would be useful in developing treatments.
References
| [1] | R Cajal. Studies on Vertebrate Neurogenesis. Thomas (Springfield) 1960. |
| [2] | J. G. White, E. Southgate, J. N. Thomson, and S. Brenner. The Structure of the Nervous System of the Nematode Caenorhabditis elegans, Philos. Trans. R. Soc. Lond. B Biol. Sci., 314(1165), pp. 1–340, Nov 1986. |
| [3] | O. Sporns, D. R. Chialvo, M. Kaiser, and C. C. Hilgetag, Organization, development and function of complex brain networks. Trends Cogn. Sci., 8,(9), pp. 418–425, Sep 2004. |
| [4] | D. J. Watts and S. H. Strogatz, Collective dynamics of ‘small-world’ networks, Nature, 393(6684),pp. 440–442, Jun 1998. |
| [5] | T.I Netoff, R. Clewley, S. Arno, T Keck, J.A.White, Epilepsy in Small-World Networks. The Journal of Neuroscience, 24(37):8075-8083, Sep 2004. |
| [6] | S. H. Strogatz and I. Stewart. Coupled oscillators and biological synchronization. Sci. Am. 269(6),pp. 102–109, Dec 1993. |
| [7] | G. Buzsáki, Rhythms of the brain. Oxford University Press US, 2006. |
| [8] | M. Tudor, L. Tudor, and K. I. Tudor. Hans Berger (1873-1941)--the history of electroencephalography, Acta Medica Croat. C̆asopis Hravatske Akad. Med. Znan., 59(4), pp. 307–313, 2005. |
| [9] | Hooper. Central pattern generators. Curr. Biol. CB, 10( 5), p. R176, Mar. 2000. |
| [10] | J. Fell and N. Axmacher.The role of phase synchronization in memory processes. Nat. Rev. Neurosci., 12(2) pp. 105–118, Feb. 2011. |
| [11] | C. J. Stam, Nonlinear dynamical analysis of EEG and MEG: review of an emerging field. Clin Neurophysiol, 116(10), pp. 2266–301, 2005. |
| [12] | W. Dement and N. Kleitman, Cyclic variations in EEG during sleep and their relation to eye movements, body motility, and dreaming Electroencephalogr. Clin. Neurophysiol., 9(4), pp. 673–690, Nov. 1957. |
| [13] | J. Cabral, E. Hugues, O. Sporns, and G. Deco, Role of local network oscillations in resting-state functional connectivity, NeuroImage, vol. 57, no. 1, pp. 130–139, Jul. 2011. |
| [14] | W. Singer, Synchronization of Cortical Activity and its Putative Role in Information Processing and Learning, Annu. Rev. Physiol., 55(1), pp. 349–374, 1993. |
| [15] | E. Başar and B. Güntekin, A review of brain oscillations in cognitive disorders and the role of neurotransmitters. Brain Res., 1235(172–193), Oct. 2008. |
| [16] | M. Nokia, H. sisti, and monica choksi. PLOS ONE: Learning to Learn: Theta Oscillations Predict New Learning, which Enhances Related Learning and Neurogenesis. DOI: !0.1371/journal.pone.0031375. |
| [17] | A. A. Penn and C. J. Shatz. Brain Waves and Brain Wiring: The Role of Endogenous and Sensory-Driven Neural Activity in Development, Pediatr. Res., 45(4), Part 1 of 2, pp. 447–458, Apr. 1999. |
| [18] | P. J. Uhlhaas, F. Roux, E. Rodriguez, A. Rotarska-Jagiela, and W. Singer. Neural synchrony and the development of cortical networks, Trends Cogn. Sci., 14(2), pp. 72–80, Feb. 2010. |
| [19] | N. C. Spitzer. Spontaneous activity: functions of calcium transients in neuronal differentiation, Perspect. Dev. Neurobiol., 2(4), pp. 379–386, 1995. |
| [20] | Y. Ben-Ari, Developing networks play a similar melody, Trends Neurosci., 24(6), pp. 353–360, Jun. 2001. |
| [21] | R. S. Fisher, W. van E. Boas, W. Blume, C. Elger, P. Genton, P. Lee, and J. Engel. Epileptic Seizures and Epilepsy: Definitions Proposed by the International League Against Epilepsy (ILAE) and the International Bureau for Epilepsy (IBE), Epilepsia, 46(4), pp. 470–472, 2005. |
| [22] | G. G. Yener, B. Güntekin, A. Oniz, and E. Başar, Increased frontal phase-locking of event-related theta oscillations in Alzheimer patients treated with cholinesterase inhibitors, Int. J. Psychophysiol. Off. J. Int. Organ. Psychophysiol., 64(1), pp. 46–52, Apr. 2007. |
| [23] | J. Yordanova, T. Banaschewski, V. Kolev, W. Woerner, and A. Rothenberger. Abnormal early stages of task stimulus processing in children with attention-deficit hyperactivity disorder--evidence from event-related gamma oscillations, Clin. Neurophysiol. Off. J. Int. Fed. Clin. Neurophysiol., 112(6), pp. 1096–1108, Jun. 2001. |
| [24] | A. J. Levinson, L. T. Young, P. B. Fitzgerald, and Z. J. Daskalakis. Cortical inhibitory dysfunction in bipolar disorder: a study using transcranial magnetic stimulation, J. Clin. Psychopharmacol., 27(5), pp. 493–497, Oct. 2007. |
| [25] | R. Segev, M. Benveniste, Y. Shapira, and E. Ben-Jacob. Formation of electrically active clusterized neural networks, Phys. Rev. Lett., 90(16), p. 168101, Apr. 2003. |
| [26] | E. S. Vizi, J. P. Kiss, and B. Lendvai, Nonsynaptic communication in the central nervous system, Neurochem. Int., 45(4), pp. 443–451, Sep. 2004. |
| [27] | E. Ravasz, A. L. Somera, D. A. Mongru, Z. N. Oltvai, and A.-L. Barabási. Hierarchical Organization of Modularity in Metabolic Networks, Science, 297 (5586), pp. 1551–1555, Aug. 2002. |
| [28] | “Individual neurons dissociated from rat suprachiasmatic nucleus express independently phased circadian firing rhythms,” Neuron, 14(4), pp. 697–706, Apr. 1995. |
| [29] | M. E. Ruaro, P. Bonifazi, and V. Torre. Toward the neurocomputer: image Processing and pattern recognition with neuronal cultures, IEEE Trans. Biomed. Eng., 52(3), pp. 371–383, 2005. |
| [30] | B. H. Vanmali, E. V. Romanova, M. C. Messner, M. Singh, J. Maruniak, J. Sweedler, and M. D. Kirk. Endogenous neurotrophic factors enhance neurite growth by bag cell neurons of Aplysia, J. Neurobiol., 56(1), pp. 78–93, 2003. |
| [31] | P. Massobrio and V. Pasquale. Concurrent scale-free and small-world networks support criticality in cortical ensembles, BCM Neuroscience, 14(1) p1. August 2013 . |
| [32] | N. Masuda and K. Aihara. Global and local synchrony of coupled neurons in small-world networks, Biol. Cybern., 90(4), pp. 302–309, Apr. 2004. |