-
Paper Information
- Paper Submission
-
Journal Information
- About This Journal
- Editorial Board
- Current Issue
- Archive
- Author Guidelines
- Contact Us
American Journal of Biomedical Engineering
p-ISSN: 2163-1050 e-ISSN: 2163-1077
2014; 4(1): 1-9
doi:10.5923/j.ajbe.20140401.01
Foot Biometrics: Gender Differences in Plantar Pressure Distribution in Standing Position
 Abstract
 Reference
 Full-Text PDF
 Full-text HTML
Olfat D. Kandil1, 2, Shimaa N. Aboelazm2, 3, Mai S. Mabrouk2, 4
1College of Physical Therapy, Biomechanics
2Misr University for Science and Technology (MUST University)
3College of Physical ScienceTherapy, Basic
4Faculty of Engineering, Biomedical Engineering
Correspondence to: Mai S. Mabrouk, Misr University for Science and Technology (MUST University).
| Email: |  |
Copyright © 2012 Scientific & Academic Publishing. All Rights Reserved.
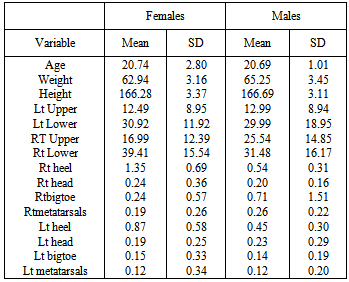
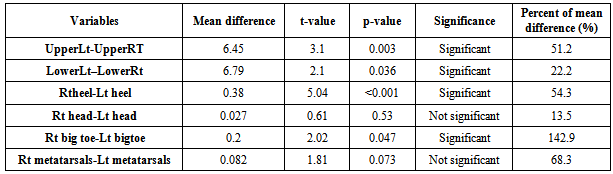
Measurement of foot pressure distribution is clinically useful because it can identify anatomical foot deformities, guide the diagnosis and treatment of gait disorders and falls, as well leads to strategies for preventing pressure ulcers in diabetes. This study was conducted to investigate the differences in plantar pressure distribution in normal subjects at four points during symmetrical standing position. The peak plantar pressure was measured below four points of each foot (big toe, lateral aspect of the foot, head of first metatarsal and mid heel) in male and female subjects. Results revealed that there were significant difference between the two groups at the level of mid heel, big toe, and head of the first metatarsal, while there was no significant difference at the level of metatarsal heads. Statistical t-test was used to compare plantar pressure distribution between the dominant and non-dominant limbs in each group. The test results indicated that upper limb anthropometry is significantly different between females and males with p-value of 0.025. Mean value of males (25.54) is higher than females (16.99). Left heel pressure is significantly different between females and males with p-value of 0.008. Mean value of females (0.87) is higher than males (0.45). Right heel planter pressure is highly significantly different between females and males with p-value < 0.001. Mean of females (1.35) is higher than males (0.54), whereas all other variables are not significantly different between females and males. Load asymmetries during quiet standing has not received much research attention, they may greatly extend our understanding of the upright stance stability control. It seems that limb load asymmetry factor may serve as a vertical measure of postural stability and thus it can be used for early diagnostics of the age related decline in balance control.
Keywords: Planter pressure, Gender, Anthropometry, Biomechanics, Foot biometrics
Cite this paper: Olfat D. Kandil, Shimaa N. Aboelazm, Mai S. Mabrouk, Foot Biometrics: Gender Differences in Plantar Pressure Distribution in Standing Position, American Journal of Biomedical Engineering, Vol. 4 No. 1, 2014, pp. 1-9. doi: 10.5923/j.ajbe.20140401.01.
Article Outline
1. Introduction
- The foot is one of the most important weight bearing and shock absorbing structures in the human body during various activities as walking, running, and jumping[2][20]. It has been pointed out by many researchers that the biomechanical factors play an important role on the etiology, treatment, and prevention of many foot disorders[5]. Therefore, the need to understanding the biomechanics associated with the normal foot before any foot orthosis or surgical intervention can be applied is clear.Pressure is defined as force per unit area. When a solid object at rest on a surface is considered, as someone standing with both feet on the floor, it is easy to see that the pressure between the shoe and the floor is the weight of the person divided by the area of his /her shoes in contact with the floor. Making the area of contact with the ground smaller will increase the local pressure[9].The measurement of pressure can be extremely valuable in assessment and monitoring the effects of treatment. Pressure of the foot on the floor can be measured by a flat device in the shoe, known as a limb load monitor. This is useful for the assessment of load on the lower limb in gait re-education and assessment. The force plate can also be used to measure pressure in static condition[10].Mueller.,[18] mentioned that pressure is a form of mechanical stress, which is equal to the magnitude of the force-applied perpendicular to a specific surface area. However, pressure is critical in variable orthotic, prosthetic and footwear design, because there is good evidence linking high pressures from ill-fitting orthotics, prosthetic and footwear can cause pain to people provided that proper evaluation of pressures is done.In addition, Brike et al., (2000), mentioned that sensory loss and high foot pressure have been shown prospectively to be highly predictive of ulceration. Studies have shown that plantar ulceration develops in the neuropathic foot over areas of high pressure. One of the most frustrating and challenging problems that faces the rehabilitation professionals today is the management of pressure ulcers and skin breakdown. Although they are thought to be preventable, they remain a frequent complication of disability, aging and illness. Direct medical costs, morbidity, mortality, social costs and the personal impact of pressure ulcers are all discouraging[28].Measurement of foot pressure distribution is clinically useful because it can identify anatomical foot deformities [11], guide the diagnosis and treatment of gait disorders and falls, as well lead to strategies for preventing pressure ulcers in diabetes. Thus the approach to treatment and relief of symptoms is often better understood owing to the recent scientific advances in both measurement and theoretical methodology[22]. The purposes of this study are to determine the difference between male and female concerning plantar pressure distribution in normal subjects, determine the levels of pressure distribution and its values at lateral aspect, mid heel, first metatarsal head and big toe and determine if there is relation between anthropometric measures of upper and lower extremities and the determined pressure at the foot.
2. Related Work
- During standing on level ground, the heads of the metatarsal and the calcaneus are in the same horizontal plane. The distribution of body weight through the foot depends on the shape of the arch and the location of the line of gravity at a given moment. In bilateral stance each talus receives 50 percent of the body weight; in unilateral stance, the weight-bearing talus receives 100 percent of the superimposed body weight. In static unilateral or bilateral stance, 50 percent of the weight received by the talus passes through the posterior subtalar articulation to the calcaneus, and 50 percent passes anteriorly to the forefoot,[9].The body weight, of the head, arm, and trunk transmitted through the lower limb, is applied through the ankle to the posterior part of the foot at the level of the trochlear surface of the talus that is considered as distributer. From there the forces are distributed in three directions, towards the supports of the vault: (A) towards the anterior and medial support via the neck of the talus and the anterior buttress of the medial arch; (B) towards the anterior and lateral support via the head of the talus, the sustentaculumtali of the calcaneus and the anterior buttress of the lateral arch; (C) towards the posterior support via the body of the talus, the subtalar joint, and the body of the calcaneus (the bony trabeculae underlying the superior articular surface) i.e. through the common posterior buttress of the medial and lateral arches as shown in Fig. (1)[12].
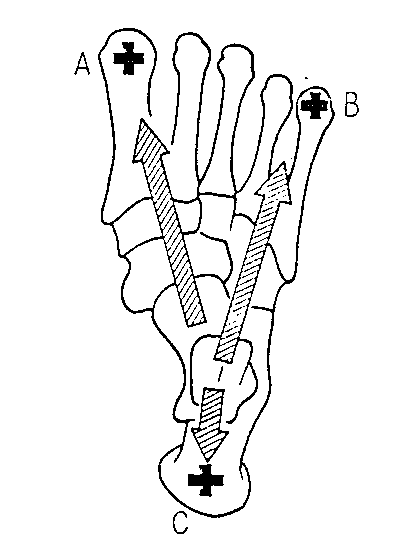 | Figure (1). Distribution of forces on the foot in three directions, towards the medial arch (A), towards the lateral arch (B), and (C) towards the posterior support[12] |
3. Materials and Methods
3.1. Experimental Setup
- This study was conducted to investigate the effect of gender on plantar pressure distribution in normal subjects and relate the determined values on different points with anthropometric measures. Sixty five randomly selected subjects of both sexes participated in the study with age ranged between 18 and 30 with mean age (20.73±2.48) years. All subjects were examined for weight and height to be sure of normal range of body mass index and were divided into male group and female group. Subjects' heights ranged from 165-175cm with mean height (166.38±3.29). Subjects' weight ranged from 60-70kg with mean weight (63.50±3.36) kg. A foot-Scan plate system was used to measure percentage of plantar pressure distribution over dominant and non-dominant foot exclusively. Percentage of peak pressure was measured under the areas, big toe, head of first metatarsal, lateral aspect of the foot and mid heel[1]. All subjects have no history of musculoskeletal, neuromuscular, lymphatic, vascular, or metabolic disorders.
3.2. Instrumentation
- The RS (Resistive sensor) foot scan force plate system was used to measure the percentage of peak pressure of body weight under 8 areas of the feet. The system composed of a force plate connected with a long cable connection to a laptop as shown in Fig. (2). Foot scan software can be operated using the mouse and/or keyboard. The system was stable on the ground and automatically calibrated having only the weight of the pressure plate. The plate was completely supported by the underlying concrete structure in order not to bend and damage the plate during measurement. The system offered full details color-coded printout of amount and percentage peak pressure under selected areas of the foot, represented by bar graphs. Also, RTZ-120; a health scale (German) was used to measure subject's weight and was adapted to measure the height and a tape measurement was used for upper and lower limb length measurements.
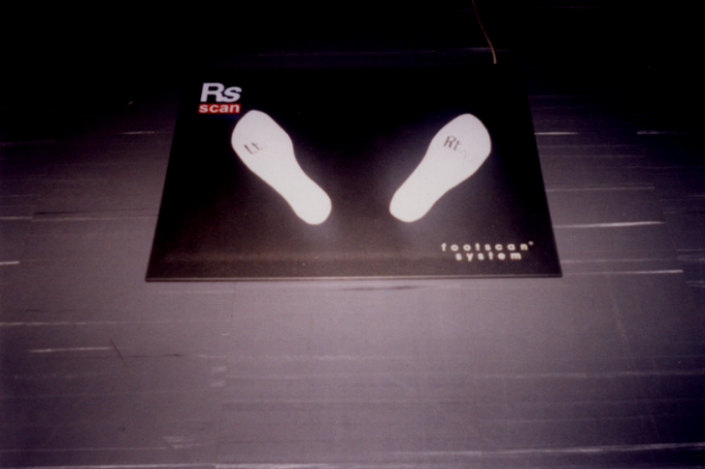 | Figure (2). The Resistive Sensor foot- scan force plate |
3.3. Data Collection and Analysis
- The data was collected by analyzing the print and graph of each subject, using the RS foot scan special program considering the following steps:1. The dominant limb was detected by asking the subject to write his name and to kick a ball. 2. The subjects were asked to take off shoes and stand bare feet on the foot mark drawn on the force plate with erect back and straight knees and eyes forward.3. Four points were detected under each foot on the screen (big toe, lateral aspect, head of 1st metatarsal and mid heel on the screen. 4. The graph was analyzed using the software program of the R-S foot scan. 5. The peak plantar pressure was measured under these four points in both dominant and non-dominant foot. As for descriptive analysis, mean and standard deviation were calculated for all variables. The histogram was used to display the distribution of each variable for the whole group while the bar chart was used to display the means of males and females for each variable.As for the analytical analysis, independent samples t-test was used to test if there is a significant difference between mean of males and mean of females for each variable. Paired t-test was used to test if there is a significant difference between mean of right and left for each variable. Also Pearson correlation coefficient was used to find the variables correlated to each other for both males and females and to test the significance of the correlation according to the following formula:
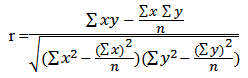 Where; x and y are the measures for Rt and Lt within the foot, heel and other points and n is the number of item within male and female subjects.
4. Results
|
|
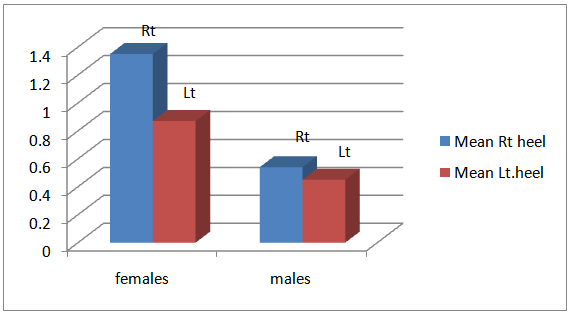 | Figure (3). Mean mid heel pressure for females and males |
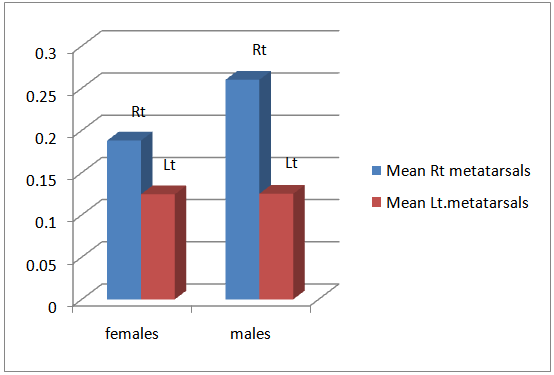
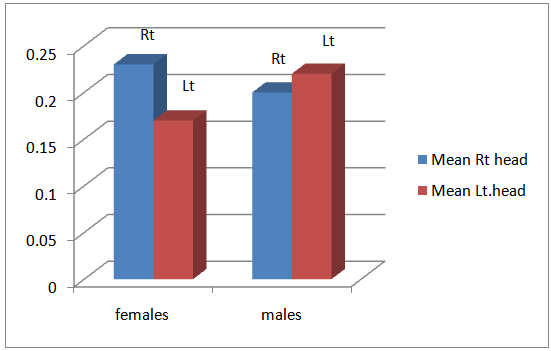 | Figure (4). Mean head of metatarsals pressure for females and males |
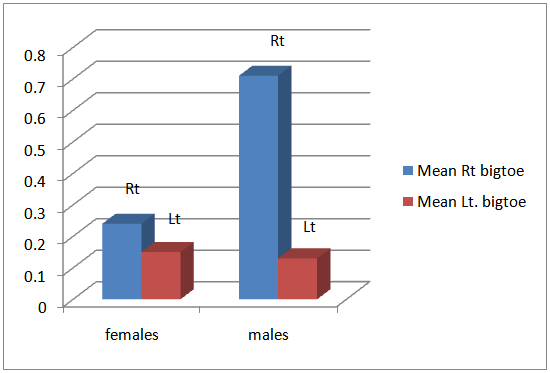 | Figure (5). Mean bigtoe pressure for females and males |
 | Figure (6). Mean lateral metatarsals pressure for females and males |
5. Discussion
- In this work, the effect of gender on plantar pressure distribution in normal subjects was studied. The difference in plantar pressure distribution between dominant and non-dominant limbs in different groups was also investigated through the study. The R.S foot scan was used to measure plantar pressure under four areas of each foot during standing. Biomechanical measurements of pressure distribution concentrate on the pressures between the foot plantar surface (sole) and the supporting surface. Various pressure systems are available for the measurements of the pressures inside the shoe or insole and the plantar foot during various activities. Such assessment has proven to be very useful in the diagnosis and management of pressure related foot problems. Plantar pressure may or may not be influenced by some factors such as body weight, velocity, stride length, and shoe type and construction. However, there is no satisfactory association between gender difference, anthropometry regarding right and left pattern of loading.Maximum and average pressures are often reported. The average pressure is the mean of all the sensor values, whereas the maximum pressure is the highest individual sensor value[32]. Natarggan and Myailvahnan,[19] reported that, the foot has two functions to perform; a static and a dynamic function. In standing it performs static functions by forming a stable weight bearing support to the body. During walking, it functions as an efficient lever to propel the body weight forward. The arches of the foot are formed by the shape and articulations of the tarsal bones, held together by the strong plantar and spring ligaments but the maintenance of the arches depends on the efficient postural tone of the intrinsic muscles of the foot.On the other hand,the following stability functions could be performed by the foot with a fixed arch structure: (1) distribution of weight through the foot for proper weight bearing; and (2) conversion of the foot to a rigid lever. However, the following mobility functions can only be performed by a non-rigid structure: (a) dampening of the shock of weight bearing; (b) adaptation to changes in the supporting surface and (c) dampening of superimposed rotations.Furthermore, Glasoe et al.,[9] added that, the distribution of body weight through the foot depends on the shape of the arch and the location of the line of gravity at a given moment. In bilateral stance, each talus receives 50 percent of the body weight; in unilateral stance, the weight-bearing talus receives 100 percent of the superimposed body weight. In static unilateral or bilateral stance, 50 percent of the weight received by the talus passes through the posterior subtalar articulation to the calcaneus, and 50 percent passes anteriorly to the forefoot.This study revealed that, on the level of mid heel there was a significant difference in plantar pressure value between male and female group and right and left foot. The heel receives more than twice the magnitude of the other total forefoot and mid foot with a difference between male and female. This can be viewed with the variability of foot structure.Sammarco,[27] mentioned that, during standing, the mobility of the metatarsal heads permits them all to fall into contact with the floor as soon as load is applied. In those portions of the foot having contact with the floor, approximately 50% of the load is borne by the heel and 50% is transmitted across the heads of the metatarsals. The load on the first metatarsal head is twice that on each of the lateral four metatarsal heads. The weight-bearing area of the foot has been assessed by several authors using many different methods. The results of these studies have led to a general controversy over what areas of the foot actually bear weight during quiet standing. Cavanagh et al,[5], reported data about weight bearing in over 100 asymptomatic feet. The authors used an electronic mat with 256 sensors with a resolution of 1×1 cm to measure the pressure distribution under the foot. The study revealed that, the largest pressure under the foot was located in the heel in 96 out of 107 feet tested and was greater than twice the mean pressure under the forefoot region. However, assessment of mean weight distribution revealed that 60.5% of the weight was applied across the heel, 28.2% in the fore foot, and 7.8% in the hind foot, with the remaining 3.5% in the toes. Their data also supported the concept that all of the heads of the metatarsal bones bear weight during quiet standing[14]. It was noted that there is a very large individual variation in proportional to loading of the foot. It should be noted, however, that these authors measured "asymptomatic" feet, making no attempt to describe or to assess the feet in terms of the arched foot. Thus, some subjects may have demonstrated hind foot or forefoot deformities with corresponding postural abnormalities but had no clinically significant complaint related to these abnormalities. The variability reported by these authors, therefore, may be the result of a more heterogeneous population than suggested by the lack of symptoms reported by the subjects. However, Sammarco,[27] suggested that, A slight change in the foot structure alters the load distribution. A small change in the loading of the foot can cause a significant change in load distribution.The heel pad, located beneath the calcaneus bone, consists of dense strands of fibrous septa and closely packed fat cells[23]. The fibrous septa, rich in collagen fibers, from large sealed compartments retaining and preventing the out flow of fat. Hsu et al., (1998) stated that, the heel pad is an efficient shock absorber that attenuates the peaks of dynamic forces and dampens vibrations in each individual, the impact of pressure load on tissues alters over time. During standing, the mobility of the metatarsal heads permits them all to fall into contact with the floor as soon as load is applied. In those portions of the foot having contact with the floor, approximately 50% of the load is borne by the heel and 50% is transmitted across the heads of the metatarsals. The load on the first metatarsal head is twice that on each of the lateral four metatarsal heads. The first metatarsal head thus transmits twice the load of each individual lateral metatarsal head. The first metatarsal bone bears the most weight and plays the most important role in propulsion. It is the shortest and thickest. It also provides attachment for several tendons. The second, third, and fourth metatarsal bones are the most stable bones of the metatarsals. They are well protected and have only minor tendon attachments and are not subjected to strong pulling forces[16]. On the other hand, the change in pressure distribution was highly significant on big toe level the change in peak pressure over the lateral metatarsals caused significant difference in the distribution of plantar pressure on big toe. There was significant difference in distribution in male and female group. By comparing the pressure distribution between the four studied contact points under the foot in group I, there was significant difference between the dominant and non-dominant limbs at the level of mid heel and metatarsals, there was significant difference on the level of head of first metatarsal and big toe. By comparing plantar pressure distribution under dominant and non-dominant foot, the results of this study indicate significant increase in female at dominant foot, with no available data in the literature to compare between two feet. The asymmetry in the normal characteristics between feet settle a question about the normality concerning the foot biometrics.Previous studies have demonstrated different methods to measures plantar pressure. This may be of value to prevent injuries and ulcer formation by changing the walking pattern in patients who have lost nociceptive perception secondary to metabolic diseases, infections or neuraologic disorders[21]. Maximum and average pressures are often reported. The average pressure is the mean of all the sensor values, whereas the maximum pressure is the highest individual sensor value (Stinson,[32]). The most commonly reported pressure value is the single maximum.Concerning pressure recorded at critical areas of body (Shelton et al[29], Cobb and Claremont[6]) reported that the average pressure is a more stable measureand gives a better overall picture of interface pressure in disabled people than maximum pressure, which is a single sensor value. Plantar pressure distribution was evaluated in three plantar areas: forefoot, midfoot and rear foot and during two phases of gait stance: heel–strike and push-off. The rear foot corresponded to 30% of foot length, the mid foot, 30% of foot length, and the forefoot(which included the metatarsal heads and the toes), 40% of foot length, following the scheme established by Cavanagh and Ulbrecht[35]. These areas were defined in the Creation of any Mask software and are proportional to the insoles length and width.[31]. Blaszczyk et al.,[3], cleared that, although the identification and characterization of limb load asymmetries during quiet standing has not received much research attention, they may greatly extend our understanding of the upright stance stability control. It seem that limb load asymmetry factor may serve as a vertical measure of postural stability and thus it can be used for early diagnostic of the age related decline in balance control. Abboud et al.,[1], mentioned that, in healthy, normal feet where there is no pain or any anatomical or functional deformity, normal plantar pressure distribution exists under the load bearing points of the foot, i.e, heel, metatarsal heads and phalanges of the toes.
6. Conclusions
- In the case of an abnormal plantar pressure distribution, the areas of peak pressure do not always correspond to those where the patient senses the pain, either because the subject has changed the pattern of his/her walking pattern to protect the area of pain, or because it is related to a functional problems. This apparent dilemma indicates that the cause of high pressure under the foot is multifactorial and is consequent to either anatomical or functional disturbance or more likely a combination of both. Determination of planter pressure pattern during different position as well as activity in male and female may be used in early detection of minor alteration of planter pressure due to minor change in anatomical and mechanical integration of musculoskeletal unit.