-
Paper Information
- Next Paper
- Previous Paper
- Paper Submission
-
Journal Information
- About This Journal
- Editorial Board
- Current Issue
- Archive
- Author Guidelines
- Contact Us
American Journal of Biomedical Engineering
p-ISSN: 2163-1050 e-ISSN: 2163-1077
2013; 3(6): 132-142
doi:10.5923/j.ajbe.20130306.02
Classification of Body Movements in Wearable ECG (W-ECG) Signals Using Artificial Neural Networks
 Abstract
 Reference
 Full-Text PDF
 Full-text HTML
Rahul Kher1, Tanmay Pawar2, Vishvjit Thakar3
1EC Department, G H Patel College of Engineering & Technology, V V Nagar, India
2Electronics Department, BVM Engineering College, V V Nagar, India
3EC Department, AD Patel Institute of Technology, V V Nagar, India
Correspondence to: Rahul Kher, EC Department, G H Patel College of Engineering & Technology, V V Nagar, India.
| Email: |  |
Copyright © 2012 Scientific & Academic Publishing. All Rights Reserved.
The wearable electrocardiogram (W-ECG) signal inherently contains motion artifacts due to various body movements of the wearer. The W-ECG signals with four body movement activities (BMAs) ‒ left arm up-down, right arm up-down, waist-twist and walking of five healthy subjects have been acquired using the wearable ECG recorder. The classification of these four BMAs has been performed using artificial neural networks (ANN). In the process, the motion artifacts contained in the captured W-ECG signals have been extracted using Wavelet transform and the features of the motion artifacts have been extracted using Gabor transform. These feature vectors are fed to a multi-layered perceptron neural network (MLPNN) consisting of ten neuron hidden layer. The overall classification accuracy achieved using ANN is close to 92%.
Keywords: Wearable ECG, Motion artifacts, Gabor transform, Wavelet transform, Artificial neural networks
Cite this paper: Rahul Kher, Tanmay Pawar, Vishvjit Thakar, Classification of Body Movements in Wearable ECG (W-ECG) Signals Using Artificial Neural Networks, American Journal of Biomedical Engineering, Vol. 3 No. 6, 2013, pp. 132-142. doi: 10.5923/j.ajbe.20130306.02.
Article Outline
1. Introduction
- Cardiovascular disorders are now becoming common in early age groups of people of 30-40 years. A routine long-term monitoring of ECG is recommended for the people above 30 years of age which may be considered at potential risk of developing cardiac disorder for earlier diagnosis and cure. However, such monitoring has not been given due importance in the practice. It is mostly avoided because of the time and resource constraints, unless the patient has already been developed with a serious heart disorder and reports for medical care. A practical solution to prevent this situation is to have very small-size, light-weight wearable ECG devices for cardiac monitoring which can continuously record ECG signals for many days. It is likely that the infrequent episodes of heart disorders that do not after short-time clinical check-ups can become visible in continuous, long-term ambulatory ECG signals. Therefore, wearable ECG (W-ECG) is a more preferred and convenient option to hospitalization of the person at potential risk for the purpose of the long-term cardiac monitoring. Though W-ECG is very useful for ambulatory cardiac monitoring of a person wearing the W-ECG recorder, the body movement activities (BMA) like walking, sitting down/standing up, climbing stairs up/down, left/right arm updown etc. of the wearer may distort the collected ECG signal by inducing the motion artifacts. Thus, motion artifacts resulting due to various BMAs are inherently present in the W-ECG signals. The difficulty in ambulatory cardiac monitoring is that the motion artifacts have significant spectral overlap with the ECG signal itself and can mimic an event of cardiac disorder even for a normal heart. Hence, it is necessary to detect the motion artifacts and more importantly to investigate about the BMAs due to which the motion artifacts are generated in the W-ECG signals. In[1] and[2] Pawar et al. have used principal component analysis (PCA) based approach for classifying various BMAs. Pawar et al. have used the Gabor filter and Hidden Markov models (HMM) for classifying the BMAs in[3]. Ming Li et al.[4] have proposed a physical activity (PA) recognition algorithm for a wearable wireless sensor network using both ambulatory electrocardiogram (ECG) and accelerometer signals using support vector machine (SVM) and Gaussian mixture models (GMM). In[5], authors have classified the BMAs using energy expenditure estimation (EER) and neural networks (NN). The classification was performed on the basis of four features acquired from motion sensors i.e. count, mean signal magnitude area (SMA), standard deviation of SMA and median SMA. In[6]-[8] authors have used the accelerometer sensor data and artificial neural networks (ANN) for classification of daily physical activities. Time domain features like mean, variance, median, skew, kurtosis and frequency domain features like spectral centroid, spectral spread, estimation of frequency peak, estimation of power of the frequency peak, and signal power in different frequency bands of the wearable sensors have been used for activity classification. In addition to these, in[9],[10],[20]-[23] authors have performed transition detection and recognition of various BMAs in ambulatory ECG signals. In this paper, the classification of various BMAs has been performed using the motion artifacts present in the acquired W-ECG signals. The motion artifacts have been separated using the 1-D discrete wavelet transform (DWT) and the Gabor filter has been used for extracting the features of motion artifacts corresponding to various BMAs. The ANN has been trained using these feature vectors and then tested for various subjects. The organization of the paper is as follows: section 2 introduces the W-ECG recorder and data acquisition process, section 3 gives brief description of the Wavelet transform and Gabor filter for feature extraction followed by ANN structure, experimental results and conclusion in section 4, 5 and 6, respectively.
2. Wearable ECG Data Acquisition
- The ECG signals have been acquired using a self-developed wearable ECG recording system shown in fig. 1. In addition to wireless ECG transmitter/receiver modules it consists of the accelerometer module to provide the motion data corresponding to various movements. The specifications of the W-ECG recorder used in this study are as follows: single-lead, bandwidth- 0.05 to 106 Hz, sampling frequency- 512 Hz, A/D conversion- 12 bits/sample. The lead-II configuration is chosen for all the recordings in this study for consistency. The W-ECG signals with four body movement activities viz. left arm up-down, right arm up-down, waist twist and walking for five healthy subjects aged between 25-37 years were recorded. Fig. 2 shows the ECG signal recorded while performing left arm up-down movement and the corresponding accelerometer signals in x, y and z-directions. However, the accelerometer signals have not been used in this study for estimating/detecting the motion artifact signals present in the WECG signals.
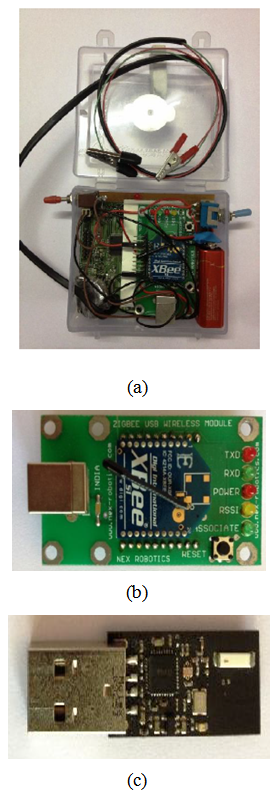 | Figure 1. Wearable ECG recorder: (a) Transmitter module; (b) Receiver module and accelerometer module in (c) |
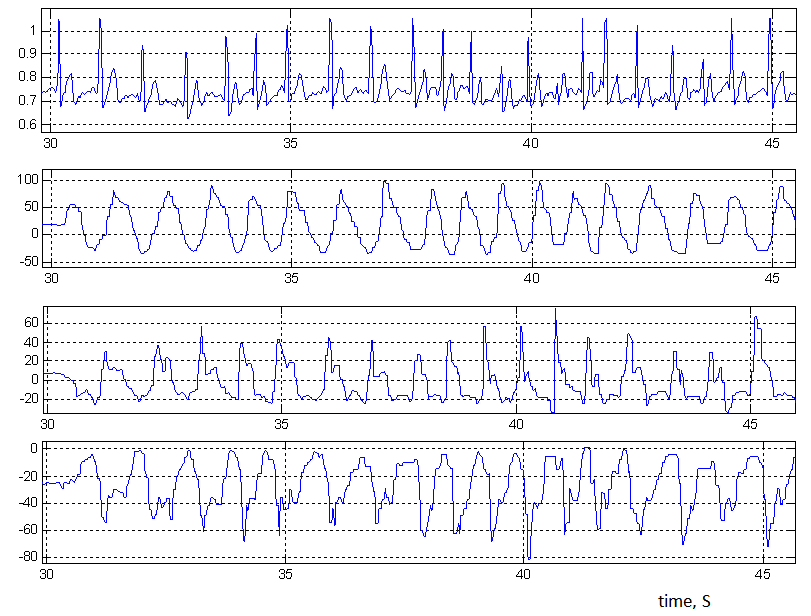 | Figure 2. W-ECG signal with left arm up-down movement (top) and accelerometer signal in x, y and z-direction (lower three) |
3. Motion Artifact Detection and Feature Extraction
- Various approaches have been used for deriving the inherent motion artifacts present in ambulatory/wearable ECG signals. Thakor et al.[11] have proposed an adaptive filter based technique for removing motion artifacts from ECG signals. Pawar et al.[3] have modified the adaptive filter suggested in[11] to make the ECG signal motion artifact free. In[12] authors have proposed Wavelet transform based method for detecting the motion artifact signal from ambulatory ECG. We have applied 1-D discrete wavelet transform (DWT) for deriving the motion artifacts.
3.1. 1-D Discrete Wavelet Transform (DWT)
- The Discrete Wavelet Transform (DWT), which is based on sub-band coding, is a useful tool to implement Wavelet transform for digital signals. The 1-D DWT is computed by successive low-pass and high-pass filtering of the discrete 1-D signal as shown in fig. 3. The input signal x[n] is low-pass filtered using the block denoted by G0 as well as high-pass filtered using H0 using the cut-off frequency, fc = fs/2. Thus, the original input signal x[n] will be down-sampled by two. This is also called as decomposition of the signal. At each level, the high pass filter produces the detail information, d[n], while the low pass filter associated with scaling function produces coarse approximations, a[n]. The low-pass filter output, a[n], is further down-sampled by two through the low-pass and high-pass filter blocks. Thus, one can go on decomposing the input signal upto nth level. Figure 3 illustrates the 3rd level decomposition of the signal, x[n].
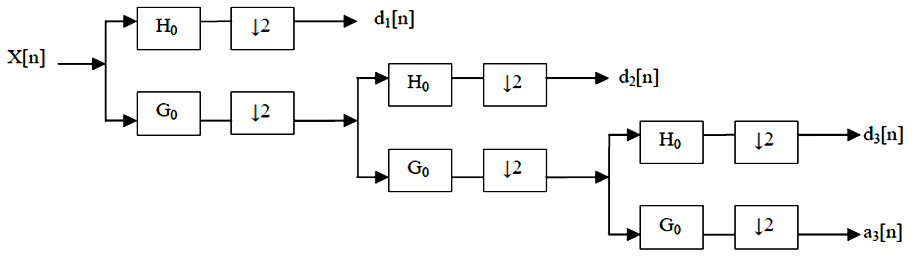 | Figure 3. A Three-level wavelet decomposition tree |
 | (1) |
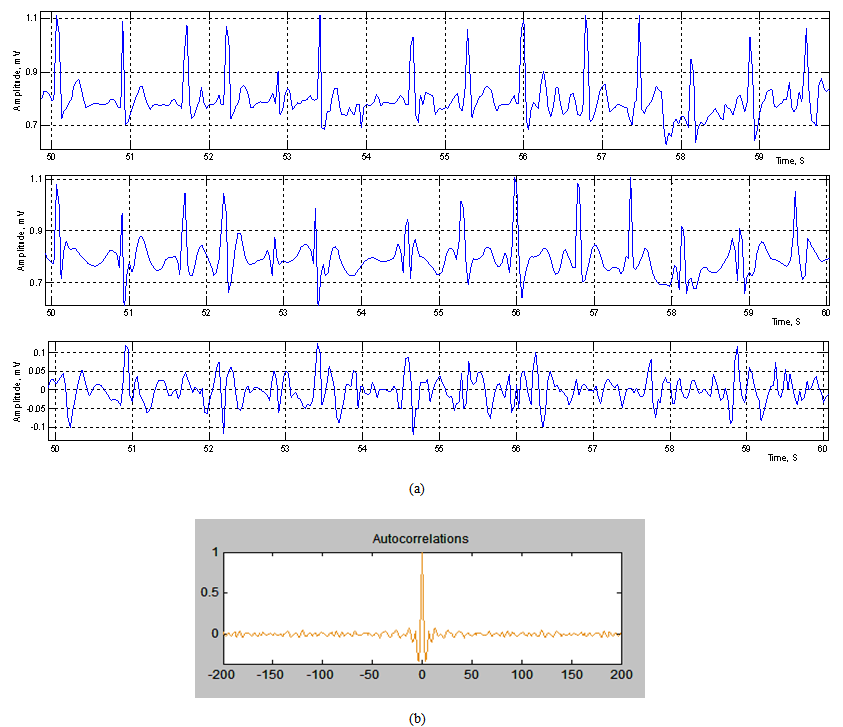 | Figure 4. (a) Reconstructed W-ECG signal (top) and extracted motion artifact signal (bottom); (b) autocorrelation plot |
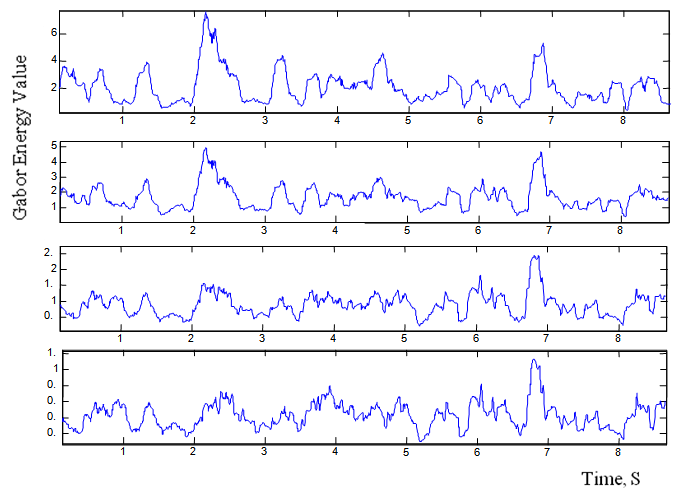 | Figure 5. Gabor feature signals gl(n), for fist four subbands, l = 1, 2, 3, 4 |
3.2. Gabor Transform
- The features, particularly the frequency domain features, in the motion artifact have been used for the BMA classification purpose. Since we are planning to use temporal relations among time localized frequency features for the modeling, the motion artifact signal s(n) is analyzed into various subbands using Gabor filters. “Gabor transform has very good time-frequency localization properties. The different, equally spaced frequency components of the motion artifact signal s(n) are computed by”[3],
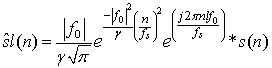 | (2) |
 is the filter bandwidth and ‘*’ indicates the convolution operation. The filter bandwidth basically indicates the sharpness of the filter: a larger value of
  produces a larger bandwidth and greater sharpness. The Gabor filter is a complex sinusoidal wave of particular frequency modulated by a Gaussian envelope which defines the time duration. The effective time duration is inversely proportional to the effective bandwidth via the uncertainty relation. It is observed that the energies of the motion artifact signal are contained in 1-10Hz band, the number of subbands selected here is l = 1, 2, …. 10. The energy estimate in each of these ten subbands of
  is calculated by a moving average of the windowed function as
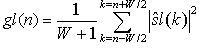 | (3) |
 | (4) |
 | (5) |
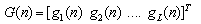
4. Neural Network Structure
- The artificial neural network (ANN) is an important tool for classifying the pattern of data, when a set of feature vector is given as input. ANN has been widely used for various purposes like QRS complex detection, feature extraction, beat and arrhythmia classification[13]-[19]. We intend to classify the BMAs of an individual person. Hence, four 1×400 Gabor energy feature vectors (of first four subbands) have been combined to form a 1×1600 feature vector corresponding to one BMA. The similar feature vectors corresponding to other three BMAs are combined to form a 4×1600 and the ANN was trained using these set of feature vectors. In the training phase, we assigned “1”, “2”, “3” and “4” as targets corresponding to the input feature vectors four BMAs― left arm up-down, right arm up-down, waist-twisting and walking― respectively. Hence, when the test input comprising of feature vectors corresponding to left arm up-down BMA is given to the ANN, it should produce “1” at the output. The multi-layered perceptron neural network (MLPNN) with ten layers of hidden neurons, as shown in fig. 6, has been used for training and testing purpose. The simulations have been performed using neural network toolbox (NNTool) of MATLAB 7®.
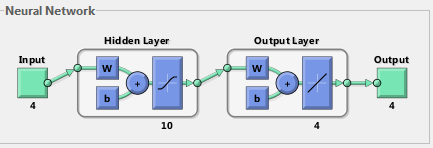 | Figure 6. The MLPNN structure used for BMA classification |
5. Experimental Results and Discussion
- We intended to classify the BMAs of an individual person. Hence, a 4×1600 feature vector (which comprises the features of all four BMAs to that person) was fed to ANN for training. In the training phase, we assigned “1”, “2”, “3” and “4” as targets corresponding to four BMAs― left arm up-down, right arm up-down, twisting waist and walking― respectively. Hence, when a feature vector corresponding to left arm up-down BMA is given for testing the ANN should produce “1” at output. Fig. 7 indicates the test outputs and errors corresponding to all four BMAs of subject 1. Fig. 8 indicates the test outputs when test data input corresponding to two BMAs are simultaneously given to the ANN. Fig. 8(a) is the test result when left arm up-down and right arm up-down test data are fed to the ANN and fig. 8(b) shows similar results when other two BMA test data are fed. The higher error pathes in fig. 8(a) (bottom) indicates that there is a higher matching in left-arm up-down and right arm up-down BMAs i.e. the ANN could make a slightly lesser distinction between these two BMAs. Whereas, the smaller error values in fig. 8(b) indicates that the ANN clearly distinguishes between the waist-twist and walking BMA classes.The classification accuracy performance for rest of the subjects is described in Table I, which indicates the overall classification accuracy is close to 92%. In order to test the ANN performance, several combinations of feature vectors comprising of two, three and four BMA classes have been applied. The classification accuracy has been derived by giving a particualr BMA test data as input to the ANN and observing that how much closely the outputs match the corresponding target values. The simulations were carried out for five different subjects.
 | Figure 7. (a) Left arm up-down BMA test result output (top) and error (bottom); similar results for right arm up-down BMA waist rwist BMA and walking BMA in (b), (c) and (d), respectively for subject 1 |
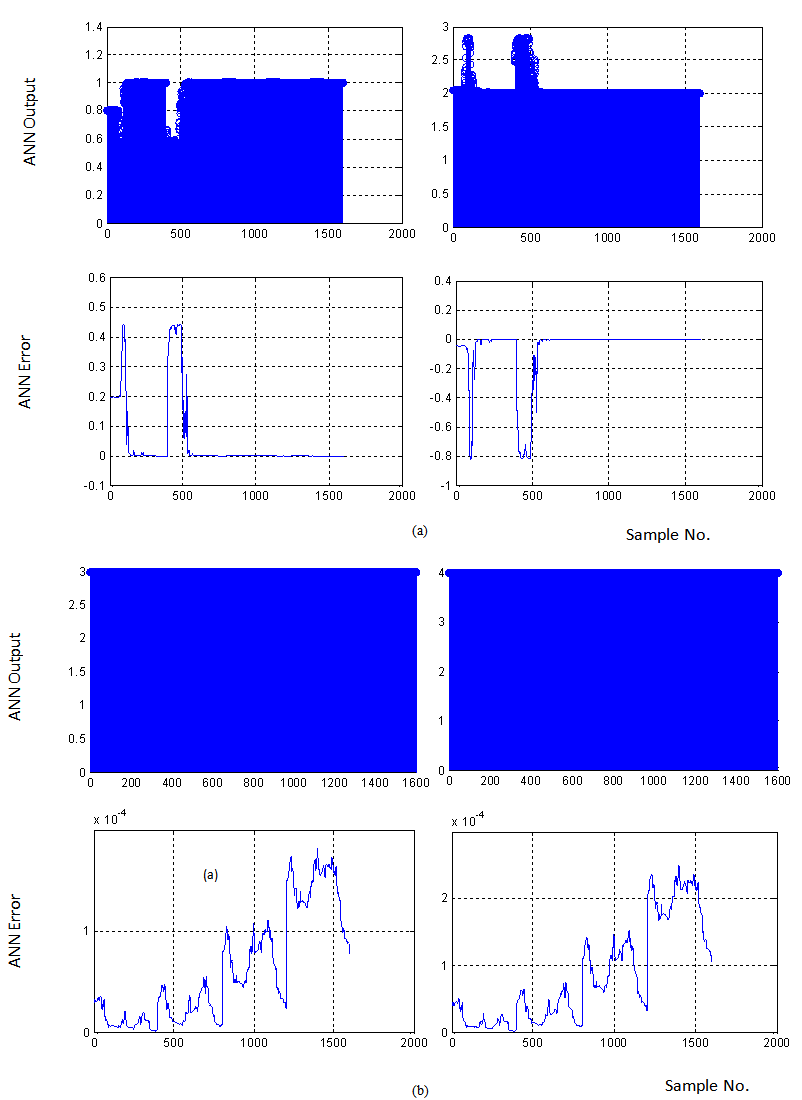 | Figure 8. (a) ANN test output with left arm up-down and right arm up-down test data as input; (b) similar results for waist twist and walking test data as input |
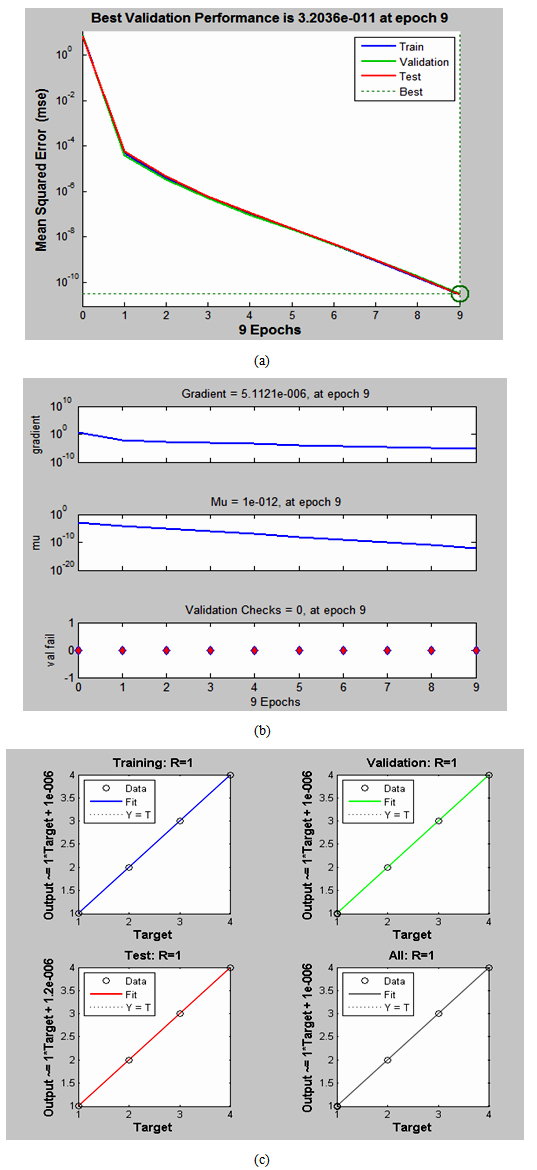 | Figure 9. (a) Training, validation and test performance; (b) training states and (c) regression plots of the neural network of fig. 6 used for simulation |
6. Conclusions
- The wearable ECG signal gets contaminated with motion artifacts due to various boy movement activites (BMAs). A classification among four such BMAs present in W-ECG for five subjects has been perofrmed by combining Wavelet transform, Gabor transform and ANN. The classification has achieved an overall accuarcy close to 92%. The model presented over here can be used for classifying more BMAs. Also, here only the Gabor energy signals have been used as feature vectors for training the ANN; more features like accelerometer data, heart rate, R-R intervals etc. can be used for more classification accuracy.
ACKNOWLEDGEMENTS
- The authors would like to acknowledge Sophisticated Instrumentation Centre for Advanced Research and Testing (SICART) and Charutar Vidyamandal, Vallabh Vidyanagar, India for their support during the work.
Conflict of Interest
- The authors declare that they have no competing interests.
References
| [1] | T. Pawar, S. Chaudhuri, and S. P. Duttagupta, “Analysis of Ambulatory ECG Singal,” in 28th IEEE EMBC, New York City, New York, USA, Aug.-Sept 2006, pp. 3094–3097. |
| [2] | T. Pawar, N. S. Anantakrishnan, S. Chaudhuri, and S. P. Duttagupta, “Impact Analysis of Body Movement in Ambulatory ECG,” in 29th IEEE EMBC, Lyon, France, Aug. 2007, pp. 5453–5456. |
| [3] | S. Chaudhuri, T. Pawar and S. Duttagupta, Ambulation Analysis in Wearable ECG, Springer, 2009, ISBN 978-1-4419-0723-3. |
| [4] | Ming L., Rozgic, V., Thatte, G., Sangwon, L., Emken, A., Annavaram, M., Mitra, U., Spruijt-Metz, D. and Narayanan, S., “Multimodal physical activity recognition by fusing temporal and cepstral information”, IEEE Transactions on Neural Systems and Rehabilitation Engineering, Vol. 18, No. 4, August 2010., pp. 369–380. |
| [5] | Che-Wei Lin, Ya-Ting C. Yang, Jeen-Shing Wang, Member, IEEE, and Yi-Ching Yang, “A Wearable Sensor Module With a Neural-Network- Based Activity Classification Algorithm for Daily Energy Expenditure Estimation”, IEEE Transactions on Information Technology in Biomedicine, Vol. 16, No. 5, pp. 991-998, September 2012. |
| [6] | Juha P¨arkk¨a, Miikka Ermes, Panu Korpip¨a¨a, Jani M¨antyj¨arvi, Johannes Peltola, and Ilkka Korhonen, “Activity Classification Using Realistic Data From Wearable Sensors”, IEEE Transactions on Information Technology in Biomedicine, Vol. 10, No.1, pp. 119-128, January 2006. |
| [7] | Miikka Ermes, Juha P¨arkk¨a, Jani M¨antyj¨arvi, and Ilkka Korhonen, “Detection of Daily Activities and Sports With Wearable Sensors in Controlled and Uncontrolled Conditions”, IEEE Transactions on Information Technology in Biomedicine, Vol. 12, No. 1, pp. 20-26, January 2008. |
| [8] | Juha Parkka, Miikka Ennes and Mark van Gils, “Automatic Feature Selection and Classification of Physical and Mental Load using Data from Wearable Sensors”, 10th IEEE International Conference on Information Technology and Applications in Biomedicine (ITAB), 2-5 November 2010, Greece, pp. 1-5. |
| [9] | T. Pawar, N. S. Anantakrishnan, S. Chaudhuri, and S. P. Duttagupta, “Transition Detection in Body Movement Activities for Wearable ECG,” IEEE Transactions on Biomedical Engineering, Vol. 54, no. 6, pp. 1149–1152, June 2007. |
| [10] | T. Pawar, N. S. Anantakrishnan, S. Chaudhuri, and S. P. Duttagupta, “Impact of Ambulation in Wearable-ECG”, Springer Link Annals of Biomedical Engineering, Vol. 36, No. 9, September 2008, pp. 1547–1557. |
| [11] | Nitish V. Thakor and Yi-Sheng Zhu, “Applications of Adaptive Filtering to ECG Analysis: Noise cancellation and Arryhthmia Detection”, IEEE Transactions on Biomedical Engineering, Vol. 38, no. 8, pp 785-794, August 1991. |
| [12] | V. S. Nimbargi, V. M. Gadre, and S. Mukherji, “Characterization of ECG Motion Artifacts Using Wavelet Transform and Neural Networks”, Indian Conference on Medical Informatics and Telemedicine, Kharagpur, West Bengal, India, 2005. |
| [13] | Vijaya G, Kumar V and Verma H K, “ANN-based QRS-complex Analysis of ECG”, Journal of Med Eng Technol., Jul-Aug 1998; Vol. 22, No. 4, pp. 160-167. |
| [14] | Yüksel Özbay and Bekir Karlik, “A Recognition of ECG Arrhythmias using Artificial Neural Networks”, Proceedings of the 23rd Annual EMBS International Conference, October 25-28, Istanbul, Turkey, pp. 1680-1683. |
| [15] | Yu Hen Hu, Willis Tompkins, Jose L Urrusti and V X Afonso, “Application of Artificial neural networksfor ECG Signal Detection and Classification”, Journal of Electrocardiology, Vol. 26 suppliment, pp. 66-73. |
| [16] | Liang-Yu Shyu, Ying-Hsuan Wu, and Weichih Hu, “Using Wavelet Transform and Fuzzy Neural Network for VPC Detection From the Holter ECG”, IEEE Transactions on Biomedical Engineering, Vol. 51, No. 7, July 2004, pp. 1269-1273. |
| [17] | Rosaria Silipo and Carlo Marchesi, “Artificial Neural Networks for Automatic ECG Analysis”, IEEE Transactions on Signal Processing, Vol. 46, No. 5, May 1998, pp. 1417-1425. |
| [18] | Prasad G K and Sahambi J S, “Classification of ECG arrhythmias using multi-resolution analysis and neural networks”, Conference on Convergent Technologies for the Asia-Pacific Region, 15-17 October, 2003, pp. 227-231. |
| [19] | İnan Güler and Elif Derya Übeyl, “ECG beat classifier designed by combined neural network model”, Pattern Recognition, Vol. 38, Issue 2, February 2005, Pages 199–208. |
| [20] | Wen-Tsai Sung, Jui-Ho Chen and Kung-Wei Chang, “Study on Rael Time BEAM System for Diagnosis Assistance based on System on Chip Design”, Sensors 2013, 13, 6552-6577. |
| [21] | Perlman O, Katz A, Weissman N. and Zigel Y., “Atrial Electrical Activity Detection in the 12-lead ECG using Synthetic Atrial Activity Signals”, Computer in Cardiology (CinC), 2012, pp. 665-668. |
| [22] | Adams E. R., and Choi A., “Using Neural Networks to Predict Cardiac Arrhythmias”, 2012 IEEE International Conference on Systems, Man and Cybernetics (SMC), pp. 402-407. |
| [23] | Dhawan A., Wenzel B., George S., Gussac I., Bojovic B., and Panescu D., “Detection of Accute Myocrdial Infarction from Serial ECG using Multi-layer Support Vector Machine”, IEEE EMBC 2012, pp. 2704-2707. |