-
Paper Information
- Previous Paper
- Paper Submission
-
Journal Information
- About This Journal
- Editorial Board
- Current Issue
- Archive
- Author Guidelines
- Contact Us
American Journal of Biomedical Engineering
p-ISSN: 2163-1050 e-ISSN: 2163-1077
2013; 3(4): 91-98
doi:10.5923/j.ajbe.20130304.02
Computational Analysis of Catheter-Tip Geometries for Optimizing Drug Infusion in Arterial Blood Flow
 Abstract
 Reference
 Full-Text PDF
 Full-text HTML
Kiyya Ararsa, Ralph C. Aldredge
Department of Mechanical and Aerospace Engineering, University of California, Davis, CA, 95616, USA
Copyright © 2012 Scientific & Academic Publishing. All Rights Reserved.
Intra-arterial infusion therapy is an effective treatment of localized malignant diseases. This type oftherapy reduces systemic toxicity and enhances tumor response. However, poor mixing and non-uniform drug dispersion can lead to a buildup of toxic local concentrations and thereby decrease the effectiveness of the therapy. In this study, we investigate the mixing properties of six catheters with varying tip geometries to address the problem of local toxicity. Using a 3D, turbulent, incompressible, two-fluid, unsteady formulation, the goal of the study is to qualitatively compare and determine which catheter-tip geometries produce the most optimal mixing characteristics distal to the catheter tip and deliver the highest drug concentration to the vessel walls. The open-source code OpenFOAM is used to model blood and drug flow dynamics. Our resultsshow that modified catheters with side holes exhibitthe best spreading and mixing properties andthat lower-viscositydrug solutions are more effective than higher-viscosity drug solutionsat the same injection flow rates.
Keywords: Catheter Design, Drug Infusion Therapy, Bio-fluid Dynamics, Blood-flow Modeling, Open FOAM
Cite this paper: Kiyya Ararsa, Ralph C. Aldredge, Computational Analysis of Catheter-Tip Geometries for Optimizing Drug Infusion in Arterial Blood Flow, American Journal of Biomedical Engineering, Vol. 3 No. 4, 2013, pp. 91-98. doi: 10.5923/j.ajbe.20130304.02.
Article Outline
1. Introduction
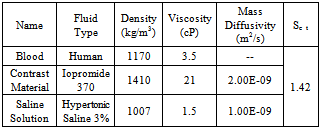
- The practice of intra-arterial infusion of drugs for the treatment of localized malignant diseases has been longstanding in the field of interventional radiology[1, 2]. The objective of this therapy is to deliver an appropriate drug concentration locallyto the infused region, with a lowered drug concentration in systemic circulation. However, local toxicity is a common problem associated with intra-arterial infusion techniques[1]. One of the more probable causes of local toxicity is insufficient mixing of the drug solution with blood at the point of infusion, associated with non-uniform streaming from the catheter tip, as shown by Lutz and Miller[3]. Lutz et al.[4] proposed increasing thedrug-solution infusion rate to combat the local toxicity problem. Unfortunately, higher infusion rates have several drawbacks; for example, (a) possible jesting, whipping and recoiling of the catheter on the vascular wall and (b) higher injection pressures that may be difficult to maintain with some catheter-tip designs and with high-viscosity drug solutions. Higher drug-infusion rates are also impractical in chronic medical treatments, as they result in larger volumes of ingestedfluid[5-7]. Ultimately, effective intra-arterial drug-infusion therapy requires adequate local spreading and mixing in the vicinity of the catheter tip. Several studies have been conducted on catheter tip geometries to enhance local spreading and mixing properties. Weber et al.[8] investigated the addition of side holes and slits to a standard peripheral end-hole catheter. Their 1D inviscidstudy concluded that the addition of side holes and slits results in the drug solution having a pattern less like a jet streamand more like a plume, better mixing with the blood flow andlower shear stress at the blood-vessel wall.Mongrain et al.[9] conducted a 2D, steady numerical simulation of the performance of four catheter-tip geometries (standard end hole, vortex, flush and cloud) in a straight arterial vessel using commercial CFD software, FLUENT. The results of their study, which employeda steady, 2D viscous generalisation of the ID non-viscous approach presented in Hansen et al.[10], were found to agree qualitatively with experimental observations. However, the authors noted the limitations of their model in addressing the inherently unsteady, 3D nature of the flow. In particular, the steady, 2D model cannot account for the influence of turbulence transport, which can appreciably influence the extent of local mixing of an infused drug solution with the surrounding blow flow.In thepresent study, we investigate the mixing properties of six different catheters using an incompressible 3D, two-fluid, unsteady numerical formulation that fully accounts for turbulence effects. In addition, we consider two additional catheter-tip geometries (toposcopic and modified flush), not considered by Mongrain et al.[9]. Ournumerical simulations are conducted using OpenFOAM [11]open-source CFD software with an incompressible Navier-Stokes solver for two miscible fluids (basedan Eulerian volume-fraction approach) andthe realizable k-εturbulence model. The objective of our work is to qualitatively compare catheter-tip geometriesto determine which will produce the most optimal mixing characteristics distal to the catheter tip. The study also investigates the effects of viscosity by comparing the performance of two different infused solutions. A radiographic contrast material (Iopamidol 370) and a saline solution were chosen based on their relative viscosities and densities relative to those of blood[12]. Both laminar andturbulent flowsare considered in order to examine the effects of turbulent mixing. The two injection flow ratesthat we consider are 1 ml/s &21 ml/s for the contrast material and 1 ml/s &2.1 ml/s for saline solution. The flow rate of theblood is kept constant throughout ourstudy at 5.9 ml/s, so that the arterial blood-flow speed and Reynolds number in the region upstream from the catheter tip are 26.8 cm/s and 421, respectively, consistent with the laminar flow regime.
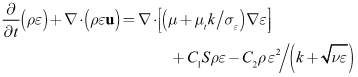
2. Formulation
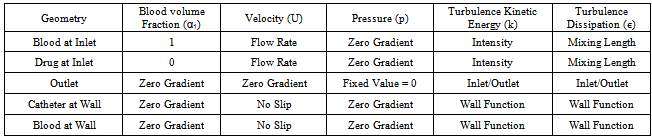
- Certain assumptions were made to simplify the complexity of blood flow dynamics, considering the challenges associated with modeling blood flow[13]. For example, the rheology of blood flow is generally non-Newtonian due to the presence of diverse elements, includingred and white blood cells and plasma; as blood is a living tissue, the components of which areinfluenced by chemical and electrical signals in the body. Furthermore, the blood flow is pulsatile and the blood vessels are viscoelastic, both of which can create a highly unsteady flow field[14]. As in Mongrain et al. [9], the blood and the injected solutions are both modeled as incompressible and Newtonian, because of the high shear rates (greater than 100/s) in the vicinity of the catheter jet where velocity gradients are large), and the rigid-wall assumption ismade. The pulsatile behavior of the blood flow is neglected also, consistent with the fact thatthe time period of interest is only a fraction of theheart-cycle period; the time for complete mixing and spreading of the injected solution over the computational domainis less than 0.1 seconds for all cases considered. However, our formulation fully accounts for the transient behavior of the blood and catheter-fluid flows,especially important near the tip of the catheter where the effects of turbulent mixing are most relevant.The governing equations describing hemodynamics in a blood vessel are derived from principles of mass, momentum, and energy conservation. A volume-fraction transport equation is used to characterize the mixing of blood with the injected solution. The volume fraction of blood, denoted
 , is defined as0 (1) in regions where there is only drug solution (blood) and between 0 and 1 elsewhere where there is a mixture of blood and the injecteddrug solution. The volume fraction of the injected solution
  is determined from
  once
once  is known. The mass-continuity and momentum equations are formulated to take into account the material and interfacial properties of the fluids.The governing equations for the volume fraction
  , mean flow velocity
  and pressure
  aregiven below. In these equations,
 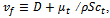 where
where  is the turbulence viscosity
  is the turbulence Schmidt number and D is the mass diffusivity of the injected drug solution in blood, equal to 10-9 m2/s for saline and twice as large for the contrast solution. The mixture density is defined by
 and the effective viscosity by
  with the mixture molecular viscosity given by
 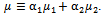 In Eq. (1),
  is the ensemble-averaged mixture-flow velocity.
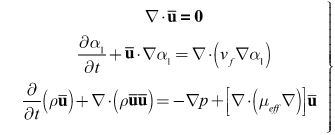 | (1) |
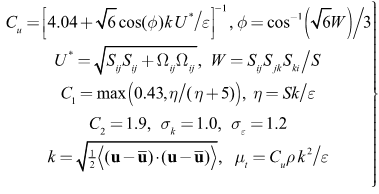
 is the realizable
  model, based on the Reynolds-Averaged Navier-Stokes (RANS) equations. This model was chosen over the standard
  model because it is more accurate at predicting the spreading rate of both planar and rounds jets, and it was concluded from a qualitative assessment of turbulence models that better accuracy of flow behavior can be achieved with the realizable
  model at low Reynolds numbers. The governing equations of the model are as follows[15].
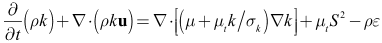 | (2) |
 | (3) |
 | (4) |
 | (5) |
3. Computational Model
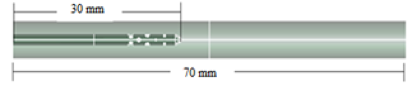
3.1. Catheter Geometry
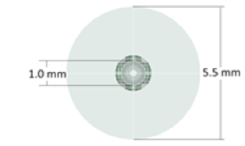
- The dimensions of thecomputational domain are similar to those ofMongrain et al. [9], but with a few modifications. The inner diameters of the blood vessel and catheter are 5.5 mm and 1mm, respectively, while the length of the computational domain (theblood-vessel length) is 70 mm. The computational domain encompasses the regions inside and outside of the final 30 mm of the catheter as well as the various openings in the catheter tip, as shown in Fig. 1.
 | Figure 1a. Cloud Catheter (side view) |
 | Figure 1b. Cloud Catheter (axial view) |
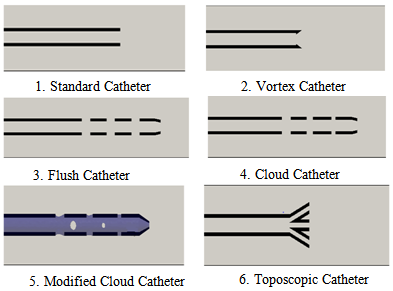 | Figure 2. Catheter-tip geometries (not to scale) |
3.2. Numerical Methods
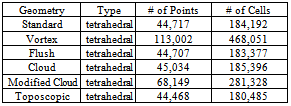
- A finite-volume method (FVM) was used to solve Eqs. (1)-(5) using open-sourcecode provided in OpenFoam 2.10 [11], a collection of C++ libraries. Specifically, the solver twoLiquidMixingFoam was used, with a second-order implicit backward scheme (upwind)for discretization oftime (convection) derivatives. The other spatial gradients were discretized via second-order Gauss integration. The simulation was conducted for a total of 0.1 seconds with the timesteps being controlled by aCFL of 0.75, based on the smallest grid spacing (0.05 mm) and themaximum velocity amplitude found for each time step. The computation was accomplished on a cluster of 16 - 20 processor nodes. Our computational grid is defined by a 3D unstructured tetrahedral mesh, created with SALOME 6.5. Table 1 summarizes the characteristics of the meshemployed for eachtype ofcatheter.
|
|
|
4. Results
4.1. Blood Volume-Fraction Iso-contours
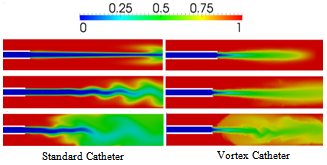
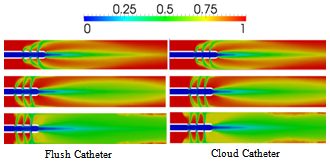
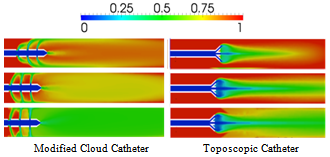
- Figure 3 compares the distribution of blood volume fraction in the blood vesselaround each of the six catheter types at a time of 0.7 seconds, representing the attainment of steady state, for saline-solution injection into the blood vessel at the rate of 1 ml/s. Values of the iso-contoursrange from 0, for pure saline, to 1 for pure blood, with intermediary values representing a mixture of the two fluids. Our results compare well qualitatively with the those of Mongrain et al. [9] but provide greater detail of the flow field. For example, the differences between the cloud and flush catheters are more evident in our results, where it can be seen that the flow exiting the third hole (farthest away) from the tip of the flush catheter has a lower flow rate than that from the same hole of the cloud catheter.The standard, vortex and toposcopic catheters exhibit poor spreading of the infused saline solution to the vessel wall when compared to the flush, cloud and modified cloud catheters. The standard and vortex catheters inducea streaming of the infused substance. Contrary to the design objective, the vortex catheter does not create mixing in the vicinity of the tip, nor does it create vortex sheading. However, it does result is enhanced diffusion of the injected solution into the blood flow, in comparison with that of the standard catheter design. The toposcopic catheter creates a low-pressure region in the vicinity of the tip, which draws the flow coming out of the side holes towards the middle of the blood vessel and away from the walls.Thus, downstream of the toposcopic-catheter tip the flow is very similar to that of the vortex catheter. It is obvious from Fig. 3 that the best performing catheters are the flush, cloud and modified cloud catheters, with performance measured by how fast the injected drug solution reaches the vessel walls, having mixed thoroughly with the surrounding blood flow. For a quantitative measure this performance, the spreading rates of the various catheters are compared in Figs. 4-7.
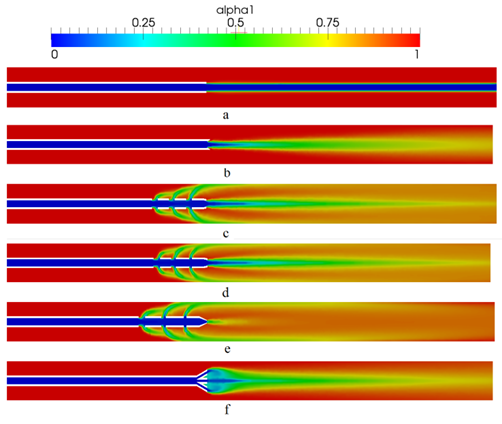 | Figure 3. Iso-contours of blood-volume fraction at a simulation time of 0.7s, for saline-solution injection of 1ml/s; for four catheter types: (a) Standard, (b) Vortex, (c) Flush, (d) Cloud, (e) Modified Cloud, (f) Toposcopic |
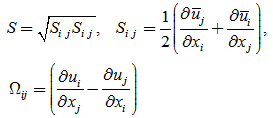
4.2. Spreading & Mixing
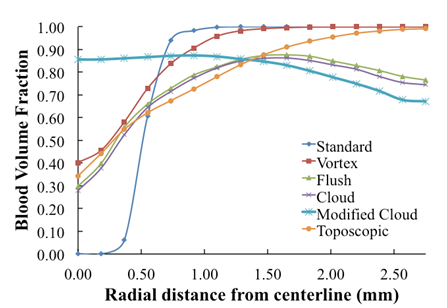
- To assess the spreading efficiency of the catheters, the blood volume fraction
 is plotted against the radialdistance from the catheter centerline at various locations downstream of the catheter tip. Figs. 4-7 show thevolume fraction at locations 1mm, 5mm, 10mm and 20mm downstream of the catheter tip for saline-solution injection at the rate of 1 ml/s. All measurements were taken in the same computational symmetry planeas that illustrated in Fig. 3. Optimal results should show small, nearly constant
  across the blood-vessel cross-section.Figure 4 illustrates the spreading of saline solution injected into the blood vessel at a location 1 mm downstream of the catheter tip. At this location the blood volume fraction
  is either negligible or small at the centerline (r = 0) for all but the modified-cloud catheter geometry, for which the volume fraction of the injected saline solution
  has been reduced to 20% as a result of substantial mixing at the centerline. However, the saline volume fraction drops off substantially as the blood-vessel wall is approached for all of the catheter types considered. Saline solution reaches the blood-vessel wall (with a volume fraction of about 40%) only for the catheters with side holes. Of these, the modified-cloud catheter performs best, with the most substantial mixing and dilution of the blood over the selected blood-vessel cross section. As exhibited in Figs. 5-7, the superior performance of the modified cloud catheter in this regard is even more distinct at locations farther downstream from the catheter tip.
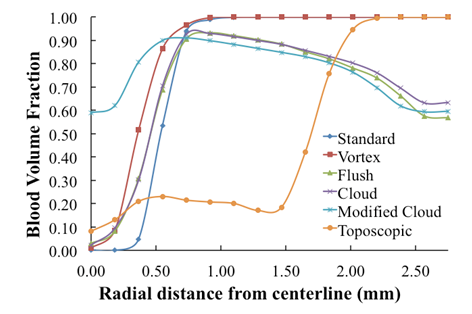 | Figure 4. Volume fraction of blood  plotted versus radial distance from the catheter centerline, at a distance 1 mm downstream of catheter tip plotted versus radial distance from the catheter centerline, at a distance 1 mm downstream of catheter tip |
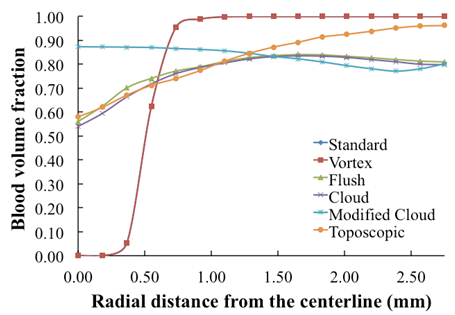
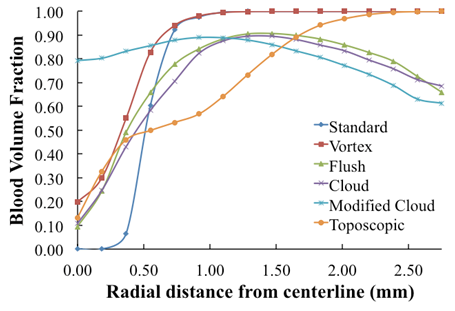 | Figure 5. Volume fraction of blood  plotted versus radial distance from the catheter centerline, at a distance5 mm downstreamof catheter tip plotted versus radial distance from the catheter centerline, at a distance5 mm downstreamof catheter tip |
4.3. Turbulence Effects
- To investigate the influence of injection flow rate on the spreading rate of the infused fluid, we considered three different injection flow rates, characterizing laminar, transition, and turbulent flow within the catheter. These flow rates are 1, 2.1 and 5 ml/s, respectfully. Lutzet al. [4] found enhanced mixing of the infused drug solution with blood with increased infusion rate. However, these investigators did not consider catheters with side holes, the performance of which is more sensitive to the injected-fluid flow rate, as demonstrated in the results of our study presented in Figs. 8-10. These plots show saline solution at simulation time of 0.025 s.
 | Figure 6. Volume fraction of blood  plotted versus radial distance from the catheter centerline, at a distance 10 mm downstream of catheter tip plotted versus radial distance from the catheter centerline, at a distance 10 mm downstream of catheter tip |
 | Figure 7. Volume fraction of blood  plotted versus radial distance from the catheter centerline, at a distance 20 mm downstream of catheter tip plotted versus radial distance from the catheter centerline, at a distance 20 mm downstream of catheter tip |
 | Figure 8. blood volume-fraction plotsfor laminar (top row: Re = 855), transitional (middle: Re = 1795) and turbulent (bottom: Re = 4244) saline-solution flow within the Standard & Vortex catheters |
 | Figure 9. blood volume-fraction plots for laminar (top row: Re = 855), transitional (middle: Re = 1795) and turbulent (bottom: Re = 4244) saline-solution flow within the Flush & Cloud catheters |
 | Figure 10. blood volume-fraction plots for laminar (top row: Re = 855), transitional (middle: Re = 1795) and turbulent (bottom: Re = 4274) saline-solution flow within the Modified-Cloud & Toposcopic catheters |
4.4. Viscous Effects
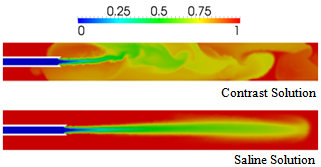
- To investigate the influence of viscosity on mixing and spreading of a drug infused into the blood vessel, the injection of Iopromide 370 was simulated as a contrast to hypertonic saline solution. The kinematic viscosity of Iopromide 370 is approximately five times that ofblood, while the kinematic viscosity of saline solution is half that of blood (c.f., Table 2). Therefore, in conjunction with the results presented above for saline-solution injection, simulations with Iopromide 370 will allow the comparison of results obtained for a drug solution that is significantly more viscous than the bloodstream flow with those obtained for a drug solution that is significantly less viscous than the bloodstream flow. For these comparisons, we will consider only the flush and vortex catheters (representative of catheters with and without side holes, respectively).Figure 11 shows a comparison of blood volume fractions predicted for contrast and saline-solution injection at the rate of 1 ml/s from a vortex catheter, at the simulation time of 0.07 s. It is found that the less-viscous saline solution spreads into the blood flow more effectively than the contrast solution (Iopromide 370). This result is consistent with the fact that the Reynolds number for the contrast-solution in the catheter is greater than that for saline, based on the difference in the viscosities of the two fluids. Figure 12 shows a comparison of blood volume fractions predicted for contrast and saline-solution injection at the rate of 1 ml/s from a flush catheter, at the simulation time of 0.03 s.In this case there is little difference between the spreading effectiveness of the two injected fluids downstream of the catheter tip, although the concentration of the injected fluid is significantly higher at the blood vessel wall upstream of the catheter tip, near the side holes, when the contrast solution is used. This is a consequence ofthe influence of the dynamic pressure of the blood flowing past the catheter side holes, which causes more stream-wise deflection of the less-viscous saline solution.
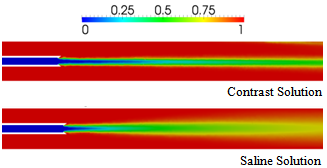 | Figure 11. Comparison of blood volume fractions predicted for contrast and saline-solution injection at the rate of 1 ml/s from a vortex catheter, at a time of 0.07s |
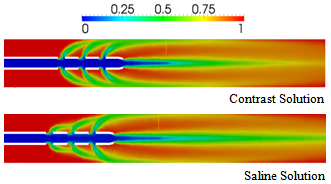 | Figure 12. Comparison of blood volume fractions predicted for contrast and saline-solution injection at the rate of 1 ml/s from a flush catheter, at a time of 0.03 s |
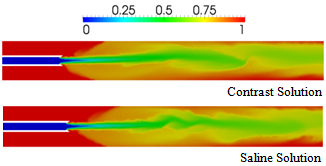 | Figure 13. Comparison of blood volume fractions predicted for contrast and saline-solution injection at the rate of 5 ml/s from a vortex catheter, at a time of 0.03 s |
 | Figure 14. Comparison of blood volume fractions predicted for saline (contrast) injection at the rate of 2.1 (21) ml/s from a vortex catheter, at a time of 0.03 s |
5. Conclusions
- In this study, we have investigated the mixing and spreading effectiveness of several catheter-tip geometries and the influence ofinjection-fluid viscosity, flow rateand turbulence transport. We employed an incompressible 3D, two-fluid, unsteady numerical formulation that fully accounts for turbulence effects using the realizable k-εturbulence model. The results of our simulations improve on the 2D results of Mongrain et al.[12] by providing a more detailed characterization of the dynamics of theinteraction between theinjected drug solutionand the blood flow. This greater detail allows ultimately for a determination of which catheter geometries provide the most effective spreading of the injected drug solution toward the blood-vessel wall and mixing of the injected drug solution with the blood.The vortex catheter was found to enhance mixing and spreading of the injected fluid beyond that of the standard catheter design. The toposcopic catheter is characterized bya low pressure near its tip that, which is associated with recirculation of the flow back toward the blood-vessel centerline. This type of catheter also provides enhanced mixing and spreading of the injected fluid over that of the standard catheter design. The addition of holes in the catheter wall, near its tip, was found to further enhance spreading andmixing, due to the direction of injected-fluid momentum directly toward the blood-vessel wall.Of the catheter designs with side holes considered, the modified cloud catheter (with additional, circumferentially staggered side holes of varying diameter) was found to provide the most effective spreading and mixing of the injected fluid for given injection-fluid flow rate and viscosity.
6. Discussion
- If the flow rateis too high, then a drug solution injected into the blood stream from a catheter with side holes may damage the blood-vessel wall. In fact, a higher risk of infection is found with the use of catheters with side holes for hemodialysis, in comparison with that found with catheters without side holes[17]. Not with standing this, side-hole catheters are the most efficient at spreading an injected drug solution to an area of interest within the blood vessel,for appropriate injection rates.In general, the spreading effectiveness of a catheter is ultimately determined by the flow rate of the injected fluidand is greatest at large flow rates. In addition, spreading and mixing with the surrounding bloodmay be substantially enhanced by turbulence transport. The viscosity of the injected fluid is important in determiningits flow rate, which is inversely proportional to the fluid viscosity, and whether or not it is turbulent. For a given pressure drop supplied across the catheter from inlet to exit, the flow rate within the catheter will be greatest with a low-viscosity fluid, which is also more likely than a higher-viscosity fluid to be turbulent within the catheter. However, the results of our simulations show also that the jet of injected fluid emanating from the catheter may be turbulent when the ratio of the injected-fluid viscosity is substantially larger than the viscosity ofblood, even when the fluid is laminar within the catheter.Finally, it should be noted that as blood-flow dynamics are inherently unsteady, future workshould consider time-dependent injection profiles and pulsating-blood flow, as well as non-Newtonian constitutive relations for blood.
ACKNOWLEDGEMENTS
- We are grateful for access to computational clusters provided by Professor Roger Davis at UC Davis.