Omer Hamid1, Alwaleed Abdelrahman2
1Department of Medical Equipment Technology, College of Applied Medical Sciences, Salman Bin Abdulaziz University Alkharj, Kindom of Saudi Arabia
2Department of Electronics Engineering and Technology. University of Gezira, 2667, Medani-20, Sudan
Correspondence to: Omer Hamid, Department of Medical Equipment Technology, College of Applied Medical Sciences, Salman Bin Abdulaziz University Alkharj, Kindom of Saudi Arabia.
| Email: |  |
Copyright © 2012 Scientific & Academic Publishing. All Rights Reserved.
Abstract
This work deals with detection of sub-lesions and major lesion in breast ultrasound (US) images. Most of the recent classification uses normal and abnormal breast images to develop their algorithm. The majority of the current algorithms are interested in the major lesion when detecting the lesion boundary. US images, in first step were roughly preprocessed and classified. A function based on classification parameters is used to select the best segmentation threshold. A Second involved step of US image processing includes: Linear and non-linear filtering, segmentation, morphology operations and lesion classification and detections. Seven gray intensity statistical features and 4(distances) x 22 gray level co-occurrence matrices (GLCM) texture features were calculated from segmented masses and background samples. Support vector machine (SVM) was implemented to classify the segmented suspicious masses features against the background and major lesion features. The GLCM features are reduced to 8, at distance 4, such that 93% of lesions were having classification greater than 80% versus the background. For 20 images one sub-lesion (satellite), on average, was detected beside the major lesion. The objective of the paper is to estimate the amount of features similarity between the major lesion and the sub-masses that could be segmented from the same image. The proposed algorithm would effectively help in the early detection of breast cancer.
Keywords:
Sub-mass Detection, Classification, Breast Lesion, Ultrasound Images
Cite this paper: Omer Hamid, Alwaleed Abdelrahman, Sub-Masses Detection in Malignant Breast Ultrasound Images, American Journal of Biomedical Engineering, Vol. 3 No. 3, 2013, pp. 49-53. doi: 10.5923/j.ajbe.20130303.01.
1. Introduction
Breast ultrasound scanning has become essential breast diagnosing tool because breast cancer is one of leading death in women[1]. Ultrasound imaging modality is used to find out the size, shape, texture and density of a breast lump. The use of ultrasound scan is recommended rather than mammography for young women[1]. Ultrasound scanning is flexible, harmless and with fewer hazards compared to mammography scanning, but due to the nature of ultrasound wave propagation and interaction with human tissues, it has inherent speckle noise, low contrast and resolution that limit automatic breast lesion segmentation. Noise cancellation algorithms encountered with some drawback such as reduced textures details and edge blurring. Rayleigh distribution has been proposed as a statistical model to describe speckle noise in ultrasound imaging[2], such distribution is associated with signal to noise ratio (SNR) of less than 1.92[3].GLCM, first introduced by Haralick et al[4], extracts second-order texture characteristics relevant to human vision and natural description of textures[5]. Gray level co-occurrence matrix (GLCM) calculates the pixel interrelation of pair of pixels (i) and (j) based on particular distance (e.g. 1, 2,..,n) in the four major directions (0o,45o,90o and 135o), the joint probability distribution is normalized and presented in matrices. Original GLCM suffers from the dimensionality problem and limited capability of capturing texture information at multiple scales[5]. GLCM is broadly implemented in image analysis because the second order statistics calculation ability to describe image texture features better than ordinary first order gray intensity statistics. More than twenty features descriptors can be generated using the GLCM technique approach; these features encourage remarkable number of researchers to use GLCM texture feature descriptors as analysis and classification tools. Mohd et al use the GLCM to classify breast masses in mammogram[6]. Hari et al implement GLCM and Gray level and Run Length Matrix to classify cyst and non cyst ultrasound images[7]. Babaghorbani et al, Vasantha et al and André Victor et al implement GLCM classification in breast ultrasound to distinguish between malignant and benign breast tumors[8][9][10]. Padmavasavi et al, use the co-occurrence matrices features in the determination of edge thresholds to enhance detection capability[11]. Lesions and satellites (sub-lesions) in ultrasound breast images were confirmed by MRI contrast studies[12]. In this article we have used classifications based on intensity distribution and texture descriptors in abnormal image analysis to find similarity between main lesion and suspected scattered masses. GLCM features were also used to determine the best level of thresholding in the first step of processing.
2. Method and Implementation
Ultrasound breast images CD data base[13] was used in this research. The sequence of the proposed algorithm consists of filtering processes, segmentation, morphology operations, lesion detection and classifications. This processing was executed in two steps. In the first step, US images were roughly pre-processed and classified using histogram equalization, filtering (Gaussian and median), segmentation, morphological operations[14], automatic background selection, first order statistics, GLCM feature extractions and SVM classifications. A variable threshold level is used and for each level a number of parameters were selected to work as inputs for a suggested function, the maximum of this function corresponds to the best threshold level for the second step. The image processing and manipulation were performed in MATLAB® environment. The second step involves: histogram equalization, linear and non-linear filtering (diffusion and median), segmentation, morphology operations, automatic background selection, first order statistics, GLCM feature extractions and SVM lesion classification. The threshold found in the first step was used in the segmentation of the second final processing step. The linear filtering, segmentation and the morphology operations and lesion detection are well described in[14]. A function was built from parameters obtained using first order statistics and GLCM feature SVM classifications, out of the 22 GLCM features we selected Homogeneity, Sum of average and Dissimilarity other parameters like boundary points (shape complexity parameter), lesion size and lesion standard deviation were also used in the following function (1):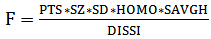 | (1) |
Where PTS ≡ Number of points making the boundary 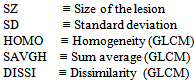 As the threshold level was varied, these parameters were recorded from the image analysis and classification. The function is plotted verses the threshold level as shown in Figure 1, for a typical image. The peak of the curve corresponds to the best threshold level for 20 US breast images. The segmentation has resulted in major lesion and sub-lesions. Statistical and GLCM features were extracted from the lesions and backgrounds. SVM classifications based on these features were implemented to distinguish lesions and sub-lesions from background and to show similarity among the lesions. Seven statistical features were used: skewness, kurtosis, standard deviation, variance, 3rd moment, 5th moment, and the entropy. Twenty two GLCM, features found for four distances and angles, but only eight of them were considered in the classification results: Dissimilarity, Energy, Entropy, Homogeneity Matlab, Homogeneity, Maximum probability, Sum of squares, Sum average. Babaghorbani et al[8] used the following GLCM features in their classifications: Autocorrelation, Correlation, Dissimilarity, Homogeneity, Maximum Probability, Sum Average, Difference Entropy and Inverse Difference Normalized.
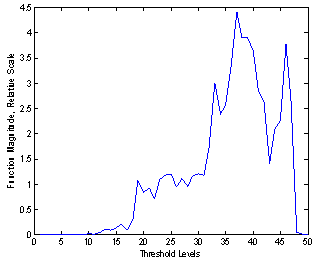 | Figure 1. Threshold function (F) plot. The peak of the function corresponds to the best threshold level of 37 |
3. Results and Discussion
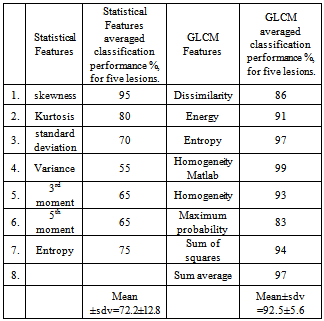
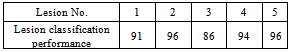
Twenty images from the data base[13] were used in this study. Half of these images have segmentation threshold values between 27.5 and 37.5, as depicted in the histogram of Figure 2. The results of the different stages of processing of a typical ultrasound breast image with lesions were shown in Figure 3, described as follows: the original US breast image, the enhanced image due to the filtering and the morphology operations[14], the binary segmented lesions aided by the curve of Figure 1, and major lesion of interest; bottom left. The sub-lesions were selected by the SVM classification. Two of the sub-lesions were rejected by the classifications, see Figure 4c. Statistical feature classifications, of lesions and background, were not impressive as GLCM classifications as given in table 1; we have averaged the classification performance for all the lesions. As seen from table 1, GLCM performs better. Figure 3c shows five segmented lesions. Gray level samples were selected at different locations within lesion and background normal tissues. Dissimilarity, Energy, Entropy, Homogeneity Matlab, Homogeneity, Maximum probability, Sum of squares, and Sum average; a total of 8 GLCM features were obtained for each lesion and background samples. SVM classification percentage performances of the 8 GLCM lesions’ features versus that of the 8 GLCM background features; were averaged and given below in table 2 for the five lesions.Table 1. Classification Performances Based on Statistical and GLCM features
 |
| |
|
Table 2. Performance of the Segmented Lesions (Masses)
 |
| |
|
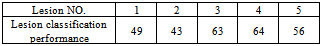
Lesion number 2 is the major lesion of interest (see Figure 4b). The mechanism of selecting major lesions was described in[14]. The results of table 2 indicate how the lesions are different from the background; four of the lesions differ from the background normal tissue by more than 90%. These high performance results actually have led us to investigate further the nature of these sub-masses. Also these results proof the correctness of our segmentation method and the validity of the function F given in equation 1.To estimate the spread of cancer tissue on the breast, we calculated the degree of similarity between the major lesion and the sub-masses. The code that generated table 2 is implemented in the same way to generate table 3. Referring to Figure 3, the major lesion of interest 8 GLCM features were compared to all five lesions 8 GLCM features, to find how they are similar. Again SVM classifications were used and the five lesions percentage (%) performances were averaged for all the eight, mentioned, GLCM features as given in table 3. Table 3. Performance of the Segmented Lesions (Masses)
 |
| |
|
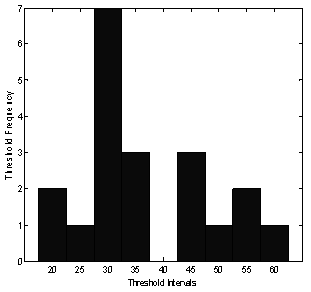 | Figure 2. A histogram of threshold levels. Number of images plotted versus thresholds |
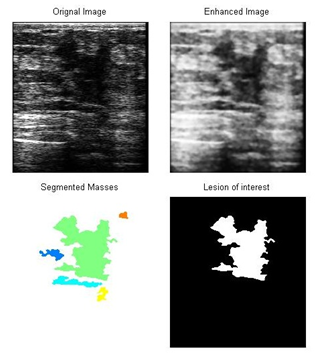 | Figure 3. Different stages of processing and selection of the major and sub-lesions: from top left a) original breast image, top right b) processed image, bottom left c) segmented lesion masses, bottom right d) major lesion of interest |
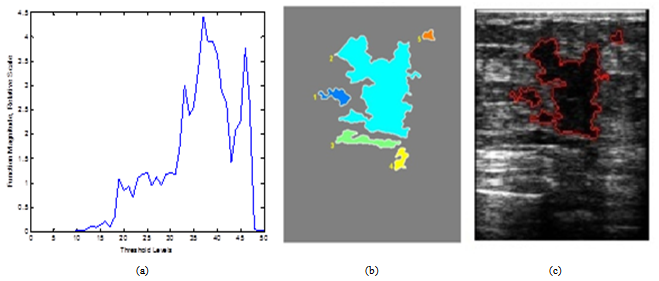 | Figure 4. Process of threshold optimization and similarity of the major lesion and sub-masses: from left to right, a) Thresholding curve, b) Five lesions of interest, c) Classified sub-lesions |
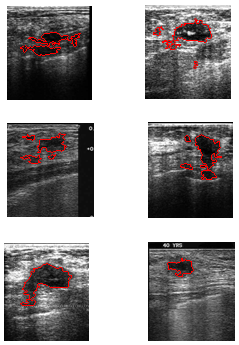 | Figure 5. Other samples of detected major and sub-lesions |
The results of table 3; indicate how the sub-lesions are similar to the major lesion of interest, the lower the performance percentages, the higher the similarity. We used the above results to select the suspected sub-lesions. Any lesion of percentage performance > 60 is rejected as a sub-lesion, so in Figure 4c example we have classified only two lesions beside the major lesion. Lesions No. 3 and 4 are rejected as sub-lesions in this classification. Notice that these rejected lesions, did fall in the major lesion shadow (see Figure 3a). Lesions No. 3 and 4 classifications resulted in higher performance percentages of 63 and 64 respectively, (low similarity) when compared to the major lesion. Other representative images with detected lesions, produced by our method, are shown in Figure 5.The classifications plotted in Figure 6 were produced by the program code that uses 8 GLCM features and SVM classifier.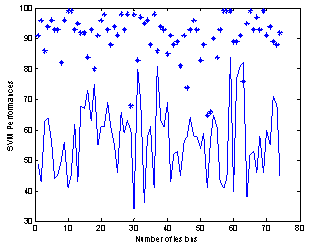 | Figure 6. Classification performance (%) of all suspected lesions versus background “*” and classification performance (%) of sub-lesions versus major lesion “continuous line” |
The SVM classifications of all lesions’ performances (74 lesions in 20 images) against background of normal tissues, (labeled *) and sub-lesions classified against major lesions of the twenty images (continuous line), are plotted together as shown in Figure 6, with obvious contrast between the two plots. It is seen that the lesion classifications against the background are quite high as shown earlier in table 2 for one image, and it is true here for almost 20 images. The results of Figure 6 show that 93% of lesions were having classification performance greater than 80% versus the normal tissues which indicate most of major and sub-lesions are completely different from the normal tissues. In theory the classifications of major lesions versus sub-lesions are expected to be much lower and the continuous line plot in Figure 6, just prove that, as already confirmed by table 3 results for one image. The classification of sub-lesions in 20 images against major lesions, showed that out of a total of 74 lesions only 44 lesions were considered having similar features and completely different from the background (see the bottom graph in Figure 6). Out of the 44 lesions, 20 are the major lesions and 24 were the sub-lesions or an average of one sub-lesion (satellite) per image, and this is due to the 60% border line we used and explained earlier.
4. Conclusions
The article was proposed to study the features similarity between major lesion and sub-lesions in breast ultrasound image. The developed algorithms consist of two stages, the first stage uses an equation to find the best segmentation threshold, and the second stage is used to classify the segmented masses based on the level of similarity of the sub-masses and the lesion of interest. The article demonstrates automatic background and breast lesion SVM classifications. Ninety three percent of lesions were having classification greater than 80% versus the background. For 20 images one sub-lesion (satellite), on average, was detected beside the major lesion. The proposed algorithm was implemented in registered breast lesion images. The new classification technique implementation presented in this article is useful in assessment and monitoring of lesion treatment progress.
References
| [1] | Breast cancer, Understanding Breast Cancer Risk http://www.breastcancer.org/risk/understanding.jsp. Jan. 2013. |
| [2] | Robert F. Wagner, Stephen w. Smith, john m. Sandrik, and hector Lopez "Statistics of speckle in ultrasound b-scans" IEEE transactions on Sonics and ultrasonic, vol. 30, no. 3, may 1983. |
| [3] | S. Kalaivani Narayanan and R. S. D. Wahidabanu "A View on Despeckling in Ultrasound Imaging" Image Processing and Pattern Recognition. Vol. 2, No.3, September 2009. |
| [4] | R. M. Haralick, K. Shanmugam and I. Dinstein, “Textural features for image classification," IEEE Trans. Syst. Man Cybern. SMC-3 (1973) 610-621. |
| [5] | R. F. Walker, P. T. Jackway and I. D. Longstaff, “Genetic algorithm optimization of adaptive multi-scale GLCM features” Int. J. Patt. Recogn. Artif. Intell. (2003) 17:17-39. |
| [6] | A Mohd. Khuzi, BEng, R Besar, WMD Wan Zaki, MEngSc, NN Ahmad ” Identification of masses in digital mammogram using gray level co-occurrence matrices” Biomed Imaging Interv J 2009; 5(3):e17 |
| [7] | Hari, Wibawanto, Adhi Susanto, Thomas Sri Widodo and S. Maesadji Tjokronegoro ”Discriminating Cystic and Non Cystic Mass using GLCM and GLRLM-based Texture Features” International Journal of Electronic Engineering Research ISSN 0975 - 6450 Volume 2 Number 4 (2010) pp. 569–580. |
| [8] | P. Babaghorbani, AR. Ghassemi , S. Parvaneh and K. Manshai” Sonography Images for Breast Cancer Texture classification in Diagnosis of Malignant or Benign Tumors” in 4th International Conference on Bioinformatics and Biomedical Engineering (iCBBE),2010978-1-4244-4713-8/10/$25.00 ©2010 IEEE. |
| [9] | M.vasantha, v.subbiah bharathi, dhamodharan”Medical Image Feature, Extraction, Selection And Classification” International Journal of Engineering Science and Technology Vol. 2(6), 2010, 2071-2076. |
| [10] | André Victor Alvarenga,a Wagner C. A. Pereira,b and Antonio Fernando C. Infantosic and Carolina M. Azevedo ”Complexity curve and grey level co-occurrence matrix in the texture evaluation of breast tumor on ultrasound images” Med. Phys. 34 ,2, February 2007 0094-2405/2007/34„2…/379/9. |
| [11] | K. Padmavasavi, N. Udaya Kumar, E. V. Krishna Rao, M. MadhaviLatha” Performance Evaluation of Adaptive Statistical Thresholding Based Edge Detection Using GLCM in Wavelet Domain under Noisy Conditions” ICGST-GVIP Journal, Volume 10, Issue 3, August 2010. |
| [12] | Sangeetha Sundararajan, Eriko Tohno, Hiroshi Kamma, Ei Ueno, and Manabu Minami “Detection of Intraductal Component around Invasive Breast Cancer Using Ultrasound: Correlation with MRI and Histopathological Findings” Radiation Medicine: Vol. 24 No. 2, 108–114 p.p., 2006. |
| [13] | Breast–ultrasound CD.ROM database, http://www.breastultrasound.com/enindex.cfm. Feb.2010. |
| [14] | Abdelrahman A. and Hamid O. Lesion boundary detection in ultrasound breast images. IEEE Proceeding of the first Middle East Conference on Biomedical Engineering MECBME’11), Sharjah, UAE, Feb. 22-25, 2011. |
 Abstract
 Reference
 Full-Text PDF
 Full-text HTML