Akin Cellatoglu1, Karuppanan Balasubramanian2
1Dept. of Comp. Engg., European Univ of Lefke, Turkish Republic of Northern Cyprus, Mersin-10, Turkey
2Dept. of EE. Engg., European Univ of Lefke, Turkish Republic of Northern Cyprus, Mersin-10, Turkey
Correspondence to: Karuppanan Balasubramanian, Dept. of EE. Engg., European Univ of Lefke, Turkish Republic of Northern Cyprus, Mersin-10, Turkey.
| Email: |  |
Copyright © 2012 Scientific & Academic Publishing. All Rights Reserved.
Abstract
The p-Wave Locked Loop provides instantaneously the p to p time interval of the applied ECG and enables us to perform heart rate variability studies on the basis of p_p variation. The first version of the PWLL started its processing action with the determination of r-wave first and waited for the user to operate manually a switch to transfer its action for detecting p-wave and then locking to its variation. In the next version of the PWLL the changeover was made in the circuit itself after a prefixed time. Nevertheless, for certain p_p variation of severe heart patients the duration might be quite a long and the prefixed delay for changeover might fail to lock. In this improved version of the PWLL, the time duration for changing over to p_p is made dependent on p_p itself. Therefore, the locking time is dynamic which depends on the nature of p_p variation of the ECG input. If unlocking happens due to erratic nature of the ECG it would again lock quickly and the relocking time is estimated based on circuit components and devices. Besides the improvement in locking features, improvements in other performance characteristics of the PWLL are proposed and analyzed. A nearly ideal PWLL is emulated and the responses of the practical PWLL and emulated PWLL are compared and analyzed as to help in reaching optimum hardware parameters. This performance improved PWLL would enable to ease further the heart rate variability studies.
Keywords:
Heart Rate Variability, P-wave Detection, P_P Sequence , Unlocking PWLL
Cite this paper: Akin Cellatoglu, Karuppanan Balasubramanian, Improvements in the Design and Performance of PWLL, American Journal of Biomedical Engineering, Vol. 3 No. 2, 2013, pp. 41-48. doi: 10.5923/j.ajbe.20130302.02.
1. Introduction
Heart rate variability studies performed in cardiac health and research centres have been helpful in analysing the heart diseases of the patients so as to diagnose the seriousness of illness needed for taking appropriate treatment. The heart rate variability studies made on the consistency of p-wave interval in ECG has given more promising results in the diagnosis of heart diseases. As the p-wave occurs first in the ECG, the pumping mechanism of heart is better revealed by the p-wave[1, 2]. Since the p-wave is relatively a small part in time and in amplitude in the cardiac waveform it is more difficult to separate it from the rest of the ECG cycle. In the past an electronic device to separate the p-wave from the rest of waves of ECG was reported[3]. As it was not locking with the applied ECG for p–wave a PWLL (p-wave Locked Loop) was synthesized and reported[4-6]. The first PWLL reported locked itself with the p-wave of the ECG but needed a manual changeover operation for locking to take place. The second versions of the PWLL[7] has made the change over for p-wave for automatic locking after a set predetermined time. Further minor modifications were made in that version [8] for improving its characteristics a bit further. Now we make additional improvements in the PWLL circuit which performs quick catching of locking from unlocking instants necessitated by erratic behaviour of p-to-p variation in the ECG. Therefore, the PWLL gets locked to the p-wave as quickly as possible. Moreover, the design parameters of the PWLL are set according to system theory.
2. Structure and Circuit of PWLL with Improvement
The block schematic of the p-Wave Locked Loop incorporating the improved design features is shown in Figure 1. The PWLL needs analogue ECG input for generating the locking conditions of p-wave that provides the p_p interval in both analogue and digital form. From the analogue ECG signal input the r-wave is detected in PWLL by threshold comparison and the proximity of the occurrence of the next p-wave is time slotted as a window. In this process, the time window predicting the expected time location of p-wave is fixed and the p-wave arising as a part of the ECG in this window is amplified to a greater extent. The PWLL gets locked to p-wave shortly and provides p_p time in binary and analogue form. The circuit of PWLL with improved design is shown in Figure 2. The design parameters are set according to the system theory and the changeover time from r_r to p_p locking is made automatic ensuring of a minimal time lapse. Catching the p-wave and locking to it takes a bit time in accordance with the nature of variations of p_p.The sliding window for p-wave detection is set with two monostable multivibrators (MSMV1 and MSMV2) and EXOR gate. The ECG is amplified (A1) and compared (C1) with a threshold as to detect r-wave for triggering the monostable multivibrators. The pulsing periods of the monostables are controlled by the resistance and capacitance extended to them. Each resistance is programmable with the use of FET extended to it. The gate drive changes its RdsON and the resistance extended to monostables. Therefore, each FET works as a voltage controlled resistor.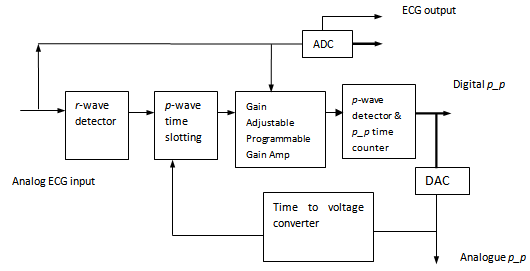 | Figure 1. Functional Block Diagram of the PWLL |
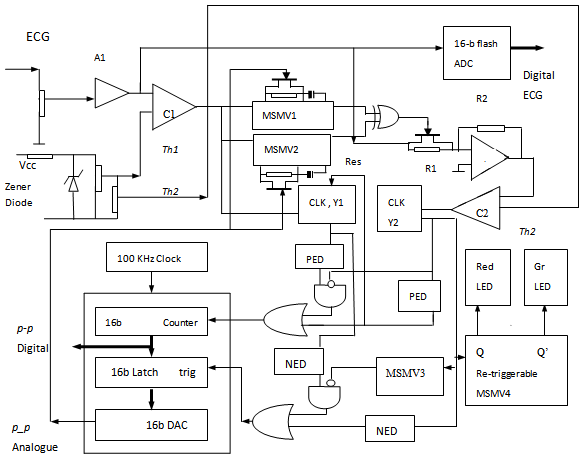 | Figure 2. Circuit Schematic of Performance Improved PWLL |
The programmable gain amplifier (PGA) amplifies (A2) the low amplitude p-wave to a larger value like r-wave as the gain set during this time slot with the concerned FET would be high. The amplified p-wave is then threshold detected and processed in a binary counter as to determine time interval between successive p-waves and presented as binary p_p output. This binary p_p is converted into analogue form with a DAC (Digital to Analogue Converter) and this is also presented as another output. This analogue p_p is used to adjust the next p-wave time slot window as to place it in the expected time position of the incoming p-wave. The time slot therefore adjusts automatically with the present value of p_p. Depending upon the circuit conditions the threshold setting is adjustable with external input. Precision setting of the threshold voltages Th1 and Th2 are performed with a Zener diode and potentiometers shown. The r-wave clocks a flip flop Y2 and the p-wave clocks the flip flop Y1. Initially Y2 controls the reset input of the counter and trigger input of the latch. After catching the p-wave Y1 takes charge of these activities.Simple edge detectors using NAND gates[9] performing as the Positive Edge Detector (PED) and Negative Edge Detector (NED) circuits are used in the PWLL. The monostable MSMV3 extends Y2 period to such an extent as to avoid the retriggering of the latch by Y2. As the p-wave occurs first in the ECG, once it is caught it resets Y2 as to begin its waveform. Figure 3 shows the timing diagram illustrating various activities in PWLL. In this example, after the lapse of two r-waves the p-wave is caught. If in case p-wave location identification takes a few cycles of ECG, monitoring of r-wave will be continuing until the catching instant of p-wave. In these transition circumstances the counter would produce the r_r count. The p_p locking is indicated by a RED LED and working with r_r is denoted by green LED. Its drive is materialized with a re-triggerable monostable MSMV4 shown in Figure 2.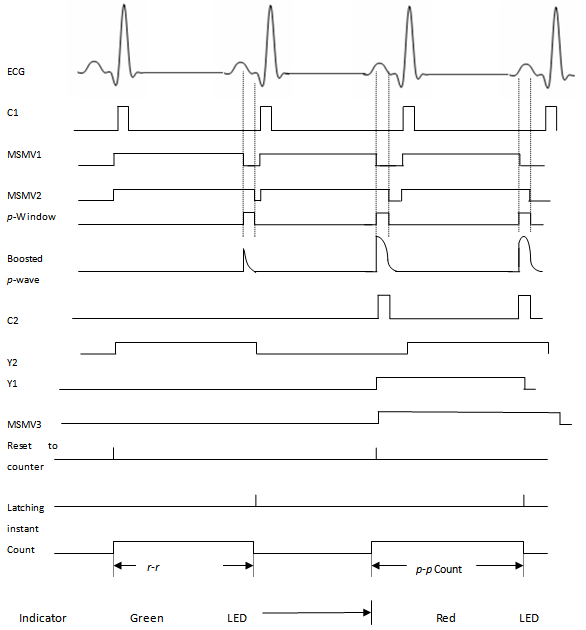 | Figure 3. Timing Diagram |
The analogue ECG input given to PWLL is digitized with a 16-b flash ADC (Analogue to Digital Converter) built under advanced architecture[10] and the binary form of the ECG is also made available for further processing and display operations that may be required.
2.1. Time Relations for p-p Locking
The conventional PLL[11] works entirely in a different approach. It has a definite frequency range for locking to take place with the applied signal. Unlike PLL, the input to PWLL is always the ECG and it ensures locking with p-wave for any shape of ECG. Nevertheless, the locking time with p-wave differs from one pattern of ECG than the other.The time between successive r_r represented as  is given by
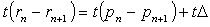 | (1) |
where  is small compared to other two terms and is of subjective nature depending on the pattern of the ECG.Time between the r-wave and instantaneous p-window after locking is
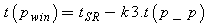 | (2) |
where  is the standard time set with monostable multivibrators when FET drive is absent. This is preset with the average value of the r_r time. The parameter
  is a constant depending on the characteristics of the devices used.Likewise, the p-window time before locking is
 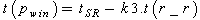 | (3) |
The time periods  and
and  depend on the nature of ECG providing the intervals of successive r-wave and p-wave.Locating the p-window and boosting the p-wave is performed with monostables, FETs and PGA. If the ON resistance of the drain to source, (RdsON) of the FET connected across the resistor R1 of the PGA is rp then the gain at the instant of window time would be
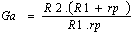 | (4) |
This Ga can be set to a value around 20 such as to make the p-wave to reach the amplitude level of standard r-wave.
3. System Modeling and Design Considerations
3.1. System Modelling
Based on the actions performed in the PWLL it is modeled as a system and its block diagram is shown in Figure 4. The window slotting and obtaining the p window is modeled as K2/(s+a). The parameters K2 and a depend on the device parameter RdsON of the FET and the circuit components such as the resistors and the capacitors used. Getting p_p count from the p-window is modeled as an integrator (1/s). The p_p is made available in both binary and analogue form.With a potentiometer action the analogue p_p acts as error signal Δrp to the FET extended to the MSMV. This in turn slips from r-wave detected into p-wave slotting action termed as r_p. Accordingly, the transfer function of the PWLL is evolved as follows.The functional unit representing p_p finder is denoted to have a gain factor G and has its representation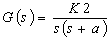 | (5) |
With unity feedback the overall transfer function of the PWLL, Gf, is given by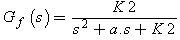 | (6) |
As known | (7) |
and | (8) |
where  is damping constant and
  is natural frequency of oscillations. The roots of the characteristic equation would be
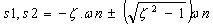 | (9) |
 | Figure 4. System Model of the PWLL |
3.2. Analysis Tools for PWLL
The PWLL circuit with the above transfer function with second order characteristic equation can be analyzed as to assess its static and dynamic performances. As in conventional approaches, Bode plots and polar plots can be made as to provide the basis for further analysis.
3.2.1. Stability Analysis
In time domain analysis Routh-Hurwitz and Root-locus methods are applied[12] as to determine the stability. Another popular approach is Nyquist stability criterion that determines the stability of the closed loop transfer function Gf (jw) from the open loop transfer function G (jw).In order to ensure stability, if required, lead compensation and lag compensation techniques could be applied by appropriate use of op-amp with capacitors and resistors incorporated at the selected parts of the circuit introducing additional poles or zeros.
3.3. Design Considerations of PWLL
In an attempt to avoid oscillations in PWLL we set the damping factor ζ to be kept at unity. The practical PWLL needs first the range of r_r and p_p encountered in practice as to decide the p-window delay. They are decided based on the statistical information available in practice with ECGs of various kinds of heart diseases. Accordingly the FETs used for controlling the time factors through their resistors and capacitors are designed and fixed. This would set the values of the constants K2 and a controlling the transfer from r_r to p_p.
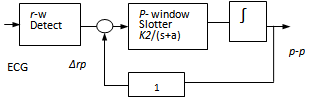
4. Test Setup with the Emulated PWLL and Performance Analysis
The main electronic devices and circuits used in PWLL are programmable gain amplifier, monostable multivibrators, binary counter, ADC, DAC, logic gates, flip flops and analogue comparators. The loop gain and locking range are affected by the characteristics and operating ranges of these electronic devices. The PWLL is synthesized based on the requirements satisfying the system theory and put into use.In order to assess the performance of the PWLL we need to provide the ECG input of varied nature and standards collected from different clauses of heart patients. They have p_p intervals changing progressively and also abruptly. Also the magnitudes and shape of p-wave might have variations. The practical ECG recorded from a standard ECG instrument is saved and loaded in the EPROM of the test setup for experimentation.The experimental setup which provides these features for experimentation is shown in Figure 5. It has two parts. The first part is programmable ECG generator (PEG) and the second part is PWLL analyzer. The ECG obtained from PEG is applied to the PWLL. The analyzer is a computer (laptop or PC) where the PWLL emulator package is loaded. The analyzer receives the p_p data from the PEG and also from the emulator. The emulator is producing optimal p_p data describing about the catching of p-wave and locking nature and its variations. The analyzer package performs the comparison of these two data in real time and produces the message accordingly. The main output of analyzer would be the differences in catching time of p-wave from reset conditions, unlocking instants, if any, p_p variations, variances of p_p and standard deviations in p_p.The emulator package is developed on the circuit maker[13] platform which could receive the external ECG in real time mode. Most devices and components used are commonly available in practice. The output from the emulator is captured and saved in a block of memory on FIFO basis.The PEG works on lookup table approach. Digitized samples of various patterns of ECGs are stored in EPROM in page wise. Each pattern of ECG has 4K samples covering 10 complete cycles of it. With twin 64K EPROMs, 16 ECG patterns are loaded and used. The EPROM therefore has 16-b address and 16-b data. A pattern available in a page is selected externally by setting four most significant address bits of the EPROM.A 12-b binary counter extended to least significant 12 bits of EPROM accesses sequentially the locations of the selected page. This arrangement would read the 4K samples successively to DAC as to get analogue ECG waveform from the DAC. While running it repeats the action cyclically and produces analogue ECG continuously. This is further added with random noise generator of chosen amplitude as to get the noise infected ECG and this is driven to the PWLL. The voltage level of the noise is kept slightly lower than the magnitude of standard p-wave. This noise induction is needed to account for any error in shape or jitter in waveform generated by the ECG instruments used in practice. | Figure 5. Block Diagram of Experimental Setup |
A Voltage Controlled Oscillator (VCO) supplies the clock to the binary counter. This could control the addressing rate of the EPROM as to produce the analogue ECG with various time periods of the cycle. By controlling the analogue voltage input to the VCO we can vary the clock frequency and produce analogue ECG of the same pattern with different time ranges. There are three signal inputs extended to the VCO and one of them is selected at any instant of testing. With this arrangement different clauses of ECG of the same pattern could be generated for the extensive analysis.The VCO producing a pulse train used as clock to the counter is of the modified version of the VCO reported[14] earlier. The simplified schematic of the VCO is shown in Figure 6. The clock frequency for the VCO is provided from an Astable Multivibrator. The frequency of the output is a divided version of the input frequency by a factor of ‘n’ set in the range of 2 to 64. The controlling analogue input is given to 6-b ADC and this sets the binary reference for the counter to reach its termination. Whenever the counter reaches the binary word set by ADC the coincidence circuit gets a trigger pulse for MSMV and also resets the counter as to start the fresh count. Therefore the MSMV produces one pulse for every triggering and its frequency would be divided by the factor of ‘n’ set in the ADC.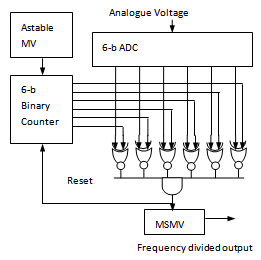 | Figure 6. Programmable VCO |
If fa is the frequency of astable multivibrator then the frequency fo of the output at MSMV is | (10) |
where n is the decimal value of the digital word set in the ADC.
4.1. Tests and Analysis Performed
Although different types of experiments could be conducted with the test setup the primary experiments conducted in time domain and frequency domain are briefly presented here.
4.1.1. Time Domain Analysis
The following time domain analysis tasks are performed.
4.1.1.1. Locking Time and Unlocking Instants
The emulator PWLL is set for optimal performance expected from it. The p-p range inherent in the ECG is varied with the inputs applied to the PEG and the locking time, p_p variations and unlocking instants are recorded from the test PWLL and also from emulated PWLL. The differences in these two results are computed and provided sequentially. The emulator PWLL allows the user to change the electronic devices used in it while testing. With the results provided by the analyzer we can fix the optimal parameters for the electronic devices used in the PWLL. Figure 7 shows locking and unlocking instants of the PWLL when a step variation in r_r is set with the ECG and applied as input to PWLL. Both the previous version of the PWLL denoted as ver2 and the present version denoted as ver3 are attempted in the experimentation. The setting of r_r in the stored data of ECG to a value would make change in p_p accordingly. The r_r is fixed initially with a standard value indicated as unity and then the time scale is doubled suddenly making the r_r magnitude to become twice that of the standard value. The PWLL of ver2 got locked relatively in a longer period as indicated whereas ver3 PWLL has shown shorter time in locking with p-wave. It is also to be noted that when the magnitude of r_r was high such as twice of its normal average value the PWLL was found unable to catch and lock with p-wave since locating the window close to the succeeding p-wave was not successful. Under these circumstances, the glowing of green LED would denote that the r-r sequence has been provided by the PWLL instead of the p-p sequence. 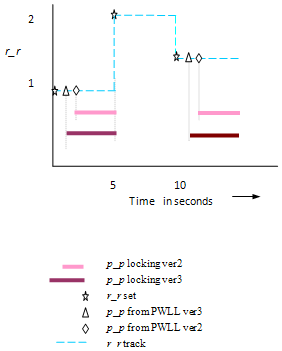 | Figure 7. Locking and Unlocking Tracks |
4.1.1.2. Analysis on p_p Variations in Time
Continuous monitoring of the p_p variations would enable us to make a diagnosis of heart diseases. Also other desired parameters such as variance, standard deviation and autocorrelation are computed and results are provided at regular intervals. A computation on cross correlation of p_p time sequence of test PWLL and emulated PWLL is also performed as to make quick comparison of test PWLL with emulated PWLL. With these data diagnosis is made for the possible heart disease as per the diagnosis procedures by looking at the variations of these data and parameters. The diagnosis made could be checked with the heart illness of the patient whose ECG pattern was selected and used for the analysis.
4.1.2. Spectral Analysis
Spectral analysis is another tool employed for diagnosis purposes. Here again there are two purposes for the analysis.
4.1.2.1. Spectral Test for PWLL
In the test setup the p_p variation is made with VCO input by driving appropriate waveforms. The p_p data sequence obtained at test PWLL and the emulated PWLL are applied to FFT algorithm for obtaining the spectral contents. The differences in these two spectral contents are computed in the analysis package. This would be another measure to assess the performance of the test PWLL as to tune its parameters and constants involved in the hardware devices.
4.1.2.2. Spectral Test for Diagnosis
Like the time domain analysis of p_p we can perform the spectral analysis of the p_p variations by computing the FFTs (Fast Fourier Transform) and from their nature a diagnosis could be made for the heart disease involved. This could be checked up with the disease of the original ECG as to confirm the prediction.
5. Conclusions
The modifications made in the circuit of PWLL include the precision setting of the threshold voltages and incorporation of some logic gates. The PEG used in the test and analysis setup is capable of generating wide ranges of artificial ECGs from the basic patterns of heart patients recorded. The VCO used in PEG helps changing the time scale of the waveform generated and therefore yields multiple patterns from single storage. With the analysis software we can extract the optimum parameters needed for the PWLL design.The heart rate variability studies performed with p_p variation would find more promising diagnosis and results and the proposed performance improved PWLL would simplify this task. Extensive analysis reports made on r_r variations are available in cardiac analysis centres. All extensive analysis performed in heart rate variability studies with r_r interval could easily be re-examined and analysed with p-p interval.The variation in p_p in PWLL, by and large, would be gradual and smooth and therefore the locking of p_p persists. If in case a sudden variation of successive p_p happens then this would give a chance of breaking the lock momentarily. Nevertheless, the p-window would adjust its relocation and it would catch again the p-wave and get locked to it shortly.The emulated PWLL has built in characteristics of nearly ideal behaviour. The analysis test scheme helps assessing systematically the performance of the synthesized PWLL with emulated ones and provides optimal circuit parameters to reach the design specifications. Therefore, performance improved PWLL concedes the data to cardiologists for correct diagnosis of heart diseases. This PWLL could be easily embedded with any ECG instrument as to provide the p_p sequence also.
References
| [1] | Kawachi I, Colditz GA, Ascherio A, Rimm EB, Giovannucci E, Stampfer MJ and Willett WC, “Prospect study of phobic anxiety and risk of coronary heart disease”, Circulation, Vol. 89, 1994. |
| [2] | Kristal-Boneh E, Raifel M, Froom P and Ribak J, “Heart rate variability in health and disease”, Scan J Work Environ Health, Vol.21, pp. 85-95, 1995. |
| [3] | K.Balasubramanian, “Separating p-waves in cardiac waveforms”, Electronics World, Vol. 104, pp. 475, 1998. |
| [4] | K.Balasubramanian and A.Cellatoglu, “PWLL, the P-wave Locked Loop: A Proposed Design”, Proceedings of the 40th IEEE Southeastern Symposium on System theory, New Orleans, LA,USA, Mar 2008, pp 141-145. |
| [5] | K.Balasubramanian and A.Cellatoglu, “Applying Analysis Tools of Heart Rate Variability Upon Determining P-wave Interval of ECG”, Proceedings of the 2008 IEEE International Instrumentation and Measurement Technology conference, British Columbia, Canada, May 2008, pp 1637-1642. |
| [6] | K. Balasubramanian and A. Cellatoglu, “Intensive Analysis of Heart Rate Variability based on P-P Interval Monitoring ”, Proceedings of the Second International Conference on Signal and Image Processing, Mysore, Aug 2009, pp-461-465. |
| [7] | A.Cellatoglu and K. Balasubramanian, “Performance Analysis of PWLL, the p-Wave Locked Loop”, Abstracts of the 10th Biological Congress on Promising Faces of Biotechnology, Rasipuram, Jan 2011, Pap OP-162, pp 133. |
| [8] | A.Cellatoglu and K.Balasubramanian, “Improving the Performance Characteristics of PWLL”, Proceedings of the 2012 International Conference on Advances in Computing and Communications, Cochin, Kerala, Aug 2012, pp 251-254. |
| [9] | K.Balasubramanian, “Harmonic Phase Angle and Power Factor Measurement”, Electronics World, Vol 114, Issue 1866, June 2008, pp 40-42. |
| [10] | K.Balasubramanian, “On the design and development of high performance ADCs”, Journal of AMSE-Modelling Measurement and Control, A-series, France, 2003, Vol 76, No. 3, pp 35-48. |
| [11] | National Semiconductors data sheet, 2013. http://www.datasheetcatalog.org/datasheet/nationalsemiconductor/DS007853.PDF retrieval date 19 March 2013. |
| [12] | R.Ananda Natarajan and P.Ramesh Babu, Control Systems Engineering , SCITECH Publications, Chennai, 2005. |
| [13] | http://my.ece.ucsb.edu/York/Bobsclass/2C/Simulation/circuit_maker.htm retrieval date 19 March 2013. |
| [14] | A.Cellatoglu and K.Balasubramanian, “Dual Diaphragm based Mechatronic Pressure Cell with Optical Pickup and Inductive Pickup”, Proceedings of the International conference on Modern Trends in Instrumentation and Control, Coimbatore, Sep 2011, pp 22-27. |
 Abstract
 Reference
 Full-Text PDF
 Full-text HTML