Seyed Navid Resalat, Seyed Kamaledin Setarehdan
Control and Intelligent Processing Center of Excellence, School of Electrical and Computer Engineering, College of Engineering, University of Tehran, Tehran, Iran
Correspondence to: Seyed Kamaledin Setarehdan, Control and Intelligent Processing Center of Excellence, School of Electrical and Computer Engineering, College of Engineering, University of Tehran, Tehran, Iran.
| Email: |  |
Copyright © 2012 Scientific & Academic Publishing. All Rights Reserved.
Abstract
Brain Computer Interfacing systems provide a new communication channel for disabled people. Among the many different types of the BCI systems, the Steady State Visual Evoked Potential (SSVEP) based ones has attracted more attention due to its ease of use and signal processing. SSVEPs are usually recorded from the occipital lobe of the brain when the subject is looking at a twinkling light source. Following our previous report[10], a novel set of features along with a new high-speed classifier are introduced and used in this work. These used for SSVEP classification elicited by LED light sources separated by D = 4, 14, 24, 44 and 64 cm from each other while the LEDs’ plane was located 60 cm away from the subject's eyes. Using various SSVEP sweep lengths, the results show that the LDA and SVM classifiers outperform the other method used when applied to 0.5 and 1-second sweep lengths and to 2 and 3-second sweep lengths respectively. The Max classifier needs, however, longer sweep lengths but with a comparable Information Transfer Rate (ITR). In addition, for D=44 cm and D=64 cm the algorithm could produce the highest accuracy rate of 90% and 92% respectively compared to the other distances. Also, the performance of the proposed algorithm for D=4 cm is not acceptable (p-value<0.001). Finally, it was showed that the sweep length of 0.5 second could provide a more practical online ITR.
Keywords:
Brain Computer interface (BCI), Steady State Visual Evoked Potential (SSVEP), Inter-source distance, Power Spectral Density (PSD), Student’s t-distribution, Information Transfer Rate (ITR)
Cite this paper: Seyed Navid Resalat, Seyed Kamaledin Setarehdan, An Improved SSVEP Based BCI System Using Frequency Domain Feature Classification, American Journal of Biomedical Engineering, Vol. 3 No. 1, 2013, pp. 1-8. doi: 10.5923/j.ajbe.20130301.01.
1. Introduction
A Brain Computer Interfacing (BCI) system is a communication channel that could assist and increase the performance of both disabled and normal people. In a BCI system, the brain activities are recorded from the scalp and coded to appropriate external control commands[1]. Some modalities used for brain activity recording in BCI applications are Electroencephalography (EEG), magneto - encephalography, functional magnetic resonance imaging and near infrared spectroscopy[2]. However, due to its ease of utility and better temporal resolution the EEG is mostly used in BCI systems. The EEG-based BCI systems can be divided into two main categories according to the type of the EEG signals used. These are spontaneous signals and evoked potentials which can be recorded from different areas of the scalp[3]. The spontaneous EEG signals are generated in the brain when the subject is intentionally performing a mental task such as adding/subtracting numbers, imaginary rotating a cube, imagination of limb’s movement, etc. Hence, Motor Imagery (MI), Mental Tasks (MT) and Slow cortical Potential (SCT) based methods are included in this class[4]. In comparison, evoked potentials are produced when an external stimulus changes the current state of the brain and therefore the property of the corresponding recorded EEGs. P300 and Visual Evoked Potentials (VEPs) are classified in this category[5]. Among the different types of VEP-based BCI systems, the Steady State Visual Evoked Potentials (SSVEP) are mostly used in recent years as it needs simpler processing of the corresponding EEG[6-8]. SSVEP is generated in the EEG when an external light source with a constant twinkling frequency provokes the visual field. Then the effect would be appeared in the vision region of the brain which is in the occipital lobe. Recording the EEG from that region, one could extract the SSVEP with the same frequency of the external twinkling light source and its harmonics[9]. For example, if the twinkling frequency is set to 10 Hz, then the corresponding EEG contains main components of 10 Hz and its harmonics of 20 Hz, 30 Hz, and so on. However, the amplitudes of the SSVEPs in higher than the second harmonic are so low that are difficult to detect[10].There are many studies on the SSVEP-based BCI systems in the literature. Bin et al. in 2009 designed an online nine-channel BCI system with 6 targets using Liquid Crystal Display (LCD) in window length of 2 seconds with a canonical correlation analysis method for frequency detection[11]. Lee et al. in 2011 presented a study of the effects of the different duty cycles of the external light source using a LCD in a given frequency of 13.16 Hz on the performance of a SSVEP-based BCI system[12]. Muller et al. in 2011 designed a BCI system with the external twinkling frequency above 30 Hz using the LCD with the decision tree classification which is updated in every second[13]. Wu et al. in 2008 investigated the different types of the external light source generators and revealed that the amplitudes of the SSVEPs generated by Light Emitting Diodes (LEDs) are higher than those generated by LCD or Cathode Ray Tube (CRT)[14]. In our recently published article in 2012, we investigated the effect of the different inter-source distances of the external LED light sources on the performance of the SSVEP-BCI systems using autoregressive coefficients[10]. The results showed that the performance of the algorithm can be improved using more sophisticated feature extraction method. In order to do so, and also to increase the data transfer rate the Power Spectral Density (PSD) is considered for feature extraction along with the four different classifiers of Linear Discriminant Analysis (LDA), Support Vector Machine (SVM), Naïve-Bayes and the high-speed Max classifier in this paper. The latter will be shown to be the best choice in real time applications. Moreover, different sweep lengths and Information Transfer Rate (ITR) is investigated to determine the optimum window length of the EEG data within an appropriate accuracy rate.In continue, in the materials and methods section, the PSD calculation of the SSVEP signals together with the above mentioned four classifiers are presented. This section covers also the definition of the ITR and its applications in BCI systems. Next, in the results section, the accuracy and ITRs of each classifier for different inter-LEDs distances are presented and statistically compared. There is a brief discussion over the results in the following section. Finally, conclusion section summarizes and concludes the paper.
2. Materials and Methods
2.1. Experimental Setup
The experimental setup used in this study is shown in Figure 1. Two white LEDs with constant twinkling frequencies of 15 Hz and 20 Hz are considered in this work. These frequencies are suitable for the SSVEP-based BCI applications as the amplitude of the SSVEP oscillations for higher frequencies are smaller while for lower frequencies the background EEG which contains the α-band oscillations can interfere with the SSVEP signals[9]. In addition according to[15] choosing a duty cycle of 50% for the twinkling LEDs more stronger oscillations can be obtained. Moreover, the modulation depth of the experiment must be higher than 75% to ensure the elicitation of the SSVEPs [16].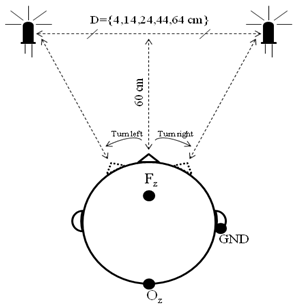 | Figure 1. Electrode positioning and the twinkling light sources used in this study |
For assessment purposes a luminance meter was located in place of the subject's eye. The background luminance of the experiment was found to be around 40 to 140 cd/m2 for different EEG recording sessions while the source luminance was around 11000 to 13000 cd/m2. Therefore, the modulation depth varied between 97.5% and 99.2%, which can be assumed almost constant for all cases.According to the international 10-20 system for EEG recording, the positive, reference and ground electrodes are placed over the Oz, the Fz and the right ear lobe, respectively (Figure 1). This electrode montage is common in SSVEP - BCI systems. EEG signal acquisition was performed by using an AD-instrument EEG system. The impedance of the electrodes was continuously measured to keep them less than 5 KΩ for the best possible performance of the recorded data. The sampling frequency of the EEG recording system was set to 1000 Hz.Five different horizontal distances (D) of 4, 14, 24, 44 and 64 cm were examined between the two sources, while the plane of the sources were located 60 cm away from the subject as shown in figure 1. Therefore, the inter-LEDs distances of D=4, 14, 24, 44 and 64 cm are equivalent to a horizontal angle of 3.8°, 13.4°, 22.6°, 40.2° and 56° respectively. Considering a constant distance of 60 cm between the subject and the light sources’ plane during all experiments, for simplicity from now on the inter-LEDs distances are only represented by their distance in centimetre instead of the angles between them in degree. Wider inter-LEDs distances than 64 cm are not applicable since one of the sources falls out of the visual field when looking at the other one. These stepwise distances were selected arbitrary to cover the complete field of view from D=4 cm to D=64 cm. Selection of other steps for inter-LED distances would provide comparable results[10].
2.2. Data Acquisition and Analysis
The dataset used in this research were recorded from eight normal-eyesight subjects in the Biomedical Engineering Laboratory of the University of Tehran. Each subject was instructed to look directly at each LED, in the presence of twinkling of the other LED in all specified inter-LED distances (D), for a period of 60 seconds during which the SSVEP signals were recorded. This procedure was repeated twice for each light source producing 2 minutes of SSVEP signal for each of the light sources and 4 minutes of data for the two light sources for each subject and each inter-LED distance. This procedure was repeated for all five inter-LED distances of 4, 14, 24, 44 and 64 cm. Data analysis consists of the following steps. At first step, the recorded data is passed through a band-pass filter of 5-45 Hz to eliminate the lower and higher interfering frequencies. Then at the second step, in order to evaluate the proposed system in real-time applications, four different durations (sweeps) of 0.5, 1, 2 and 3 seconds were considered. Each 4-minute data is then divided into non-overlapping segments with a length equal to each sweep. For example, considering the sweep length of 0.5 second, each 240 seconds (4-minute) data has 480 observations. This would be 240, 120 and 80 observations for sweep lengths of 1, 2 and 3 seconds, respectively. Shorter sweep lengths are not practical since the signal to noise ratio of the EEGs becomes too low and the evoked potentials could be indistinguishable from the background EEGs[10].At the third step, a novel PSD based feature is introduced which is computed using the amplitude of the main and harmonic frequencies of the observations as follows: 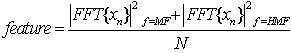 | (1) |
where, xn is the segmented data in each sweep length, FFT{•} is the Discrete Fourier Transform, |•| is the absolute operator, MF is the main twinkling frequency (f= 15 Hz or 20 Hz), HMF is the first harmonic of the main twinkling frequency (f= 30 Hz or 40 Hz) and N is the total number of samples in the frequency domain. It should be noted that two features are extracted from each observation; one corresponds to the main frequency of 15 Hz and its first harmonic and the other corresponds to the main frequency of 20 Hz and its first harmonic. Therefore, the total data matrix in sweep lengths of 0.5, 1, 2 and 3 seconds will be of dimension 480×2, 240×2, 120×2 and 80×2, respectively. To assess the performance of the proposed system for separating the two classes, i.e. if the first or the second light source is in the centre of attention of the subject, the averaged accuracy of all subjects is computed using the LDA, the linear SVM, the Naïve-Bayes and the Max classifiers. The LDA and the SVM classifiers use linear hyper-planes to classify the whole dataset while the Naïve- Bayes uses the distribution of the data in the space to compute the likelihood and the prior probability for each class. The accuracy of the classifiers is then computed as follows: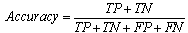 | (2) |
where True-Positive (TP) and False-Negative (FN) are the numbers of classified and misclassified observations with positive labels respectively while True-Negative (TN) and False-Positive (FP) are the same as TP and FN with negative labels.To train all classifiers (except the Max operator which does not need any training), the data set is shuffled and divided into the training and test sets of 80% and 20%, respectively. The process is repeated 50 times and the resulting accuracies were averaged for each subject separately over the test sets.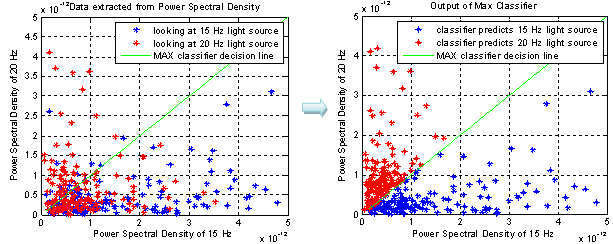 | Figure 2. Performance of the Max classifier over the data. The left subfigure illustrate the distribution of the data using the extracted features. The right one applies the Max classifer over the same data |
With the definition of the Max classifier, the processing time of the proposed system decreases significantly. This is simply done by selecting the largest feature value in the feature vector. That is, for example, if the subject is looking at 15 Hz twinkling light source in the presence of the 20 Hz twinkling source, then the feature value extracted in 15 Hz frequency band would show larger value than that of 20 Hz frequency band (see equation 1). Figure 2 illustrates the performance of the Max classifier more objectively. The left subfigure shows the distribution of the feature vectors. The blue and the red dots indicate the PSD extracted from the corresponding EEGs when the subject is looking at 15 Hz and 20 Hz twinkling light sources, respectively. The right subfigure shows the same data classified with the Max classifier (the green line).At the fifth step, a statistical test is carried out in order to compare the output of the classifiers for different inter-LEDs distances using the Student's t-distribution[10] with significance level of 0.1% (α=0.001) and 18 degree of freedom, since the output of the LDA, the SVM and the Naïve-Bayes classifiers is a stochastic variable. The degree of freedom of 18 is calculated considering the number of 10 runs for each inter-LEDs distance (18=10+10-2).At the final step, the Information Transfer Rate (ITR), which considers both the speed and the accuracy of the system from the practical BCI point of view, is computed to choose the best sweep length together with the best classifier as follows: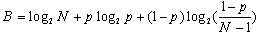 | (3) |
where N is the number of output classes of the system, p is the accuracy of the classifier and B represents available information in each trial as measured by bits/trial. By inserting the time length (sweep length) of the trial, the ITR can be measured in bits/min[17]. It should be noted that in this research N is 2 that is due to existence of two external light sources.
3. Experimental Results
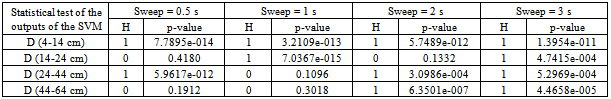
As it was stated before, when the subject is looking at one of the two light sources the amplitude of the corresponding SSVEP will be higher compared to those elicited by the other source. This is illustrated in figure 3 where the average spectrum for all subjects in the case of D=44 cm and for the time period of 1 min is plotted. In other words, observing the amplitude of the main frequencies and their harmonics it is possible to determine which external light source is being watched by the subject. This characteristic is to be used in BCI applications[10].To evaluate the performance of the LDA, the SVM and the Naïve-Bayes classifiers the mean and standard deviation (STD) values for the accuracy of the data in the test sets for 5 different inter-LED distances are computed and shown in Figures 4. It also displays the accuracy of the Max classifier. As the outputs of the Max classifier do not vary due to the constant parameters of its decision line (figure 2), therefore the outputs are not stochastic and the statistical evaluations will not apply to them.Table I, II and III compares the outputs of each classifier statistically over the sweep lengths in two adjacent inter-LEDs distances. As it can be seen, the classification accuracies for D=4 cm are smaller than of other distances for each sweep and each classifier. In addition, the accuracies for D=44 cm and D=64 cm are almost the same while those for D=24 cm are slightly smaller. It worth to note that, by increasing the sweep lengths, the accuracies increase for each classifier and for each inter-LED distances.The tables also show the situation of the Null Hypothesis (H) with H=1 for rejection and H=0 for failure to reject together with the corresponding p-values. 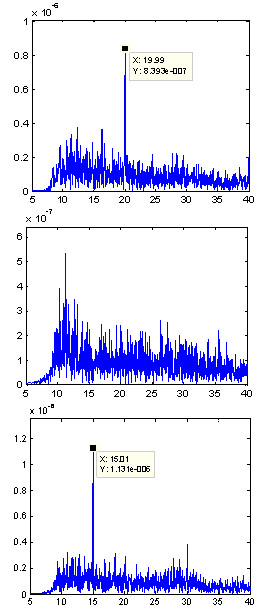 | Figure 3. Averaged spectrum of EEG signals when looking at no light source (down one); 15 Hz and 20 twinkling frequencies (top and middle one, respectively) |
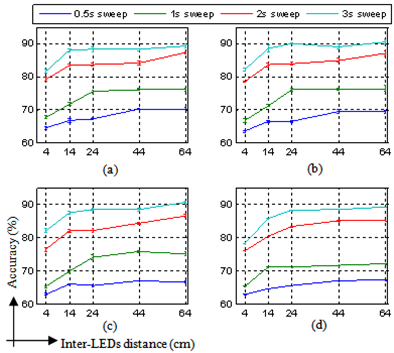 | Figure 4. The accuracy and STD of the LDA (a), the SVM (b), the Naïve-Bayes (c) and the Max classifier (d) |
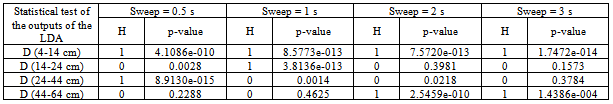
The Null Hypothesis is an assumption of equal performance of two sets of independent random samples.According to table I, in all of the sweeps the performance of the LDA classifier differs significantly from D=4 cm to D=14 cm, as all the H values are 1 or their corresponding p-values are less than the significance level. The p-values also introduced to show the qualitative difference of each two adjacent inter-LED distances. As the significance level is set to 0.1%, the p-value less or greater than α=0.001 states the difference and non-difference behaviour of the proposed method over the classifier, respectively as it is also illustrated in Null Hypothesis (H) section. However, the higher the α, the stronger the corresponding conclusion would be. For example, in D(14-24 cm), the p-value for the sweep time of 0.5s sweep is 0.0028 while this is 3.8136×10⁻¹³ for the sweep time of 1s. Table 1. Statistical evaluation of the outputs of the LDA classifier
 |
| |
|
Table 2. Statistical evaluation of the outputs of the SVM classifier
 |
| |
|
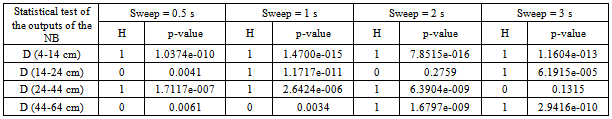
Table 3. Statistical evaluation of the outputs of the Naïve Bayes (NB) classifier
 |
| |
|
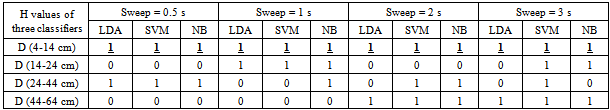
Table 4. The H values of the outputs of the all classifiers over the sweep lengths
 |
| |
|
As it can be seen in Tables II and III, the difference between the performances of the cases D=4 cm and D=14 cm is evident in both the SVM and the Naïve-Bayes classifiers. To statistically compare tvarious classifiers, table IV represents only the H values regardless of the p-values for the classifiers used.It can be seen from the results that for all classifiers and sweep lengths the performance of the proposed system for D=4 cm is different from that of D=14 cm, that is the accuracies for D=4 cm are always lower than those of D=14 cm (figure 4). Therefore D=14 cm in the proposed system performs better in the LED-based BCI applications. Although the performance in D=14 cm is similar to that in D=24 cm in sweep lengths of 0.5 and 2 seconds, however they are different in 1 and 3 seconds sweep. In sweep length of 2 and 3 seconds, the outputs of the classifiers differ significantly for D=44 cm and D=64 cm, however they are similar for 0.5 and 1-second sweeps.Figure 5, compares the classifiers in terms of their outputs (accuracy) in each sweep lengths. The accuracies of the LDA and the SVM are almost the same while the accuracies of the Max classifier are slightly smaller than the others. As the sweep lengths increases, the accuracies of all classifiers become closer. As stated earlier, the accuracies for D=4 cm are the lowest. These accuracies will be greater for longer inter-LED distances.As stated above, with an increase in the sweep lengths, the accuracy of each classifier for each inter-LEDs distance increases while the speed of the whole system decreases. In the final step, both the speed and the accuracy of the proposed system are compromised using ITR. Shorter sweep lengths correspond to shorter response time and therefore to the higher speed of the system.Figure 6 shows the ITRs of the proposed system using the accuracies of figure 5. As the response time of the classifiers is different, this figure also considers the processing time of each of them, separately.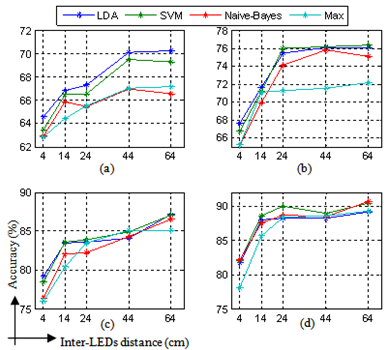 | Figure 5. The accuracy of the classifiers over the inter-LEDs distances in sweep length of 0.5s(a), 1s(b), 2s(c) and 3s(d) |
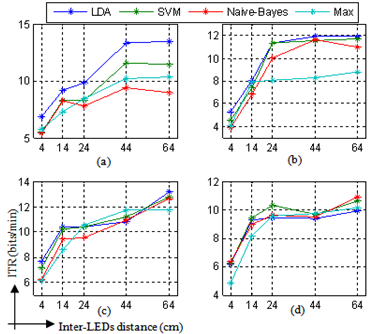 | Figure 6. The ITR of the classifiers over the inter-LEDs distances in sweep length of 0.5s(a), 1s(b), 2s(c) and 3s(d) |
The processing time of the Max, the LDA, the Naive-Bayes and the SVM classifiers is nearly 0.002, 0.04, 0.04 and 0.08 seconds in a processor of 2.13 GHz, core i3 CPU and 2.67 GB RAM, respectively. In more up-to-date computers, the processing times will be smaller that could not affect the response time of the whole system.Although in the shorter sweeps the ITR values of the LDA are the highest, these become better for the SVM in the longer ones. With an increase in the sweep lengths, the ITRs of the Max classifier becomes closer to the ITRs of the other ones; therefore it could be used in the longer sweep lengths for real-time applications as its processing time is less than that of the others. In addition, inter-LED distance of 44 cm and 64 cm have the highest ITR of 13.4 bits/min and 13.5 bits/min in sweep length of 0.5 second using the LDA classifier.
4. Discussion
In this research, the statistical evaluation of an LED-based BCI system in different inter-sources distances of D=4, 14, 24, 44 and 64 cm were investigated. To do so, a PSD method was applied to each segmented EEGs in order to extract the SSVEPs. Four classifiers of the LDA, the SVM, the Naïve-Bayes and the Max operator were introduced. Then, Student’s t-distribution used to compare the performance of the classifier in each two-adjacent distance and finally the ITR were presented to identify the best sweep length for real-time applications.Analysing the spectrum of the EEG could determine which external light source is being watched directly. In addition, longer the segmented data, more robust this identification would be. This is displayed in figure 3 in a window length of 1 min. Although the peak amplitudes are so clear, this period of time is not feasible in real-time applications.According to the figures 4, in all classifiers, the accuracy increases by the increment of the sweep lengths. A reason for this could be that more sweep lengths contains more SSVEPs; hence the corresponding peak amplitudes would be higher and classifiers would be more accurate. Moreover, it can be concluded that by increasing the inter-LED distances from D=4 cm to D=64 cm, the accuracy of the BCI system is generally increasing. That is due to less interference of each flickering LED with the other one in longer inter-LED distances. This is evident in the tables that the performance of the proposed system in D=4 cm differs significantly from the one in other distances in all sweep lengths (p-value < 0.001). According to figure 5, the performance of the LDA outperforms the others in sweep length of 0.5 and 1 seconds whilst in sweep lengths of 2 and 3 seconds the performance of the SVM is better than the other classifiers. However considering the processing time of the classifiers the LDA will be more preferable. In addition, according to the ITRs, the LDA has the highest values and with the sweep increments the Max classifier could be best choice for online processing.Finally, it worth to note that the D=44 cm is the turning point among the other inter-LEDs distances as it has high ITR values and is closer to the eyes instead of D=64 cm. For practical applications, using the inter-LEDs distance of D=24 cm is more desirable due to the shorter distance despite of its a few less accuracy. In one previous paper, the performance of an SSVEP-based system with two LEDs using Auto-Regressive (AR) model for feature extraction and three classifiers of the LDA, the SVM and the Naïve-Bayes were studied. It was showed that AR model order of 13 has the highest accuracy rate with either the LDA or the SVM of among the other orders. In addition, even in sweep length of 3 seconds the reported accuracy of 78% is not so high for the detection of the external light sources[10]. However, this study not only overcomes this problem with a PSD-based feature extraction method but also represents the high-speed Max classifier to be used in higher sweep lengths
5. Conclusions
In this paper, a novel frequency domain feature is defined and used based on the PSD of the SSVEP signal. The effect of the different inter-LED distances on the accuracy of the LED-based BCI systems was then statistically investigated. Moreover, the high-speed Max classifier was introduced to decrease the processing time of the proposed system. It was showed that in 0.5 and 1-second sweeps the LDA and in 2 and 3-second sweeps the SVM could outperform the other classifiers while the Max classifier could also be used in longer sweeps with a comparable ITR. In addition, an inter-LED distance of D=64 cm (equivalent to the visual angle of 56°) could produce the highest accuracy of 92% among the other distances that were studied. Finally, it was showed that the sweep length of 0.5 second could provide a more practical online ITR.
References
| [1] | H. Cecotti (2011) Spelling with non-invasive Brain-Computer Interfaces – Current and future trends. Journal of Physiology-Paris, Vol. 105, Issues 1–3, 106-114. |
| [2] | S. N. Resalat, et al (2012) High-speed SSVEP-based BCI: study of various frequency pairs and inter-sources distances. IEEE-EMBS Int. Conf. Biomedical and Health Informatics, 220 – 223. |
| [3] | D. J. McFarland et al (2005) Brain-computer interface (BCI) operation: signal and noise during early training sessions. Clinical Neurophysiology, Vol. 116, No. 1, 56-62. |
| [4] | H. M. Wadsworth and R. K. Kana (2011) Brain mechanisms of perceiving tools and imagining tool use acts: A functional MRI study. Neuropsychologia, Vol. 49, No. 7, 1863-1869. |
| [5] | Yu Zhang, Jing Jin et al (2012) LASSO based stimulus frequency recognition model for SSVEP BCIs. Biomedical Signal Processing and Control, Volume 7, Issue 2, 104-111. |
| [6] | K. K. Shyu, P. L. Lee et al (2010) Dual-frequency steady-state visual evoked potential for brain computer interface. Neuroscience Letters, Vol. 483, 28-31. |
| [7] | H. Cecotti (2011) A time–frequency convolutional neural network for the offline classification of steady-state visual evoked potential responses. Pattern Recognition Letters, Volume 32, Issue 8, 1145-1153. |
| [8] | Sabrina Walter et al (2012) Effects of overt and covert attention on the steady-state visual evoked potential. Neuroscience Letters, Vol. 519, Issue 1, 37-41. |
| [9] | G. R. Muller-Putz et al (2005) Steady-state visual evoked potential (SSVEP)-based communication: impact of harmonic frequency components. Institute of physics publishing, J. Neural Eng, Vol. 2, 123–130. |
| [10] | S. N. Resalat, S. K. Setarehdan (2012) A Study on the Effect of the Inter-Sources Distance on the Performance of the SSVEP-Based BCI Systems. Science and Academic Publishing, American Journal of Biomedical Engineering, Vol. 2, No. 1, 24-31. |
| [11] | G. Bin, X. Gao1 et al (2009) An online multi-channel SSVEP-based brain–computer interface using a canonical correlation analysis method. J Neural Eng. Vol. 6, No. 4. doi: 10.1049/el:20050892 |
| [12] | Lee PL, Yeh CL et al (2011) An SSVEP-based BCI using high duty-cycle visual flicker., IEEE Trans on Biomed Eng. Vol. 58, Issue 12, 3350- 3359. |
| [13] | Müller SM, Diez PF et al (2011) SSVEP-BCI implementation for 37-40 Hz frequency range. Engineering in Medicine and Biology Society, EMBC, Annual International Conference of the IEEE, 6352 – 6355. |
| [14] | Z. Wu, Y. Lai et al (2008) Stimulator selection in SSVEP-based BCI. Medical Engineering. Vol 30, No 8, 1079-1088 |
| [15] | Z. Wu (2009) The difference of SSVEP resulted by different pulse duty-cycle. Int. Conf. Communications, Circuits and Systems, 605–607. |
| [16] | S. N. Resalat, S. K. Setarehdan et al (2011) Appropriate twinkling frequency and inter-source distances selection in SSVEP-based HCI systems. IEEE Int. Conf. Signal and Image Processing Applications, 12-15. |
| [17] | D. J. McFarland, W. A. Sarnacki et al (2003) Brain-computer interface (BCI) operation: optimizing information transfer rates. Elsevier, Biological Psychology 63:237-251. |
 Abstract
 Reference
 Full-Text PDF
 Full-text HTML