Ali Jasim Mohammed Al-Jabiry, Marwa Abdul Muhsien Hassan
Department of physic, College of Science, Al-Mustansiriyah University, Baghdad, Iraq
Correspondence to: Ali Jasim Mohammed Al-Jabiry, Department of physic, College of Science, Al-Mustansiriyah University, Baghdad, Iraq.
| Email: |  |
Copyright © 2012 Scientific & Academic Publishing. All Rights Reserved.
Abstract
Effect of glucose addition on piezoelectric sensing of water solution has been investigated with different percentages (0, 0.05, 0.1 and 0.15) wt. %. Sensing signals (piezoelectric) characterized and achieved by using transducer which transmits a mechanical waves towards the glucose solution cell, and then the receptor received the attenuated signals. The range of operating frequencies was (10 kHz - 50MHz), the results of measurement which included recording the resonance frequencies (in the first order) for all prepared samples. The results showed that the resonance frequency shifted to the higher values (from 5MHz to 35MHz) for glucose concentrations (from 0 to 1 wt. %) of water solution. Also the damping coefficient decreased (from 1.19 to 1.02) for the same range of glucose concentrations.
Keywords:
Glucose, Piezoelectric Properties, Resonance Frequency, Damping Coefficient, Water Solution
Cite this paper:
Ali Jasim Mohammed Al-Jabiry, Marwa Abdul Muhsien Hassan, "Effect of Glucose(C6H12O6) Addition on PiezoelectricProperties for Sensor Application", American Journal of Biomedical Engineering, Vol. 2 No. 6, 2012, pp. 287-292. doi: 10.5923/j.ajbe.20120206.08.
1. Introduction
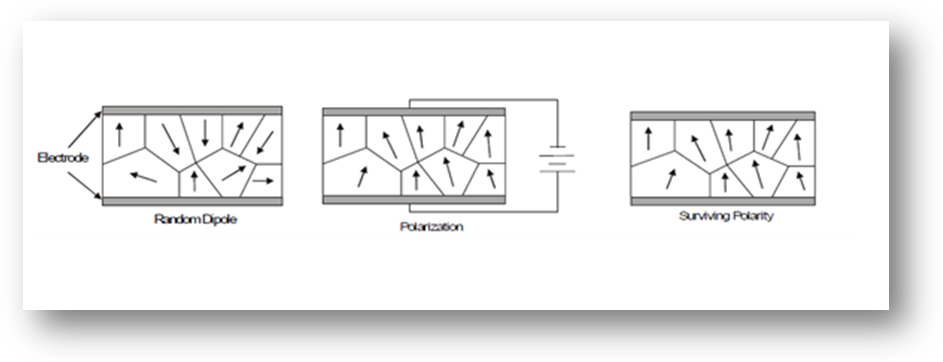
In 1880, Jacques and Pierre Curie discovered an unusual characteristic of certain crystalline minerals, when subjected to a mechanical force, the crystals became electrically polarized. Tension and compression generated voltages of opposite polarity, and in proportion to the applied force. Subsequently, the converse of this relationship was confirmed: if one of these voltage-generating crystals was exposed to an electric field it lengthened or shortened according to the polarity of the field, and in proportion to the strength of the field. These behaviours were labelled the piezoelectric effect and the inverse piezoelectric effect, respectively, from the Greek word piezein, meaning to press or squeeze as shown in Figure (1)[1].Piezoelectric behaviour in general can be manifested in two ways ‘direct’ piezoelectric effect and ‘converse’ piezoelectric effect.Direct piezoelectric effect occurs when a piezoelectric material becomes electrically charged when subjected to a mechanical stress. These devices can be used to detect strain, movement, force, pressure or vibration by developing appropriate electrical responses, as in the case of force and acoustic or ultrasonic sensors. Converse piezoelectric effect occurs when the piezoelectric material becomes strained when placed in an electric field. This property can be used to generate strain, movement, force, pressure or vibration through the application of suitable electric field[2].The piezoelectric effect is used in sensing applications, such as in force or displacement sensors. The inverse piezoelectric effect is used in actuation applications, such as in motors and devices that precisely control positioning, and in generating sonic and ultrasonic signals[1].The piezoelectric effect occurs when the charge balance within the crystal lattice of a material is disturbed. When there is no applied stress on the material, the positive and negative charges are evenly distributed so there is no potential difference. When the lattice is changed slightly, the charge imbalance creates a potential difference, often as high as several thousand volts. However, the current is extremely small and only causes a small electric shock. The converse piezoelectric effect occurs when the electrostatic field created by an electrical current cause the atoms in the material to move slightly, where the material is heated under the application of a strong electric field. The heat allows the molecules to move more freely and the electric field forces all of the dipoles in the crystal to line up and face in nearly the same direction as shown in Figure (2)[3].
1.1. Piezoelectric Characteristics
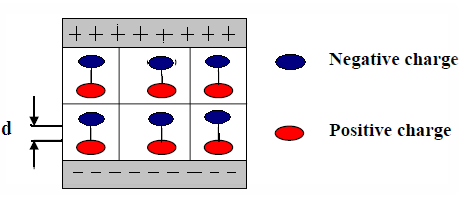
Certain crystals possess a permanent electrical dipole because their canters of positive and negative charges are not at the canters of the unit cells. These unit cells are polarized[4].Many materials change their dimensions in an electric field because the negative charges are pulled towards the positive electrode, and the positive charges are pulled towards the negative electrode as shown in Figure (3)[5].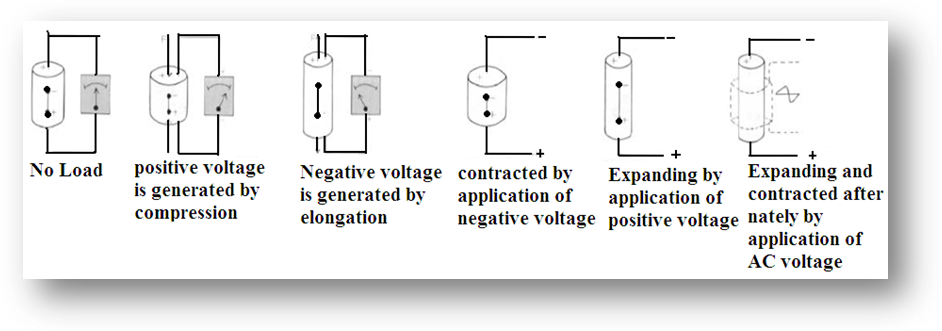 | Figure 1. Piezoelectric Phenomena |
 | Figure 2. Polarization of material to generate piezoelectric effect |
 | Figure 3. The charges pulled toward the opposite electrodes |
The pulling of the charges will increase the dipole length (d), this also increases the dipole moment (Qd), and the polarization (p), since the latter is the total of the dipole moment (ΣQd) per unit volume (V)[6]: | (1) |
This sequence of effects provides the means of changing mechanical energy into electrical energy and vice versa.
1.2. Piezoelectric Coefficients
 | Figure 4. Direction of force affecting a piezoelectric element |
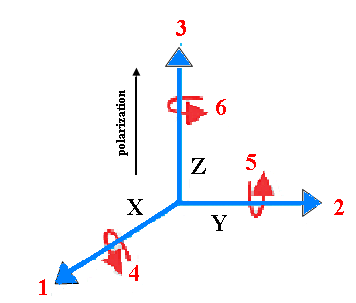
Because a piezoelectric is anisotropic, physical constants relate to both the direction of the applied mechanical or electric force and the directions perpendicular to the applied force. Consequently, each constant generally has two subscripts that indicate the directions of the two related quantities, such as stress and strain for elasticity. The direction of positive polarization usually is made to coincide with the Z-axis of a rectangular system of X, Y, and Z axis Figure (4). Direction X, Y, or Z is represented by the subscript 1, 2, or 3, respectively, and shear about one of this axis is represented by the subscript 4, 5, or 6, respectively[1].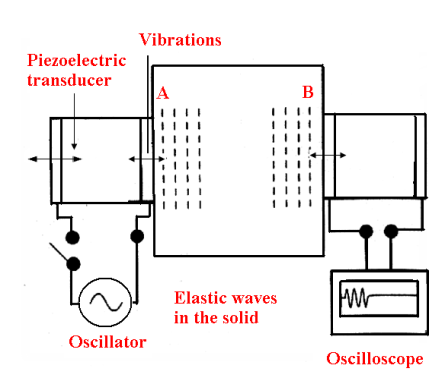 | Figure 5. The mechanism of piezoelectric application |
Piezoelectric transducers are widely used to generate ultrasonic waves in solids and also to detect such mechanical waves as shown in Figure (5) where the transducer on left is excited from an AC source and vibrates mechanically, these vibrations are coupled to the solid and generate elastic wave, when the waves reach the other end, they mechanically vibrate the transducer on the right, which convert the vibration to an electrical signal[7].
1.3. Characteristic Frequency ( fe )
The characteristic (fundamental) frequency (fe) will be considered as the oscillation of the particles on both surfaces of the block material of the thin film, when the two electrodes are contacted the particle swings outwards and inwards[8], while the central plate remains constantly at rest. Hence a standing wave will be produced, and the characteristic frequency is related to the plate thickness as in relation: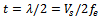 | (2) |
where The plate thickness,
 The velocity of sound.
1.4. Damping Coefficient (δ)
Damping is a material property, which is very important to vibration control in engineering. The numerical results of vibration and acoustical analysis are very sensitive to this parameter. For the mechanical damping treatment of structure is necessary to consider three parameters: damping; mass, and stiffness. These three parameters are needed to design and optimize piezoelectric transducers by using numerical modelling since all of them have some effect in piezoelectric transducer dynamic response. In addition, most part of systems that dissipate energy by vibration is non-linear. Therefore, it is necessary to develop models of ideal damping with suitable approximation. The several types of damping are[9]:1) Viscous damping, due to energy dissipation;2) Structural damping, due to the material properties;3) Friction damping, due to mechanical sliding between surfaces.The damping coefficient (δ) is the factor that the amplitude will be decreased from one oscillation to the next oscillation according to it as in the Figure (6)[8], and the damped amplitude is given by the relation[4]: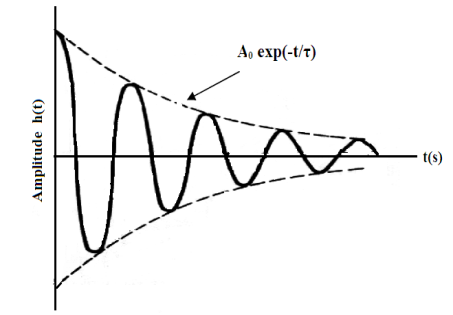 | Figure 6. Decay of oscillation with damping coefficient δ |
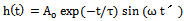 | (3) |
where: is the amplitude at resonance,
  , (f) is the frequency,(ω = 2πf),(τ) is the resonance time.
1.5. Resonance Frequency (fo)
When an unrestrained piezoelectric element is exposed to a high frequency alternating electric field, impedance minimum, the planar or radial resonance frequency, coincides with the series resonance frequency, fs. At higher frequencies resonance, another impedance minimum, the axial resonance frequency, is encountered.This frequency is characterized by the output amplitude as shown in Figure (7)[8].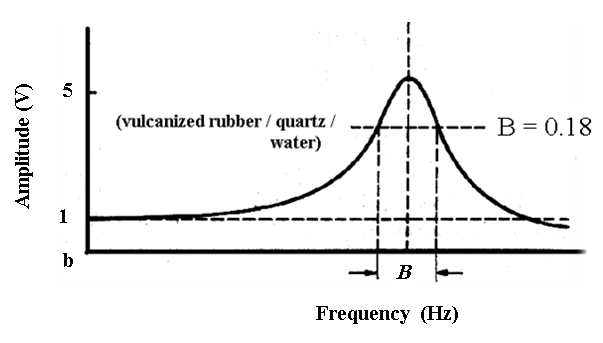 | Figure 7. Resonance curve of forced oscillation |
Up to the resonance frequency (fo) it increases to a maximum, where the value depends on the damping coefficient.
1.6. Quality Factor (Q)
To achieve ultra-high resonator sensitivity, high quality factor (Q-factor) is most desirable in resonator design and fabrication[10]. Under atmospheric pressure, air damping is the predominant mechanism for energy dissipation [11].Air damping becomes less effective if pressure goes down, and then it is easier to identify the effects of other energy dissipation mechanisms[12]. The Q can be defined as the ratio of the amplitude at resonance frequency to the static thickness: | (4) |
Also it is connected to the damping coefficient (δ) as in relation: | (5) |
The higher order modes achieve higher frequencies and the increase of resonance frequency will decrease the Q-factor[13].
1.7. Bandwidth (B)
The bandwidth (B) is linked with, which represents 70% of the maximum value of the resonance frequency, normally it is calculated from the resonance curve, and then the characteristic frequency can be calculated by using the relation[8]: | (6) |
Where:fe: the characteristic frequency.Q: the quality factor.
2. Experimental Work
The material used in this paper is glucose(C6H12O6) addition on water solution. The electronic balanced of accuracy 10-4 have been used to obtain a weight amount of glucose(C6H12O6) powder. The weight percentages of glucose(C6H12O6)powder are (0, 0.05, 0.1 and 0.15) wt. %. The effect of glucose(C6H12O6)addition on piezoelectric sensing of water solution was measured.The setting used in this paper include a standard two piezo-crystals(Model number: 3B12+9.0EAWC, Type: Piezoelectric Ceramics, Material: Piezoceramics, Metal type: Brass, Electrode form: (Thin) Diode, Connection terminal: Soldier wire or not, Parameter value: (D=12mm, T=0.15mm and f=9 kHz))located tightly on the copper foil as a diaphragm shown in Figure (8).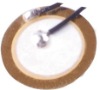 | Figure 8. Image of piezo-crystal used in this work |
The pressure (mechanical) signal was produced on the diaphragm using a function generator (B+K precision 3020) supplied an electrical signal of frequency in the range(1–100000) KHz. The pressure signal can be sensed by water solution and analyzed with the oscilloscope (KENWOOD 20 MHz CS – 1021).
3. Result and Discussion
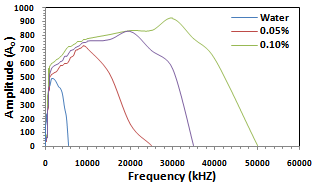 | Figure 9. The resonance frequency of water solution at different glucose (C6H12O6)addition (water, 0.05%, 0.1% and 0.15%) |
The resonance frequency can be determined by measuring the output voltage as a function of frequency as shown in Figure (9), we can observed that the resonance value varied from 10 kHz to 50 MHz, by change the glucose (C6H12O6) addition, this varied can be due to a number of reasons, such as humidity, atmospheric pressure and mechanical loading.The effect of glucose addition on resonance frequency can be seen in Figure (10). 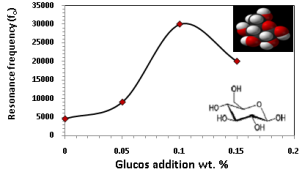 | Figure 10. The resonance frequency at different glucose addition |
The damping coefficient (δD)can be calculated using the relation (3), and it can be drawn for samples with different glucose addition as shown in Figure (11) (a, b, c and d)[4].The damping coefficient (δD)of the water solution at different glucose addition were carried out from the graph and using the relation: | (7) |
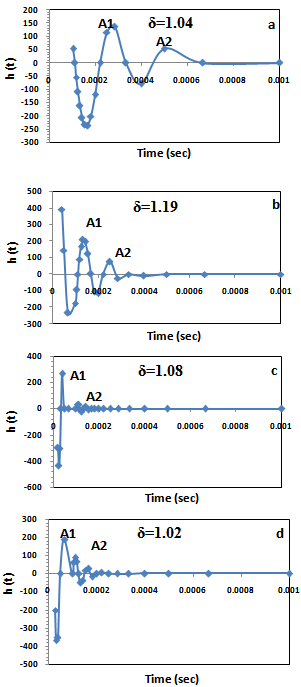 | Figure 11. The relation between the time of resonance and the damping for water solution at different glucose addition: a- water, b-0.05%, c-0.1% and d-0.15% |
The shifting between the transmitted signal and that of water solution at different glucose addition are shown in Figures (12), (13), (14) and (15), it is clearly that the large shifting vanish with increasing the source frequency. The characteristic of frequency can be calculated by using the relation (6) depending on the band width and the quality factor and the result tabled in table (1).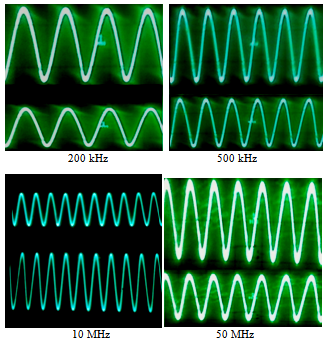 | Figure 12. The supplied frequencies (upper) and the sensing frequencies (lower) by the water solution |
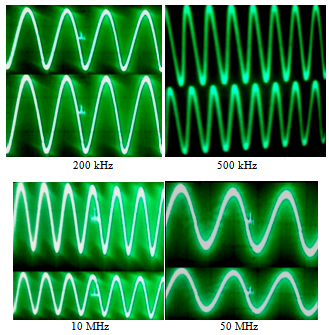 | Figure 13. The supplied frequencies (upper) and the sensing frequencies (lower) by the water solution at 0.05 wt.% glucose addition |
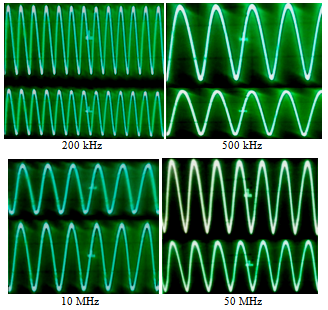 | Figure 14. The supplied frequencies (upper) and the sensing frequencies (lower) by the water solution at 0.1 wt.%glucose addition |
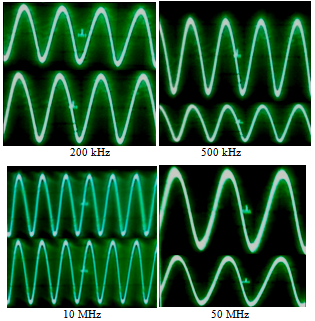 | Figure 15. The supplied frequencies (upper) and the sensing frequencies (lower) by the water solution at 0.15 wt.% glucose addition |
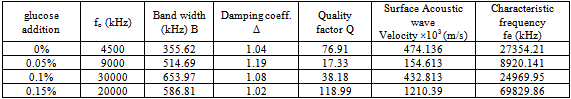
Table (1). The result of piezoelectric properties
 |
| |
|
The acoustic is travelling through the water solution with velocity depending on the material addition of the water solution and on the characteristic frequency, and then the velocity could be evaluated using the relation (2). The velocity values were recorded as a function of glucose addition as shown in Figure (16).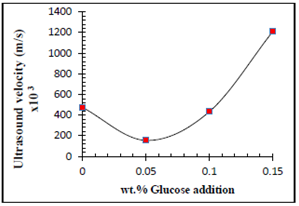 | Figure 16. Ultrasound velocity as a function of glucose addition of water solution |
The quality factor was esteemed be using the relation (5), as we observed the value of the quality decrease when the resonance frequency increase, the result was listed in table (1). The effect of glucose addition can be seen in Figure(17).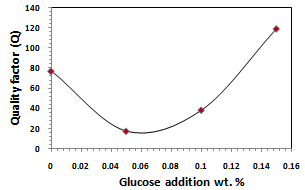 | Figure 17. Effect of glucose addition on the quality factor |
4. Conclusions
In this paper, effect of glucose addition on piezoelectric sensing of water solution has been investigated with different percentages (0, 0.05, 0.1 and 0.15) wt. %. The results showed that the resonance frequency shifted to the higher values (from 5MHz to 35MHz) for glucose concentrations (from 0 to 1 wt. %) of water solution. Also the damping coefficient decreased (from 1.19 to 1.02) for the same range of glucose concentrations.
References
| [1] | L. H. Van Vlack, "Elements of Material , Science and Engineering, fifth edition , Addison – Wesley Publishing Company, 355, 1987. |
| [2] | A. J. Mohammad , " Studying the Effect of Molarity on the Physical and Sensing Properties of Zinc Oxide Thin Films Prepared by Spray Pyrolysis Technique", Ph.D Thesis , University of Technology , Baghdad , Iraq , 2007. |
| [3] | S.O.Kasor "Principles of Electronic Materials and Devices", second edition Mc Grow Hill, chapter 7, 2002. |
| [4] | J.Lu, " High Quality Factor Silicon Cantilever Driven by PZT Actuator for Resonant Based Mass Detection", 2008. |
| [5] | J. Krautkrämer and Herbert Krautkrämer,"Ultrasonic Testing of Materials" , Springer – Verlag, 1969 . |
| [6] | ABCM Symposium Series in Mechatronics, 1, 271-279, 2004. |
| [7] | S. I. Baskalov , "Signals and Circuits , Problem Solving Guide" , Mir Publishing , Moscow , 1990 . |
| [8] | J.Lu, "Quality Factor of PZT thin film transducer micro cantilevers", Stresa, Italy, 26-28 April 2006. |
| [9] | J.Lu, "Mechanical Quality Factor of Micro Cantilevers for Mass Sensing Applications," SPIE Microelectronics, MEMS, and Nanotechnology 2007, Australia, Dec. 2007. |
| [10] | M. Hernández, A. Juárez, R. Hernández, "Interferometric thickness determination of thin metallic films"Superficies y Vacío 9, 283-285, 1999. |
| [11] | Catalog No.: 90-1015, “Piezoelectric Theory and Applications”. |
| [12] | Piezoelectric Materials,Lecture Outline,2004. |
| [13] | S. Humad , R. Abdolvand , G. Ho , G. Piazza , and F. Ayazi , Proc. IEEE Int. Electron. Devices Meeting, 957-960, 2003 . |
| [14] | James R. Phillips, " Piezoelectric Technology Primer ", 2004. |
| [15] | H. D. Young “ University Physics “ , eight edition , Addison – Wesley Publishing Company, 717-719, 1991 . |
 Abstract
 Reference
 Full-Text PDF
 Full-Text HTML