-
Paper Information
- Next Paper
- Paper Submission
-
Journal Information
- About This Journal
- Editorial Board
- Current Issue
- Archive
- Author Guidelines
- Contact Us
American Journal of Biomedical Engineering
p-ISSN: 2163-1050 e-ISSN: 2163-1077
2012; 2(5): 197-201
doi: 10.5923/j.ajbe.20120205.01
New Segmentation Approach to Extract Human Mandible Bones Based on Actual Computed Tomography Data
 Abstract
 Reference
 Full-Text PDF
 Full-Text HTML
Tamer M. Nassef
Computer Engineering Department, Misr University for Science & Technology, 6th of October, Egypt
Correspondence to: Tamer M. Nassef , Computer Engineering Department, Misr University for Science & Technology, 6th of October, Egypt.
| Email: |  |
Copyright © 2012 Scientific & Academic Publishing. All Rights Reserved.
In this paper, a new approach for segmenting different anatomical regions in dental Computed Tomography (CT) studies is presented. The approach consists of three steps: Hounsfield unit's threshold (HU) based on gray-level segmentation, multi-object with texture extraction and anatomical regions identification. First, a HU threshold window sets to separate between different regions upon their gray-level values; second, a set of objects are generated by and texture descriptors are calculated for selected windows from the image data sample. Finally, identification of different anatomical regions set for mandible bones cortical and cancellous. It is expected that the proposed approach will also help automate different semi-automatic segmentation techniques by providing initial boundary points for deformable models or seed points for split and merge segmentation algorithms. Preliminary results obtained for dental CT studies of human-mandible are presented.
Keywords: CT Image Segmentation, Bone 3D Reconstruction, Multi-Objects Segmentation, Dental 3D Models
Cite this paper: Tamer M. Nassef , "New Segmentation Approach to Extract Human Mandible Bones Based on Actual Computed Tomography Data", American Journal of Biomedical Engineering, Vol. 2 No. 5, 2012, pp. 197-201. doi: 10.5923/j.ajbe.20120205.01.
1. Introduction
- Image scanners devices such as computed tomography (CT), magnetic resonance imaging (MRI) or positron emission tomography (PET) are nowadays a standard instrument for diagnosis. Among these devices, CT-scanners are today widely used at radiotherapy departments all over the world it has several advantages. The main advantages of a CT-scanner are to obtain physical information, like patient anatomy, size, shape, and in homogeneities; the other is to obtain the electron density from the different anatomical structures of the patient for the radiotherapy treatment planning[1]. Image segmentation is one of the primary steps in image analysis for object identification. The main aim is to recognize homogeneous regions within an image as distinct and belonging to different objects, where the segmentation process can be based on actual Digital Imaging and Communications in Medicine DICOM data to find the maximum homogeneity in grey levels within the regions identified.A variety of techniques have been proposed for CT image segmentation methods. These methods can be classified into three categories. The first category includes analytic methods, in which segmentation algorithms are treated directly by considering some measure (e.g. Hounsfield Unite), which by a priori knowledge is assumed to be the appropriate measure, Gabriella Tognola et al (2006) extract the mandible contour by histogram equalization and thresholding and proposed another method by gradient vector flow snake parameters were optimized in order to achieve more accurate contours segmentation of nerve mandibular scans[2]-[4]. Paola Campadelli et al (2009) apply hierarchical gray level based on framework to segment heart, bones, liver, kidneys, and spleen directly related to the Hounsfield units (HU) based on gray level techniques, learning techniques, model fitting techniques, probabilistic atlases, and level set anatomical knowledge to obtained three dimensional (3-D) binary image[5]. Typically this measure was incorporated into the original segmentation algorithm as well.The second category includes supervised evaluation methods. In these methods, the results of a segmentation algorithm are compared to a “standard” reference image that is manually segmented beforehand, and the amount of discrepancy becomes the measure of segmentation effectiveness. Gaivile Pileicikiene et al (2007) choose dead person for the tudy the precision of CT examination increased – oluntary and involuntary movements of research object were excluded (like breathing or muscle tonus movements), this make the segmentation more easier since the high resolution images captured by increasing the dose to get more than 1500 slice from the CT scanner[6], Ming Chen et al (2007) choose the same condition with another method by comparing between dead and alive person. The author used commercial software to segment the DICOM images based on threshold and region growing methods to extract the mandible for a patient[7]. Zhan Liu et al (2007) used the same commercial software in his studies, but here the Temporomandibular Joint (TMJ) appear clearly in the 3D model geometry information of the cortical bones, the cancellous bones and the teeth was exported from commercial software and this may accomplished by semi-automated method[8]. This is the most commonly used method for medical segmentation. However, manually generating a reference image is a difficult, subjective, and time-consuming job, and generally cannot guarantee that one manually-generated segmentation image is better than another. Consequently, comparison using such reference images cannot ensure accurate evaluations.The third category includes unsupervised evaluation. In these methods, the segmentation results are evaluated by judging the quality of the segmented image directly to evaluate some pre-defined criteria, such as the partitioning of foreground objects from the background, J.M. Reina et al (2006) present a 3D surface model of mandible based on morphological analysis with standard distances without case study and this near to the information theory. Since the shape of each organ is not consistent throughout all slices of a 3D medical image and the gray level intensities overlap considerably for soft tissues, texture is especially important in medical image segmentation because of its homogeneity within the same tissue and across different slices. Once textures have been calculated and their scalar values assigned to pixels, the pixels can be clustered or classified (when the tissues’ labels are available) for the purpose of segmentation[9]. These evaluation measures are typically used with gray-level images and are not designed for general-purpose applications. However, modeling of biological tissues, such as bone related organs, is a difficult task because of their inherent inhomogeneous and anisotropic character, although inhomogeneous character is in some sense “directly” accessible via imaging techniques. Unfortunately, this is not the case for the trajectories of anisotropic elasticity. Many investigators have evaluated 3-D models from Computed Tomography (CT) 2-D images. The results of these studies have been approximated for the conversion of images formats. Mechanical anisotropy means that the mechanical properties of the material are different when measured in different directions in the same sample. For reasons of simplification, modulus of elasticity of the mandibular bones, was given constant values and considered isotropic to facilitate simulation.[10]The use of numerical methods such as finite element methods (FEM) has been adopted in solving complicated geometric problems, as it is very difficult to achieve an analytical solution. FEM is a technique for obtaining a solution to complex mechanical problems by dividing the domain problem into a collection of much smaller and simpler domains (elements) where field variables can be interpolated using shape functions[13]. In 1977, Weinstein[11] was the first to use FEM in implant dentistry. Subsequently, FEM was rapidly applied in many aspects of implant dentistry. Atmaram and Mohammed[12]-[14] analyzed the stress distribution in a single tooth implant, to understand the effect of elastic parameters and geometry of the implant, implant length variation, andpseudo-periodontal ligament incorporation. Borchers and Reichart[14] performed a three-dimensional (3-D) FEM of an implant at different stages of bone interface development. Cook, et al.[16] applied it in porous rooted dental implants. Meroueh, et al.[17] used it for an osseointegrated cylindrical implant. Williams, et al.[18] carried it out on cantilevered prostheses on dental implants. Akpinar, et al.[19] simulated the combination of a natural tooth with an implant using FEM.In the present study, a new approach for segmentation based on actual CT data are used to extract an accurate human mandible with TMJ and teeth to help for generating robust 3D surfaces and volumetric models. The proposed technique used the statistical texture method applying entropy transformation combined with information captured from HU based on gray-level techniques, finally a level sets and geometric contour used to build the prototype geometry for the full-human mandible.
2. Material and Methods
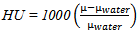
- Dentate and edentulous patient's mandible was scanned with SIEMENS/Esprit CT machine 120 KeV energy. The pixel size of the scanner is 512x512 pixels, and 0.4 mm is equal to the distance between CT slice planes. Totally 400 images were obtained, raw data was in DICOM format.A HU and Gray-level phaseThe electron density is obtained from the CT-scanner via the so-called Hounsfield units (HU). These are defined as:
 | (1) |
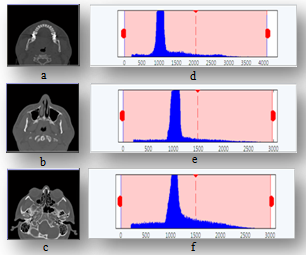 | Figure 1. Histogram of CT slices samples by HU range; displayed beside each slice |
|
 | (2) |
 are refer to the pixel size of the CT-scanner.
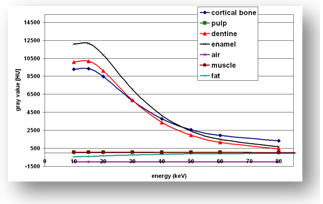 | Figure 2. Hounsfield units in GL for different anatomical structures versus energy KeV |
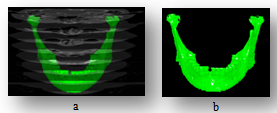 | Figure 3. The texture material, (a) CT planes with mandible, (b) mandible textured with bone material |
 | (3) |
|
3. Results
- There are three different models provided from this approach, Fig.4 represents models for the dentate patient, who used to validate the technique by comparing it with the provided model from the phantom software at the CT scanner, full skull with and without skin with different colors to show the different objects. Table 3 shows the comparison between Multi-object models with DICOM images and phantom software at the CT scanner, where the TMJ that hides behind the skull bone appears with Multi-object models, the artifacts noise from felling metals or implants and undesired soft tissues will be reduced.
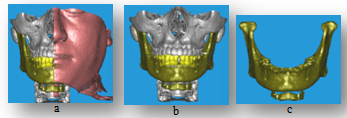 | Figure 4. Multi-objects 3-D model, (a) all objects with skin section, (b) full skull without skin, (c) full mandible with Hyoid bone and TMJ |
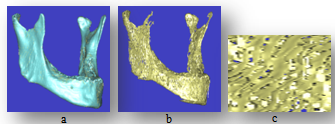 | Figure 5. Mandible bones, (a) Cortical bone, (b) Cancellous bone, (c) Trabiculer pattern for cancellous bone (zooming by 30X) |
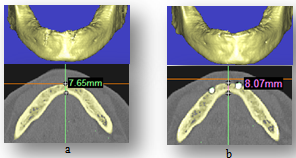 | Figure 6. measures of heeling bone around implants, (a) the mandible without implants, (b) the mandible with implants after 6 months |
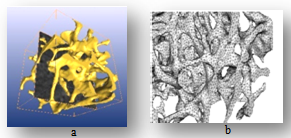 | Figure 7. Trabiculer pattern for cancellous bone, (a) finally textured trabiculer model, (b) finite element model mished by tetrahedral elements |
4. Conclusions and Future Works
- Many investigators have evaluated 3-D models from CT 2-D images. The results of these studies have been approximated for the conversion of images formats, this study provide a realistic 3-D model from 2-D segmented images scanned with CT scanner device based on actual CT data carried by DICOM files formats. Preliminary results are reported; pixels intensity values and pixels numbers are significant to verify the volumetric 3-D model of objects, this model can helps in dental diagnosing and to evaluate the orthogonal mechanical properties values especially for edentulous patients. The noises produced for filling cavity materials or dental implants are eliminated by combined classical segmentation techniques. Tetrahedral elements are suitable to divide the mandible model to finite elements for mechanical analysis studies like implant stress-strain; multi-objects technique separate mandible to objects for decreasing the number of nodes and elements to reduce the number of FEA equations; this will accelerate the idealization process at FEM models.
References
| [1] | Shum, H.Y., Chan, S.C. and S.B. Kang, Image-Based Rendering, Springer Science-Business Media, LLC, Spring Street, New York, USA, 2007. |
| [2] | Tognola, G., Parazzini, M., Pedretti, G., Ravazzani, P., Grandori, F., Pesatori, A., Norgia, M., and C. Svelto, "Optimization of 2-D to-3-D Reconstruction Technique for Maxillofacial Surgery Applications", Proceedings of IST - International Workshop on Imaging Systems and Techniques, pp.186-189, IEEE, Italy, April 2006. |
| [3] | Tognola, G., Parazzini, M., Pedretti, G., Ravazzani, P., and C. Svelto," Three-dimensional reconstruction and image processing in mandibular distraction planning," IEEE transaction on instrumentation and measurement, Volume. 55, (6), pp.1959-1964, December 2006. |
| [4] | Tognola, G., Parazzini, M., Pedretti, G., Ravazzani, P., Grandori, F., Pesatori, A., Norgia, M., and C. Svelto, "Novel 3D reconstruction method for mandibular distraction planning," Proceedings of IST - International Workshop on Imaging Systems and Techniques, pp.82-85, IEEE, Italy, April 2006. |
| [5] | Campadelli, P., Casiraghi, E., Pratissoli, S., and G. Lombardi," Automatic abdominal organ segmentation from CT images," Electronic Letters on Computer Vision and Image Analysis, Volume 8(1), pp.1-14, January 2009. |
| [6] | Pileicikiene, G., Varpiotas, E., Surna, R., and A. Surna," A three-dimensional model of the human masticatory system, including the mandible, the dentition and the temporomandibular joints," Stomatologija, Baltic Dental and Maxillofacial Journal, Volume. 9 (1), pp.27-32, 2007. |
| [7] | M. Chen , L. Ni , Yu Zhang , Yuan Zhang " Comparison study on the 3D reconstruction of mandible according to Virtul Chinese Human slice data and CT data," World Journal of Modelling and Simulation, Volume. 3 (3), pp. 235-240, May 2007. |
| [8] | Liu, Z., Fan, Y., and Y. Qian, " Biomechanical simulation of the interaction in the Temporo-mandibular Joint within dentate mandible: A Finite Element Analysis," Proceedings of ICME - International Conference on Complex Medical Engineering, pp.1842-1846, IEEE, China, 2007. |
| [9] | Reina, J.M., García-Aznar, J.M., Domínguez, J., and M. Doblaré, "Numerical estimation of bone density and elastic constants distribution in a human mandible," J. Biomech. Eng., (doi: 10.1016), Elsevier (0021-9290), March 2006. |
| [10] | Nassef, T. M., Alkhodary, M., Marei, M. K., Awadalla, and, M. A., and Moustafa, R., "A New Interactive 3-D Numerical Model of the Human Mandible for Peri-Implant Analysis in-Vivo Compared With Cone Beam Computed Tomography 3-D Quality, " American Journal of Biomedical Engineering, 2012; 2(1): 9-16 |
| [11] | Weinstein, A.M, Klawitter, J.J, Anand, S.C, and R. Schuessler, "Stress Analysis of Porous Rooted Dental Implants," Proceedings of Implantologist, Conf, Volume 1, pp. 104-109, 1977. |
| [12] | Atmaram, G.H, and H. Mohammed," Stress analysis of single-tooth implants. I. Effect of elastic parameters and geometry of implant" Proceedings of Implantologist, Conf, Volume 3, pp. 24-29, 1984. |
| [13] | Atmaram G.H, and H. Mohammed, "Stress analysis of single-tooth implants II. Effect of implant root-length variation and pseudo periodontal ligament incorporation," Proceedings of Implantologist, Conf, Volume 3, pp.58-62, 1984. |
| [14] | Mohammed, H., Atmaram, G.H., and F.J. Schoen, "Dental implant design: a critical review," J Oral Implantol, Volume 8, pp. 393-410, 1979. |
| [15] | Borchers.L, and P. Reichart," Three-dimensional stress distribution around a dental implant at different stages of interface development,"J Dent Res, Volume 62, pp. 155-159, 1983. |
| [16] | Cook, S.D., Weinstein, A.M., J.J. Klawitter," Athree-dimensional finite element analysis of a porous rooted Co-Cr-Mo alloy dental implant "J Dent Res, Volume 61, pp. 25-129, 1982. |
| [17] | Meroueh, K.A., Watanabe, F., and P.J. Mentag, "Finite element analysis of partially edentulous mandible rehabilitated with an osteointegrated cylindrical implant," J Oral Implantol, Volume 13, pp. 215-238, 1987. |
| [18] | Williams, K.R., Watson, C.J., Murphy, W.M., Scott, J., Gregory, M., and D. Sinobad," Finite element analysis of fixed prostheses attached to osseointegrated implants "Proceedings of Quintessence Int, Conf, Volume 21, pp. 563-570, 1990. |
| [19] | Akpinar, I., Demirel, F., Parnas, L., and S. Sahin," A comparison of stress and strain distribution characteristics of two different rigid implant designs for distal extension fixed prostheses," Proceedings of Quintessence Int, Conf, Volume 27, pp. 11-17, 1996. |