-
Paper Information
- Next Paper
- Previous Paper
- Paper Submission
-
Journal Information
- About This Journal
- Editorial Board
- Current Issue
- Archive
- Author Guidelines
- Contact Us
American Journal of Biomedical Engineering
p-ISSN: 2163-1050 e-ISSN: 2163-1077
2012; 2(4): 163-174
doi: 10.5923/j.ajbe.20120204.03
Multifrequency REG: Fundamental Background, Informational Meaning and Ways of Data Analysis and Automation
 Abstract
 Reference
 Full-Text PDF
 Full-Text HTML
Moskalenko Yu. 1, Weinstein G. 1, Masalov I. 1, Halvorson P. 1, Ryabchikova N. 2, Semernia V. 1, Panov A. 1, Andreeva Yu. 1
1Institute of evolutionary physiology and biochemistry Russian Academy of Sciences, St.Petersburg, Russia
2Moscow State University, Moscow, Russia
Correspondence to: Moskalenko Yu. , Institute of evolutionary physiology and biochemistry Russian Academy of Sciences, St.Petersburg, Russia.
| Email: |  |
Copyright © 2012 Scientific & Academic Publishing. All Rights Reserved.
A long historical experience of monofrequency rheoencephalography (REG) showed its limited capabilities. The new approach ispresented – multifrequency REG that is REG recording simultaneously at three frequencies - 16, 100 and 200 kHz. The different brain impedances received were analysed on the base of equivalent electrical circuits of brain tissue. First, this enables to calculate intra-extracellular electrical component for evaluation of brain tissue hydration state by means of an original computational method. Second, dynamic cooperative analysis of multi-REG and transcranial Doppler pulsations provides the indices of intracranial CSF mobility (CSFm) and cranial compliance (CCe). Third, spectral analysis of processes recorded provides valuable information of regulatory processes involved. The application of this new approach to investigation of intracranial circulation in healthy persons of different aging groupos and in neurosurgical patients showed its promising effectivity.
Keywords: Rheoencephalography, Multifrequency Brain Impedance, Brain Hydration
Article Outline
1. Introduction
- In the middle of the Twentieth Century two alternative methods were developed for the study of cerebral circulation. One of them was based on the clearance effect which allowed progressive measurements of cerebral blood flow in absolute units (ml of blood/100 grams of brain mass/minute) within intervals of a few minutes[1]. The second was derived from a method based on measurement ofelectricalimpedance of biological tissues or more specifically, monitoring of electrical resistance between electrodes placed on different regions of the human body, including the head which had first been known as electroplethysmography and then as rheography or REG[2,3]. Depending on the body region, modifications of this method were named after the specific organ being investigated. In the context of the present paper, dealing specifically with investigations of fluid circulation through the brain, the term Rheoencephalography or REG will be used. Theadvantage of this method is that it is dynamic. The obvious disadvantage is the data received can only be evaluated comparatively.
1.1. Fundamental Background of Monofrequency REG
- The development of this method has a complicated history. In the middle of the Twentieth Century this method was applied to the study of cerebral circulation in both humans and animals[4, 5, 6, 7]. Early application of REG methods began in 1958, when the first fundamental studies appeared[8, 9]. In these investigations the foundations of the method were established, based on the fact that specific electrical conductivities of the main intracranial components - brain tissue, blood and cerebrospinal fluid (CSF) – correlate with the following ratio --1:0.5:0.1, which has been corroborated in recent investigations[10]. Just after the fundamental studies were completed, mathematical simulation verified that the changes of electrical resistance between electrodes placed on the head are proportional to blood/CSF volume relationships in the region between electrodes. These calculations also showed that changes of electrical resistance between electrodes, which depend on blood-CSF volume redistribution, are rather small. Their ranges are 1-1.4% of the total value of the electrical impedance between the electrodes. The changes depend on the frequency of the electrical current being applied to the transmitting electrodes and some other factors. The complex biophysical analysis of the role of all factors forming the pulse wave and similar fluctuations of electrical resistance between electrodes - specific resistance of the brain tissue, blood, and CSF, as well as the processes of polarization at the contact point between the metal electrode and skin connection was summarized in the book “Dynamics of Brain Blood Volume Under Normal Conditions and Gravitational Stresses”[11]. These studies established that the optimal frequencies for REG recording of the human brain range between 80 and 100 kHz. Later these frequencies became the accepted norm by the majority of REG instrument manufacturers through the world. Since the middle of the1960’s REG began to be used in clinical investigations for diagnosis of cerebrovascular pathology and shortly thereafter some guidelines appeared suggesting values for the norm and what significance any deviation might indicate.[12, 6]. Because objective analysis of changes of REG pulsations appeared to be a quite complicated task, numerous (about 50) different empiric criteria for REG pulse wave deformations were developed. However, only a few of them were proven to have an important physiological background. Maximal amplitude, slope of anacrotic increase, and anacrotic-dicrotic phase ratio, for example, were substantiated and only these were retained for use in common clinical practice.After fifteen years of clinical experience using REG methods around the world the consensus opinion for its future was not optimistic. The method had proven to be indirect, sensitive to numerous interferences depending on head and body movements and additionally the diagnostic significance of REG remained ambiguous. Consequently by the end of the 1970’s the usefulness of this method had to be re-evaluated. A careful analysis of REG methodology was performed[13]. This review of the methodology and literature also didn’t present an optimistic picture for the future of REG. The review established that it is impossible to measure CBF indices or to provide a medical diagnosis by REG alone, because numerous peculiarities of the REG pulse wave are not directly connected with CBF but to a great extent are influences from external factors. Therefore any conclusions based on the wave form of the REG recordings must be questionable. Nevertheless, some changes of REG pulse pattern deformation, for example, the appearance of small additional waves in the dicrotic phase were recognized as characteristic for arterial hypertonic disease. On the brighter side it was definitely established that REG, when combined with functional tests (apnoe,hyperventilation, Valsalva and Stookey tests), could provide some indices of cerebrovascular reactivity (CVR). One of the shining successes of REG application was when studying CVR changes in astronaut crews during different stages of space missions as compared to pre-flight investigations[14]. These investigations were accepted as fundamental principles for the reaction of the cerebrovascular system to space flight conditions[15]. During the ensuing years not a single new significant bit of data concerning the informational meaning of REG appeared with the exception that some animal investigations showed REG could be used for drug screening and for evaluation of the limits of CBF autoregulation[16]. General interest in this method decreased.
1.2. Ways to Increase of REG Informational Meaning
- Historical experience with application of REG indicates that this method as a stand-alone instrument provides very limited information useful for physiology or for clinical practice because the wave form reflects volume distribution of both blood and CSF and the signal also contains some significant interferences originating from the subject’s eye, throat, lip and face movements and larger movements of their body. This suggests that broadening the informational meaning of REG should be based on coupling it with another instrument which also reflects the dynamic component of intracranial fluid circulation but which is based on some other physical principle. In the 1980’s the possibility of such an instrument first appeared with the advent of transcranial Dopplerography (TCD)[17]. TCD promised to be the most acceptable partner for the REG methodology.
1.3. Coupling REG and TCD Methods
- By combining the REG and TCD method it is possible to measure pulsations of blood flow velocity simultaneously with the REG wave pulsations. Both methods are capable of monitoring changes during very small increments of the cardiac cycle and their wave forms are synchronous. Investigations carried out using the combination of REG and TCD along with computer processing of their dynamic relation have shown this methodical combination can determine, in comparative units, both CSF mobility in the craniospinal cavity and pulse changes of intracranial volume which represents the dynamic component of Cranial Compliance (CCe)[18, 19]. More specifically, this presents the possibility to monitor comparative changes of the distribution of fluids between extracellular spaces and brain tissue under different conditions. During the last years when this partnering to TCD was reinvigorating the stature of REG as an instrument to monitor brain fluid dynamics, advancements in electronic engineering gave the basic REG instrument a revolutionary new possibility. Thisdevelopment also has an interesting historical background.About 50-ty Years ago simultaneous observations of the comparative changes of the capacitance and resistance components of electrical impedance of applied primary to the human mammary gland during lactation and demonstrated the possibilities to reveal gland dysfunction during the first postnatal days due to milk congestion. Steady state impedance values could reveal peculiarities of milk distribution between extracellular spaces and inside the cells of the secretory glands and thus suggest the appropriate remedy—either hot or cold compresses.[20].These investigations have shown the way to apply this principle to the realm of brain fluid monitoring suggested that the capacitance component of brain tissue impedance may be of value for determination of the brain hydration level. The background of this statement is based on animal investigations with electrodes implanted into the skull which revealed the relation between the capacitance component of brain electrical impedance and the state of brain tissue hydration[21, 22]. Recently, during animal investigations using a hypoxic model it was shown that relations of capacitance and resistance at different frequencies develop differently during hypoxic reaction due to brain tissue hydration [10, 23].
1.4. Multifrequency REG: Background and Advances
- All these investigations stimulated the next stage of REG development - recording of REG, using not one but three or four different frequencies simultaneous from comparatively low to high electrical current which could be realized only recently on the base of modern microelectronics and computer processing. The advantage of this REG modification – now called multiREG - consists in that, depending on the frequency of current used for head impedance measurement, different components of intracranial media are involved in the electrical current conductivity. Firstly, this gives the possibility on the base of values of basic impedance, measured simultaneously on different frequencies, to calculate components of the simplest equivalent electrical circuits of brain tissue first presented many decades ago[24]. This equivalent circuit is composed of a combination of three elements – two resistive and one capacitance. Measured values of basic resistance on three frequencies between the head electrodes allows for the calculation of its components and thus non-invasive evaluation of intracranial passive electrical properties under different physiological and pathophysiological conditions. Secondly, multi-REG in combination with TCD allows for calculations of CSF mobility components by the method described earlier[18] and to calculate slow fluctuations of intracranial components (0.1 – 0.3 Hz), which reflect activities of cerebrovascular auto-regulatorymechanisms [25]. Additionally the informational meaning of the slow fluctuations could be increased by comparison of their amplitudes and rate, at different REG frequencies. Therefore, the present paper has multiple aims: 1). to describe the biophysical background, and informational meaning of the multi-REG as a stand-alone; 2). to describe the additional informational possibilities due to simultaneous recording with TCD; 3). to describe the principles of automating the analysis of the data received.
2. Methods
- Description of the methodical aspects of the multi-REG includes the principles of selection of frequencies, methods for evaluating the values received from each single component of the equivalent circuits between the electrodes placed on the human head and presentation of the results received, including the principles of automated analysis of each fragment.
2.1. Optimal Physical Conditions of MultiREG
- RecordingThe selection of the optimal frequencies for the multi-REG design is based on studies of the dependence of impedance frequencies on different kind of tissues. It has been established that changes of dielectric resistance of tissues is not critically dependent on frequency in the range from 50 to 500 kHz. For instance, for intracranial liquids it is 0% for CSF and up to 9% for blood, for brain tissues 8 -9%; and for skull bones about 10%[10] but the complex impedance for the whole head varies nearly twice as much over the above frequency ranges[11, 22]. This means that the impedance values between electrodes placed on the human head at each frequency are determined by the distribution of the electrical current around or through the particular tissues of the head. From this point of view the frequency ranges for the multi-REG should be as wide as possible. However, the low frequencies of electrical current the limitation is determined by the impedance of extracranial tissues (skin, muscle, fat, membranes), as well as the electrical sensitivity of living tissues, and so a reasonable low frequency limit would be not less then 15-20 kHz[11]. Suggestions about the upper frequency limits have been presented in numerous publications, which indicate these limits are determined by several factors. The frequency ranges should be selected from within the frequency band where there is a linear dependence on intracranial tissue impedance and minimal influence of external and perhaps internal electromagnetic fields, and of parasitic capacitances. Based on these suggestions the optimal level of the upper frequency limit for the multi-REG should be about 200 kHz. Thus, the most acceptable range for the multi-REG should be from 15 to 200 kHz. The lower and upper frequencies should be selected at these points. Taking into account the peculiarities of general frequency dependence of intracranial media, the third frequency should be in the vicinity of 100 kHz. These considerations have been taken into account during design and construction of a prototype version of the multi-REG instrument manufactured by “Mitsar-Medical” St. Petersburg, Russia.
2.2. Instrumentation
- The instrumental complex used in our evaluation of the possibilities and limitations of a multi-REG unit as a basic device for physiological and patho-physiologicalinvestigations as well as for clinical examinations was this new version of the multi-REG instrument mentioned above. For data collection, the analogous- digital transformer “PowerLab-5” from ADI was used with all its software functions including low frequency spectrum analysis. Multi-REG signals were received by three silver plate-electrodes, each one 20 mm in diameter, placed on the human head. A common electrode was placed on the frontal region and two were placed mastoidaly behind the left and right ear. Construction of the multi-REG instrument allows recording all three frequencies signals using just one wire for each electrode. Other equipment used was a two channel transcranial Doppler (DWL Germany) to record linear blood flow velocity at the base of the middle cerebral artery and respiratory transducer for recording chest respiratory movements (ADI-MLT 1132). All devices were controlled by PCs running “Windows-XP”. Methods of recording and analyzing the Doppler/REG signals to evaluate CSF mobility have been described earlier [18].In all investigations signals from the above-mentioned instruments were received onto a multi-channel recording board. Two channels were for right and left hemisphere TCD, six channels were for right and left hemisphere multi-REG pulsations channels (fluid pulsations using three frequencies from each hemisphere) and 3 channels from each hemisphere for DC signals indicating basic impedance values and their possible changes during the investigations. An additional channel was used for recording respiratory chest movements, which is important to differentiate spectrum values of intracranial CSF fluctuations from respiratory chest movements because they sometimes occur at similar frequencies. After the investigations were concluded the most interesting fragments of the recordings were analysed. It is important to emphasize, that for spectrum analysis “PowerLal-5” software used, which is founded on “fast Furier transformer”. For analysis it is necessary to have at least a continuous two minute segment of recording without interferences due to the subject’s facial muscle movements, etc.
2.3. Providing of Investigations
- The investigations were carried out on three aging groups of healthy persons (16-24 years (n=31), 25-50 years (n=39), 51-90 years (n=49), and 8 neurosurgical patients investigated before surgery and during 10 postoperative days. The data received were analyzed in three ways:● Calculations of resistance and capacitance components of the equivalent circuits shown below (Fig.1), on the base of measured impedance levels between electrodes at different frequencies was provided.Significant advance of REG methodology may be based on coupling multiREG with REG-TCD recordings. However, for this it is necessary to automate CCe – CSFm calculation, because manual method, described above[18], is not simple in realization. Automation of calculation of indices, representing CSF mobility (CSFm), dynamic cranial compliance (CCe), For this type of analysis the pulse fluctuations of REG and TCD recorded at100 kHz were used. ● Spectrum diagrams from artifact-free fragments lasting 90-120s from all three multi-REG frequencies were presented at 0 - 0.3 Hz together with TCD pulse spectrum analysis and respiratory chest movements for excluding slow fluctuations not of intracranial origin; thus fluctuations in the TCD spectrum specific to the cardiovascular system and those fluctuations driven by the respiratory system could be identified in the multi-REG spectrums.
2.4. Analysis of Equivalent Electrical Circuits
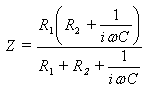
- Measurements of basic resistance between electrodes are possible to calculate by parameters of the most simple head tissue equivalent circuit diagram. Indeed, from the electrical point of view, brain tissue may be represented as a set of resistances and capacities intricately connected to each other. However, the equivalent circuit of the brain is simple (fig. 1)The frequency dependence of brain impedance is
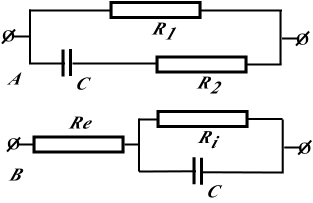 | Figure 1A. Equivalent circuit of the brain (Schwan, 1957).(Circuit I). R1 is the extracellular resistance, R2 is the intracellular resistance and C is the cellular electric capacitance Figure 1B. Equivalent circuit of the brain. (Circuit 2) Re is the extracranial resistance, Ri, is the intracranial resistance and C is the cellular electric resistance |
 | (1) |
 .The equivalent electrical circuit of the brain represented in fig 1(circuit №1) is not exclusive. Brain tissue may be described otherwise (fig1b).In this case brain impedance is calculated as
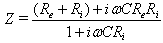 | (2) |
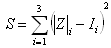 . For solving the minimum of the regression sum we use the quasi-Newton BGFS method, which is programmed into our 2007solve.xls file. These manipulations allow us to evaluate different brain impedance parameters in each of the circuits.
 2.5. Automation of Calculation of CSF Mobility and Cranial Compliance Indexes
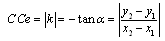
- Coupling of multiREG and monoREG(100kHz) with TCD could significantly expand the fields of REG application and increase its informational meaning. However, calculation of these indexes by manual method[18] is very labour-consuming process and takes much time and attention. Therefore the method of calculation of CSF mobility and CCe indexes is presented by special automation on the base of selecting of systolic and diastolic fragments (pre- and post maximal value of TCD pulse) and exporting these data to Excel window. The first step is normalization of data, which consists in transformation of real ranges of TCD and REG pulse changes to a scale with limits of 0.0-1.0. After this, it is possible to create a “XY” plot (plot 1), where X is Doppler and Y is REG(100kHz). This plot may be approximated by a straight line (line 1). Coordinates of the first point in this line are (X1, Y1 ) and the last point are (X2; Y2). CCe value may be estimated as the negative tangent of the slope angle of this line
 | (3) |
 | (4) |
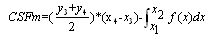
 as the integral sum
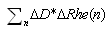 | (5) |
 is the Doppler’s increment
  , and
, and  isthe mean value of multi-REG in the increment’s interval
 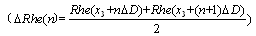 , n changes between 0 and 99.
  isvalue of multi-REG when Doppler value is
  , where
  is the first point of multi-REG in the selected pulse.There by the final value of CSFm may be estimated as follows
  | (6) |
 .In this case we can use standard sum formulas such as SUM to make the estimations above.Thus, coupling multiREG with combination REG(100kHz) and TCD and automation of data calculations is important for wide application of REG methodology, and helps its using in applied physiology, neurology and neurosurgery as noninvasive, comparatively simple and dynamic method for monitoring CBF and CSF dynamics, skull mechanical properties and for evaluation of brain tissue hydration.
3. Results
- Examination of the informational meaning of the new multi-REG was performed in two ways. One was carried out on healthy persons during rest conditions. For investigations persons of three different aging groups have been selected. The second approach included observations of neurosurgical patients with symptoms of brain edema during the first 5 - 7 days after surgery.
3.1. Estimation of Basic Values of Parameters of Equivalent Circuits
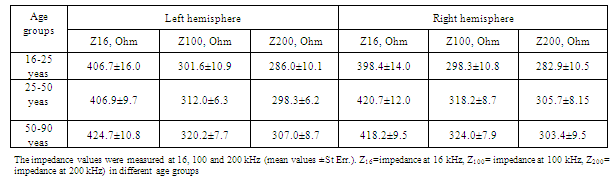
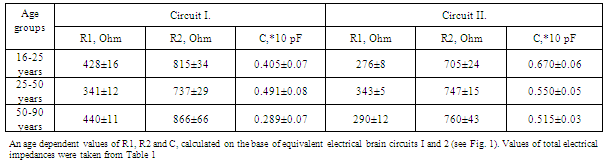
- The results of age related measurements of human head impedance at different frequencies are summarized in Table.1. The results of calculations are summarized in Table.2.For detailed analysis of the resistance and capacitance components of equivalent circuits 1 and 2 their values were grouped for different ages and coupled with the CCe-CSFm plot diagram, constructed with the data obtained and calculated at 100kHz and represented in Fig.2. The frequency of 100 kHz was selected for calculations of CCe-CSFm plot because all our previous calculations were provided at this frequency. The recent research has confirmed this selection, because comparative values of CCe and CSFm at 16kHz and 200kHz are about 5-20% lower than similar data at 100 kHz. These data once again confirm that the selection of 100 kHz is optimal for REG observations. The data presented in Fig.2 shows that there is a significant difference between the components of the equivalent circuits for each age group. This demonstrates that such a method of data presentation is significantly more sensitive as compared to calculations of head impedance measurements based on a “perturbative index”[26, 27].These investigators suggest that the numeric values of cerebral electrical impedance were symmetric in the two hemispheres of the brain at different frequencies (20 kHz, 50 kHz and 100 kHz) and that age, sex and the time of monitoring have no obvious effect on the results of measurements. However, in our measurements presented above, basic impedance and its pulsing components are different for each investigated age group and, as was shown in earlier investigations, human head impedance is characterized by hemispheric asymmetry[28]. Common to our data and the data referenced above is that the values of impedance between electrodes at rest conditions were comparatively stable during the investigations. Additionally our investigations determined the value of impedance between electrodes changed much less than 1% during two hours of observation.
|
|
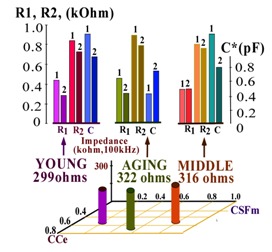 | Figure 2. Differences of position on the “field” of the CCe-CSFm plot of the average values of electrical impedance of different Aging groups (measured at 100 kHz) and the averaged values of the separate of elements of electrical equivalent circuits 1 and 2 |
3.2. Coupling MultiREG with MonoREG - TCD Investigations
- The latter determined the averaged position of calculated values of R1, R2, and C in the CCe-CSFm plate for different aging groups. For the young group the values of CCe and CSFm, calculated from multi-REG recordings at 100kHz, were found as: CCe=0.80±0.06, CSFm= 0.30 ± 0.06; for middle age group CCe=0.49±0.06, CSFm=0.70±0.10; and for elderly group CCe=0.83±0.04 and CSFm=0.47±0.08. This means that cranial compliance as well as CSF-mobility for both young and older subjects is comparatively high. The situation concerned middle-age group is more complicated. In this case some CCe decrease appears to be compensated by CSFm increase. However, the neurological examination shows that in this aging group intracranial compensatory CSF movements are not very active and in some cases are not be fully compensated by CSF mobility. In these cases some neurological dysfunctions might be observed.In the elderly group CCe values increase again and CSFm increases slightly also, owing to special intracranial liquid distribution to assist in brain metabolic supply. Thus, all the above mentioned data indicate that the informational possibilities of the multi-REG method are greater than the usual single frequency REG. Low levels of St. Err. Values shown in table1 and table 2, indicate that under normal physiological conditions intracranial interrelations between liquid media and brain tissue are characterized by comparatively low variations and it explains the comparative stability of data obtained with multi-REG measurements. This is confirmed by the results of the calculations of the elements which compose the equivalent electrical circuits between electrodes placed on the human head. It is necessary to emphasize, that both equivalent circuits proposed are rather primitive, but in general they sufficiently and objectively reflect the special distribution of resistance and capacitance elements. Comparison of the results received by calculations of equivalent circuits I and II give the possibility to reveal a general picture of liquids and brain mass distribution inside the skull. It is necessary to emphasize, that the equivalent circuits presented above are very simple to compare with the real object of investigation – the human head—because it is already known that equivalent circuit distributions of electrical indices between electrodes may include numerous elements[10,11], but the advantage of the circuits shown in Fig.1 is the possibility to calculate each single element. Of course, if even one more frequency were added to the multi-REG instrument, it would be possible to increase the number of elements in the equivalent circuits up to four, but due to comparative low increment of frequency dependence of intracranial tissues in the selected frequency ranges, it would not yield significant results. Nonetheless, the data received leads us to conclude that even these simple circuit diagrams present the general picture of the contribution of extracranial and intracranial components measured by multi-REG data. The results of the basic resistance calculations from the circuit diagrams as seen in Fig.2 add significant informative value to the results of the REG pulsations recorded simultaneously with TCD and analyzed in their direct (time unified) correspondence. Comparison of pulse recordings by REG at three frequencies received simultaneously has confirmed that the most useful frequency is 100 kHz as was established years ago by fundamental experimental animal investigations of REG methodology. Indeed, results of calculations of CCe and CSFm using other frequencies such as 16 and 200 kHz, show that the data received is dynamically similar to the 100 kHz recordings under different conditions, including functional tests, but their values and variations are significantly less.
3.3. Spectral Analysis of Low Frequency MultiREG
- Significant differences are presented in the spectral diagrams of the multi-REG data when viewed in the range of 0-0.3 Hz. The differences can be observed in all of the recorded fluctuations of the multi-REG pulses, at 16, 100 and 200 kHz, in the TCD pulsations and in the fluctuations which reflect respiratory movements of the chest. They are unique for every frequency as well as for the TCD pulse and they are characterized by a number of peaks, which may be both similar and different for every mentioned fluctuation process. Comparison of peaks from any of the recording devices to peaks on other recording devices can give some indication of their origin. This is possible to see this in Fig.3, where spectral diagrams are presented from the TCD, from both hemispheres of the multi-REG and from the chest respiratory movements.
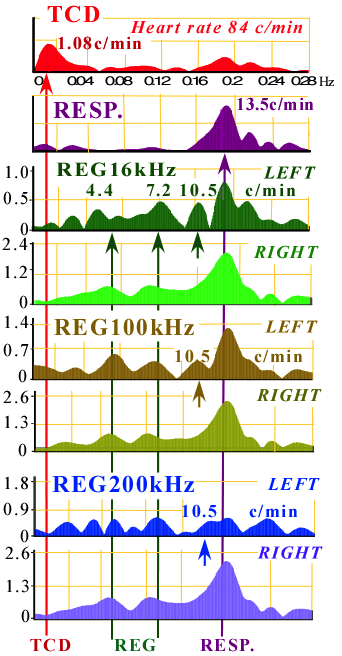 | Figure 3. Spectrum diagrams of slow fluctuations of REG , recorded on three different frequencies together with transcranial dopplerography and respiratory chest movements |
3.4. Peculiarities of Equivalent Circuits Components after Brain Surgery
- In contrast to healthy persons, the calculated R1, R2 and C components of the equivalent circuit in neurosurgical patients show changes over wide ranges depending on the kind of pathology, the surgical interventions, as well as on what postoperative day the investigation was conducted. Eight patients were investigated before and after surgery, but two typical cases each representing a different kind of pathology, were selected for the following analysis. One of them (K, 14 years) suffered from an osteogenic tumor originated from inner plate of temporal bone which compressed the brain inward and down, and the second case (T, 11 years) presented with a tumor of the middle brain which limited the CSF outflow from the brain ventricles; the tumors were removed..The results of the investigations of these neurosurgical patients show that the values of R1, R2 and C significantly change after surgery in comparison to pre-surgery measurements. These changes were most pronounced on the third and fourth day after surgery (Fig.4a).
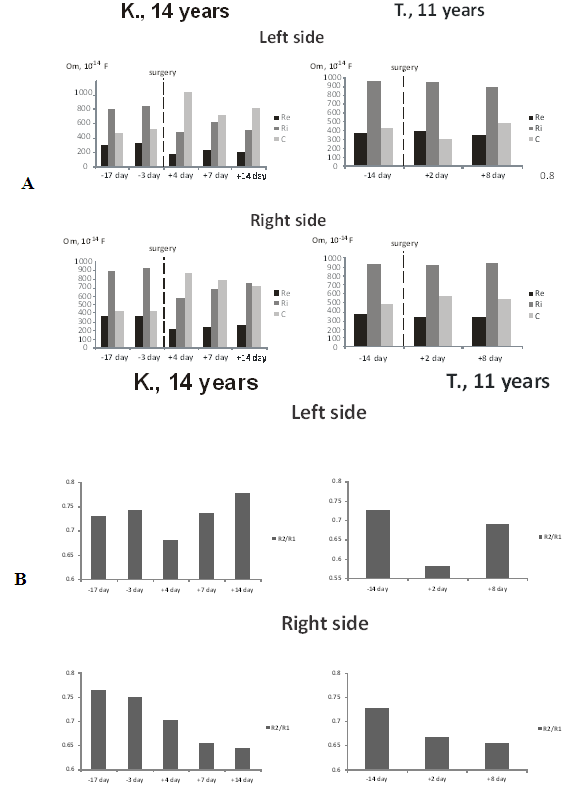 | Figure 4. A-Changes of circuit I components before and after surgery. B- Ratio of intracranial to extracranial resistance before and after neurosurgery |
4.Discussion
- The data represented above definitely shows that multi-frequency REG has significant advantages over the usual single frequency REG. The most important advantage is that the multi-frequency REG gives the possibility to calculate resistance and capacitance elements, particular to extra-cranial and intracranial media by using calculations with two equivalent electrical circuits between electrodes. The data shows that extra-cranial resistance is less than previously suggested and this erroneous belief, which was one reason for the limited utilization of REG during the last three decades of the Twentieth Century, is now dispelled. However, the multi-REG as was shown in the investigations of different aging groups is capable of much more subtle evaluation of the relations of liquid media inside the cranium. This is particularly evident in the results presented of investigations of different aging+ groups combined with results received of CSF dynamics. Significantly the data received from the young and elderly groups have more similarities than either of them has with the middle age group. One explanation given[18] earlier for this phenomena is that for the middle age group the relations between CSF movements and cranial compliance are diminished due to decrease of articular skull bone mobility and thus a limitation of intracranial volume reserves occurs, but with age when some reduction of brain mass has taken place the reserve capacity is restored. Some increase of capacitance in the middle aging group indicates that the comparative volume of CSF and its compensative volume capabilities are minimized at this age. This is but one instance demonstrating that the sensitivity of multi-REG is significantly greater than the single frequency REG. Recently published data also suggests the multi-REG is more sensitive based on the so-called “calculated perturbative index” derived from head bioimpedance measurements[27]. By simultaneously recording the mentioned three frequencies it is possible to account for the specific current distribution of each frequency. This allows the specific contributions of the intracranial media and the extra-cranial tissues to be revealed. The capacitance value of the intracranial media is comparatively high and in this multi-REG model the significant role of changes in the brain tissue component can be evaluated. This is most important because it allows for examination of changes in the level of brain tissue hydration. In other words the distribution of extracellular and intracellular water can be determined.Numerous animal studies investigating the electrical properties of brain tissue and their electrical parameters established that a close connection exists between brain tissue hydration and its electrical parameters. These studies also established that a unique ratio exists between the resistance of brain tissue and its capacitance.[21, 22]. Similar conclusions were reached for the human brain during investigations of brain cellular metabolism. It was shown that the common factor in brain injuries of various causes is actually cellular injury. The injuries affect the cellular metabolism, especially the aerobic oxidative respiration of the cell[35]. This reduces the cell’s capacity to produce energy forces to the cell membrane which leads to the accumulation of active osmotic products in the intracellular space. This results in water accumulation and intracellular swelling or cytotoxic edema[36] as in the early stages of hypoxic ischemia. As a consequence of the edema the electrical parameters of the brain tissue change[37, 38, 39]. This group of investigations establishes that dramatic changes in intracranial electrical parameters accompany most brain injuries. Thus it could be expected that multi-REG monitoring of brain injured patients would likely show changes of intracranial electrical parameters. It is clearly possible to see such changes in the data received during our investigations of neurosurgical patients (fig. 4). In patient K. an osteogenic tumor originated from the inner plate of left temporal bone. Patient T. was diagnosed with intracerebral tumor which compressed and displaced the brain resulted in hydrocephalic syndrome. These examples provide two interesting points: first, the maximal changes of intracranial resistance develop on the second and third day after surgery, which corresponds to the general clinical observation of the patients; secondly the maximal changes of electrical indices occurred not simultaneously in both hemispheres. The changes of electrical data were observed first on the operated hemisphere and then later on the intact hemisphere.Thus, observations on healthy persons of different ages as well as on neurosurgical patients show that significantly valuable data can be obtained noninvasively by means of the multi-REG that relates to the properties of the brain tissue, particularly its hydration state.
5. Conclusions
- The rheoencephalography method is not new. It has progressed with time and technical developments. Its long history is characterized by periods of euphoric enthusiasm and dramatic disappointments. During its inception, enthusiasm for the possibility of noninvasive study of brain blood circulation was high and numerous papers using REG were published. The enthusiasm was dampened over time as the investigations of numerous of skeptics demonstrated this method could not be used for cerebral blood flow measurements. The redemption for REG was its marriage to TCD which then opened new possibilities for the study of CSF dynamics. Another significant step forward came during numerous animal investigations which initiated the idea to use multifrequency measurements. However, between the idea and its realization were years of delay awaiting innovations in microelectronics and computer technology. Finally the possibility arrived to noninvasively monitor the condition of brain tissue, primarily the level of its extracellular and intracellular hydration. Simultaneously recording the multi-REG with TCD provided the possibility to monitor some indices of CSF dynamics along with brain tissue hydration. The REG/TCD combination significantly enlarged the horizons for experiment and clinical application of this method. The comparatively high sensitivity of the multi-REG and the wide variety of indices reflected in the recordings, including slow fluctuations, suggests that such a methodology can detect subtle changes of brain circulatory metabolic supply, which may correspond to even very slight changes of brain cognitive function. Therefore it looks reasonable in perspective to combine multi-REG investigations with some method, which could dynamically reflect changes of brain cognitive function by some psycho-physiological used.Possibilities of multi-REG have not been fully examined. The most interesting data was received by spectral analysis of the pulse fluctuations from the REG, recorded at different frequencies as shown in Fig.3. This figure presents a number of unexpected new elements. The spectrum in ranges 0-0.3 Hz reflects the control processes in the cerebrovascular system, as was previously suggested, but here the recordings present much more information than was thought possible. Indeed, the spectral diagrams of different frequencies are individually unique, which suggests that every frequency reflects its own unique influence to the complicated picture of the real control system supporting the circulatory-metabolic brain system. It is most interesting that it is possible to observe left-right asymmetry in slow fluctuations particularly in some groups of spectral lines which occur in only one hemisphere (shown in Fig.3 by short arrows). These anomalies are at the present time terra incognita in the realm of slow fluctuations. Generally, it is possible to conclude that in our time the dynamic modification of REG method, based on simultaneous measurements at three frequencies, will ascend to new heights and issue in a “Renaissance” period for noninvasive monitoring of the cerebral vascular system, including CSF dynamics and the properties of the brain tissue. It may even surpass computer tomography by virtue that the information is more exact and clinically more useful as well as transportable, easy to use and vastly less expensive than comparable methods.