-
Paper Information
- Next Paper
- Paper Submission
-
Journal Information
- About This Journal
- Editorial Board
- Current Issue
- Archive
- Author Guidelines
- Contact Us
American Journal of Biomedical Engineering
p-ISSN: 2163-1050 e-ISSN: 2163-1077
2012; 2(4): 143-154
doi: 10.5923/j.ajbe.20120204.01
Sub-THz Vibrational Spectroscopy of Bacterial Cells and Molecular Components
 Abstract
 Reference
 Full-Text PDF
 Full-Text HTML
Tatiana Globus 1, Tatiana Dorofeeva 1, Igor Sizov 1, Boris Gelmont 1, Maryna Lvovska 1, Tatyana Khromova 1, Olga Chertihin 2, Yulia Koryakina 3
1Dept. of Electrical and Computer Engineering, University of Virginia, Charlottesville, VA 22904
2Dept. of Medicine, Infectious Diseases , University of Virginia, Charlottesville, VA 22903
3Dept. of Microbiology, Immunology, and Cancer Biology, University of Virginia, Charlottesville, VA 22903
Correspondence to: Tatiana Globus , Dept. of Electrical and Computer Engineering, University of Virginia, Charlottesville, VA 22904.
| Email: |  |
Copyright © 2012 Scientific & Academic Publishing. All Rights Reserved.
In this work, sub-terahertz (THz) spectroscopy is applied to characterize lyophilized and in vitro cultured bacterial cells of non-pathogenic species of Escherichia coli (E. coli) and Bacillus subtilis (BG), spores of BG and DNA from E. coli. One of the goals of this research is to demonstrate that Fourier Transform (FT) spectroscopy in the frequency region of 10–25 cm-1 is sensitive enough to reveal characteristic spectral features from bio-cells and spores in different environment, to verify the differences between species, and to show the response of spores to vacuum and response of cultured cells to heat. The experimental technique was significantly improved for sensitivity and reliability. Observed spectra taken with a spectral resolution of 0.25 cm-1 using FT spectrometer with a detector operating at 1.7 K are rich in well resolved features having spectral widths of ~0.5–1 cm-1. The reproducibility of experimental results was verified and confirmed. Measured spectra from E. coli DNA and from the entire cell have many similarities, thus demonstrating that the cellular components might contribute to the vibrational spectrum of the cell. The results of this work confirm that observed spectroscopic features are caused by fundamental physical mechanism of interaction between THz radiation and biological macro-molecules. Particularly, the analysis of results indicates that the spectroscopic signatures of microorganisms originate from the combination of low frequency vibrational modes or group of modes at close frequencies (vibrational bands) within molecular components of bacterial cells/spores, with the significant contribution from the DNA. The significance of this study is justified by necessity for a fast and effective, label free and reagent free optical technology to protect against environmental and other biological threats, as well as for general medical research. The obtained results show that THz vibrational spectroscopy promises to add quantitative genetic information to the characteristic signatures of biological objects, increasing the detection accuracy and selectivity when appropriate spectral resolution is used.
Keywords: FTIR, E.Coli, B. Subtilis, DNA, Signature, Reliability, Molecular Dynamics
Article Outline
1. Introduction
- Terahertz (THz) vibrational spectroscopy is an emerging field to examine biomolecular structure and dynamics, and to characterize absorption properties of biologicalmaterials in this frequency region. THz radiation exciteslow -frequency internal molecular vibrations that involve intra/inter molecular domains connected by the weakest interactions: weak hydrogen bonds, van der Waals forces and/or non-bonded (hydrophobic) interactions[1, and references therein]. The very far infrared (IR) range of absorption reveals these low-energy vibrations, andtheoretical studies predicted multiple resonances in absorption (or transmission) spectra of biological molecules in the THz frequency (0.1–10 THz ) or millimeter- wavelength (3–300cm−1) range[2]. Organic solid systems and relatively small biomolecules like protein fragments have beensuccessfully characterized in this range to demonstrate sharp spectral features determined by their individual symmetries and structures[3-6]. In this study, sub-THz spectroscopy is applied to characterize lyophilised and in vitro cultured bacterial cells from two non-pathogenic species of Escherichia coli (E. coli) and B. subtilis (BG), spores of BG , and DNA from E.coli cells. E. coli and BG are diverse bacterial organisms that are most commonly used as model organisms for laboratory studies. Bacteria can readily accept, replicate, and express foreign DNA and this makes them powerful agents for studying genes of other organisms in isolation[7]. However, both of these bacterial species have strains, which can be pathogenic to humans and animals. There are tens of thousands E. coli contamination cases every year in the United States. Bacteria can adapt to extreme environments and bacterial pathogens share a common trait that is their ability to live long-term inside the host’s cells[8, 9]. B. subtilis can form endospores in response to nutrient deprivation and to other environmental stresses. Spore can survive during adverse conditions, preserving the cell’s genetic material. Endospores are resistant to heat (>100℃), radiation, many chemicals (i.e. acids, bases, alcohol, chloroform), and desiccation.There has been an increasing need for fast, reliable, non-invasive methods for rapid recognition andcharacterization of bacterial cells and the critical destructive changes inside the living cell. It has already been reported that using Fourier Transform Spectroscopy identification of bacteria and other microorganisms to the level of species is possible in the near- and mid-IR[10, 11]. At the same time many benefits may result from experimental observations of spectroscopic features in the sub-THz region that was not yet widely explored. The most important advantages include low absorption by water vapors and liquid water, at least two orders of magnitude less than in the far IR. Thus, water does not mask absorption by biological materials, and characterization of molecules in solution is possible. Spectroscopic sensors in the sub-range of 10-25 cm-1 do not requireevacuation or purging with dry nitrogen. THzspectroscopy is an optical method, it is nondestructive for living organisms and does not produce health risks in direct scanning of people. THz radiation penetrates non-metallic materials, such as skin and clothing, allowing detection of hidden bio-agents.Bacteria are very complex biological objects. Because of their small size and relatively low absorption coefficient, the THz radiation propagates through an entire object, allowing the genetic material and proteins all contribute to the THz signature of bacteria or spores.THz spectroscopy has already found applications in characterizing biological macromolecules including molecular components of biological cells/spores. Our previous results on characterization of bio-molecules using Fourier transform (FT) spectroscopy detected multiple resonances in transmission/absorption spectra of bio-molecules in the sub-THz frequency region[12-14]. Simulations can help us to interpret the experimental data by assigning spectral features to specific molecular motions, and simultaneously with experimental characterization computational modeling techniques have been developed using the energy minimization, normal mode analysis and molecular dynamics (MD) approaches to predict low frequency vibrational absorption spectra of short artificial DNA, and RNA[12, 15-18], large macromolecules of DNA[19, 20] and proteins[21, 22]. Direct comparison of experimental spectra with theoretical prediction for a short chain RNA fragment with known structure showed reasonably good correlation[12, 17] validating both experimental and theoretical results. Some of cellular components of E. coli, DNA, transfer RNA[20], and protein thioredoxin[21, 22] were also characterized, and absorption spectra of relatively small macromolecules were simulated using MD. Vibrational frequencies from simulated spectra for components correlate rather well with the observed features. Although experimental difficulties have severely limited the direct identification of phonon modes in biological materials at submillimeter-wave frequencies inthe past, nevertheless, the spectral response of both, relatively small and macromolecules, revealed spectral features caused by interactions between radiation and the biological material. Thus, multiple resonances due tolow frequency vibrational modes within biologicalmacromolecules, components of bacterial organisms, areunambiguously demonstrated experimentally in the sub-THz frequency range in agreement with the theoretical prediction.Several challenges however arise when trying to characterize an entire microorganism. In the past, transmission spectra of bio-particles (cells and spores) have been investigated in the sub-THz range using photomixing[23-25] and FTIR technologies[12, 26-31] with a relatively good spectral resolution, better than 0.25 cm-1 Spectra reveal detectable resonant features in the range below 25 cm-1. To enhance the sensitivity, we used a Fourier spectrometer model FTS-66v with a Si-bolometer operating at 1.7 K. Nevertheless, the intensity of spectral features in most cases was only 1-2 % for solid samples, and the reproducibility was not good. There was always a probability to mix real spectral features with artifacts of measurements. In addition, there are still many fundamental disagreements and challenges in the field. The researches, who use pulsed time-domain spectroscopy, usually observe only smooth broad absorption bands in spectra of biological macromolecules, and there is still a wide spread skepticism caused by large density of overlapping states contributing to absorption bands that might obscure vibrational resonances and yield essentially structureless spectra. Although this last statement can be argued since vibrational bands in spectra of macromolecules are observed and very well studied in the far IR region at even higher density of states, nevertheless low intensities of spectral features and their variability still support the skepticism.The existing controversies in relatively young sub-THz spectroscopy field are caused in most cases by a poor spectral resolution and sample preparation techniques that are not adequate to the problem. In particular, the samples used with time-domain spectroscopy are often prepared in the form of thick pellets from the mixture of biomaterials with polyethylene powder that cause multiple reflection effects on pellet surfaces. These geometrical optic effects mask characteristic spectral features and prevent application of good spectral resolution required for resolving relatively narrow lines.In addition, there are challenges in estimates of decay time scales, an important problem concerning THz oscillations in biological molecules and species. It is clear that the decay (relaxation) time is the factor limiting the spectral width and the intensity of vibrational modes, the required spectral resolution, and eventually the discriminative capability of sub-THz spectroscopy. At the same time, the entire mechanism that determines intra-molecular relaxation dynamics is still not completely understood. There is a number of related studies, and the relaxation time scale between 1 ps and tenths of ns is discussed in recent works[32,33] (see section 4). These uncertainties have to be eliminated to justify the choice of spectral resolution in experiments as well as for calculating absorption spectra from MD simulation. In our simulations, we used till now the relaxation time estimated from the observed width of spectral lines.In this work, the experimental THz spectroscopy technique was significantly improved for sensitivity and reliability thus resulting in more reliable signatures from macromolecules and bacterial cells/spores. Earlier it was only possible in most cases to receive intensities of vibrational modes in transmission not higher than 1-2% when solid samples characterized. The correct choice of substrate type, material concentration in solution or suspension and material alignment in thin layer deposition procedure permitted us to significantly enlarge intensities of modes and reproducibility of frequencies of resonance features when using Bruker FT66v. Transmission /absorption spectra observed in this study, taken with a spectral resolution of 0.25 cm-1 using FT spectrometer with a detector operating at 1.7 K are rich in well resolved features having spectral widths of ~0.5–1 cm-1. The reproducibility of experimental results was verified and confirmed. Similar experimental technique wassuccessfully applied in the last several years to enhance spectroscopic features from not only natural macromolecules and bacterial cells/spores[31], but from artificial molecules as well[18, 34-35], thus resulting in more reliable signatures.One of the goals of this research is to demonstrate that FT spectroscopy in the range of 10–25 cm-1 is sensitive enough to reveal characteristic spectral features from bio-cells and spores and their molecular components, to verify the differences between species, and to show the response of spores to vacuum and response of cultured cells to heat. Analysis of the sub-THz absorption spectra revealed some differences between species of B. subtilis and E. coli. High temperature treatment (~100℃) was used as a method of destruction of living cells and it was found to have a detectable effect on transmission/ absorption spectra by changing certain resonance frequencies. Effects that desiccation has on the transmission spectra of spores were studied as well. The FT IR spectroscopy appears to be sensitive enough to detect the differences between cultured (grown in the laboratory) and thermally treated cells. It has also been demonstrated that different substrates can modify the orientation of bacterial cells in the sample. The orientation effects are more pronounced in DNA spectra since molecules can be significant in length (compared to width) and therefore can be preferentially oriented during sample preparation. In addition, absorption spectra have been studied for quantitative characterization of samples with different amount of biomaterial. The important motivation of our research is however to demonstrate the physics behind observed spectroscopic features. The method we used is based on comparison of experimental absorption spectra of relatively smallmacro-molecules, components of bacterial cells, with molecular dynamics (MD) simulation. The work revealed several important results. Simulated spectra for components correlate rather well with experimental data. These results confirm that observed spectroscopic features are caused by fundamental physical mechanism of interaction between THz radiation and biological macro -molecules. At last, the decisive confirmation is obtained in this work from direct comparison between E. coli DNA and E. coli cell absorption spectra that show many similarities. This is one of our the most important experimental results demonstrating that DNA indeed contributes significantly to the absorption spectra of an entire cell. Therefore, we conclude that the combination of sub-terahertz vibrational modes from molecular components of bacterial cells/spores contribute to the spectroscopic signatures of microorganisms. Particularly, the analysis of results indicates that the spectroscopic signatures ofmicroorganisms originate from the combination of low frequency vibrational modes or group of modes at close frequencies (vibrational bands) within molecular components of bacterial cells/spores, with the significant contribution from the DNA The significance of this study is justified by necessity for a fast and effective, label free and reagent free optical, reliable, non-invasive methods for detection and identification of biological and chemical materials and organisms to protect against environmental and other biological threats, as well as for general medical research. The obtained results suggest that THz vibrational spectroscopy promises to add quantitative genetic information to the characteristic signatures of biological objects, increasing the detection accuracy and selectivity when appropriate spectral resolution is used.The benefits from this study results are based on broad potential dual applications of vibrational spectroscopy of microorganisms together with generated data base, which include rapid detecting and identification of bio threat and environmental agents, food quality and watercontaminations control, disease diagnostic and therapy. New THz molecular recognition signatures that are complimentary to those present in IR and UV pave the road for development of sensitive optical biosensors with increaseddiscrimination of biological threats and in more varied environments. Simulated and experimental results from this project permit us to find the optimal sub-range with the maximum number of the most intense absorption lines to build spectroscopic sensors with the best detection and discriminative capability.Although significant progress in experimental THz spectroscopy was demonstrated and reliable information was received for transmission/absorption spectra from different species, the spectral resolution of Bruker spectrometer (0.25 cm–1 ) still does not provide good discriminative capability. Very recently, sub-THz characterization with better spectral resolution became possible, and we plan to continue this study and present the new, highly resolved spectroscopic results in the nearest future.
2. Materials and Methods
2.1. Materials
- Lyophilized B.subtilis cells from Sigma were used in this work. BG spores from Dugway Proving Grounds (DPG)[26] were used in a form of a milled powder. E.coli DNA, Deoxyribonucleic acid, sodium salt, from E. coli strain B, type VII, was purchased from Sigma (USA) and re-hydrated to a concentration of ~60 mg/ml.BL21 (DE3) strain of E. coli cells was purchased from Novagen (USA). Cultured cells were grown aerobically in the Luria Bertani (LB) broth at 37℃. Obtained cell culture was centrifuged and wet pellet was suspended in the LB broth to a concentration of ~50 mg/ml (recalculated from the dry material). B. subtilis subsp. spizizenii 6633TM strain was purchased from ATCC (Manassas, VA). B. subtilis culture was grown aerobically at 30℃ for 48 hours. Obtained cell culture was centrifuged, and wet pellet was suspended in Nutrition Broth Medium (NBM) to a concentration ~ 120 mg/ml (recalculated from dry material). Half of the prepared E. coli and B.subtlis cultured cell suspensions was subjected to the heat treatment. During thermal treatment the cells were heated in the oven at 100℃ for 1 hour. Heat treatment was used as a method of cell destruction since high temperatures irreversibly damage the cells by altering the cell walls and membranes, damaging proteins, and nucleic acids.
2.2. Sample Preparation
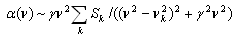
- BG spores and lyophilized BG cells were mixed with distilled water in 1:5 ratio and set aside for 24 hours. Half of the mixture with cells was heated at 100℃. Liquid and air-dried samples for the spectra measurements were prepared from the three suspensions (spores, cells, and thermally treated cells) by pipetting 5–30 µl aliquots onto a surface of polytetrafluoroethylene (PTFE) disposable IR cards (International Crystal Laboratory) or other substrates. The PTFE cards are characterized by a high transmission level (~ 98%) and by an absence of strong peaks in the frequency range of 10–25 cm-1 (See Figure 1). The transmission spectra of elongated particles are sensitive to the direction of the electric field of radiation. Bacterial cells are rod-shaped and some orientation effects are expected. Orientation effects are even stronger for DNA samples, since DNA strands are very long. Although sample material could not be completely aligned on the substrate, we applied the mixture only in one direction, to form a 5 mm x 7 mm oval in the center of the card to ensure a constant sample preparation protocol. Additional advantage of this procedure is that the thickness of the sample material inside the aperture is not uniform. This approach results in eliminating or significant reducing of interference effects, which might occur when thin samples are characterized. This very simple procedure for the sample preparation results in a rather high intensity of spectral features, much more pronounced compared to the spectroscopic features from materials in a very dilute solutions (0.1–0.01 mg/ml)[14]. Measurements on the liquid samples started about 5 minutes after preparation and continued until all excess water evaporated and the sample material dried. Dry samples were measured again after 1 hour and after 24 hours. Additional drying occurred while taking measurements under vacuum.
2.3. Measurements of transmission spectra
- Transmission spectra were measured in the spectral range of 10 – 25 cm-1 using commercial FTIR infrared spectrometer, Bruker IFS66v equipped with a mercury lamp and with a Si-bolometer that is used for signal detection (operating at 1.7 K). The parameter settings for measurements were: aperture 12 mm, beam-splitters Mylar 75 and 125 μm, scanner velocity 80 KHz. A cooled filter with a cut-off frequency of 35 cm-1 was used inside the bolometer cryostat (when using beam-splitter 125um). Each data point is an average of 32 scans. The experimental technique is described in more details in earlier publications[13, 18]. Spectral resolution for all experiments was 0.25 cm-1, which is the smallest allowable setting in the hardware. The choice of the spectral resolution is important. With poor resolution, resonance features have diminished intensity and spectra look flat. Spectral resolution of 0.25–0.3 cm-1 allows us to observe spectra rich in resonance features with the spectral lines width of 0.5–1 cm-1. These spectral line widths are of the same order as those observed in the experiments with high resolution photomixing spectroscopy at higher frequencies (~1THz)[4-6]. Test measurements indicate about 80% polarization of the radiation with electric field vector oriented in the vertical direction in Bruker spectrometer. Some materials show sensitivity to the direction of the electric field of radiation. In our notation, angle of 90º corresponds to the vector of electric field of radiation parallel to the direction of material alignment. Rotating the sample by 90º clockwise corresponds to 0º orientation.A prepared sample was mounted on the standard Bruker sample holder and placed inside a sample compartment in the focus of the beam. The optics inside Bruker (except sample compartment) was under vacuum of 10 mbar. Because there is almost no disturbance from water vapors in the 10 – 25 cm-1 range, all samples were measured without evacuating the sample chamber. However, some measurements were also done with the sample chamber under vacuum. Measurements that were done without evacuating the sample chamber show the disturbance from water vapors at the absorption band around 18.6 cm-1. Therefore, the region from 18 – 19 cm-1 is not included in the plots in most cases. Each sample was measured multiple times and the results for the dry samples were later averaged.
2.4. Modeling Absorption Spectra
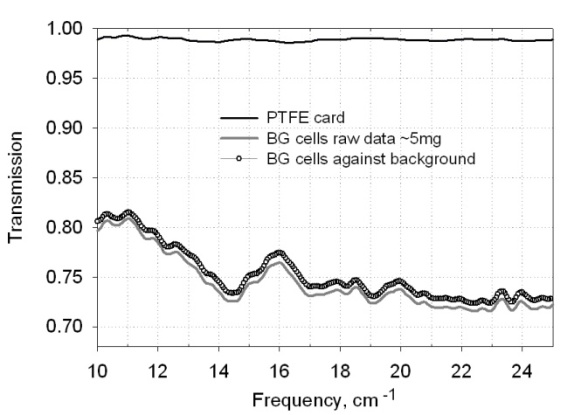
- Our MD simulations were described in previous works[12,16,17] with the most detail analysis of procedures, protocols and parameters in the latest publication[22]. The obtained phonon modes can be convoluted to derive the far IR absorption spectrum of a molecule.
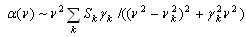 | (1) |
 | (2) |
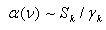 | (3) |
2.5. Transmission and Absorption Calculations
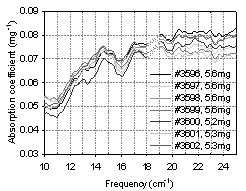
- Where m is the mass of material in mg, T is transmission. The amount of material in the sample was calculated from
 | Figure 1. Transmission of PTFE substrate, BG cells raw data, and BG cells relative to the substrate background |
 | (4) |
2.6. Substrate Selection
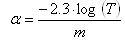
 | Figure 2. Transmission spectra of lyophilized BG cells on PTFE and SF substrates |
3. Results
3.1. Reproducibility and Reliability
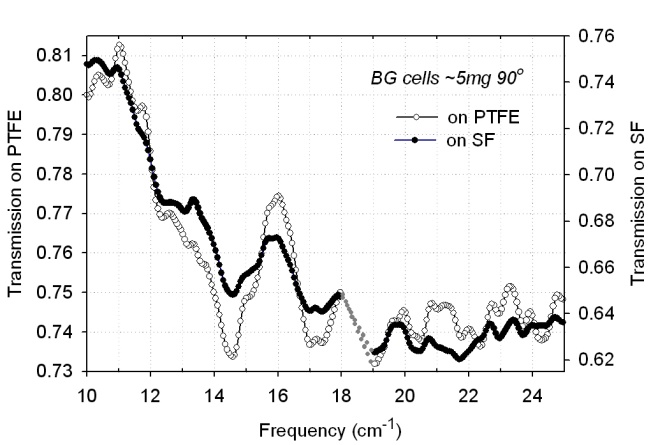
- The reproducibility of our experimental characteriza -tion is demonstrated in Fig. 3. The figure depicts the transmission curves of the same sample taken 24 hours apart. The difference in the absolute value of transmission reflects sample drying with time. We attribute higher transmission on the second day (solid circles) to lower moisture content. he initial measurements (open circles) were taken only 30 minutes after sample preparation, and as a result it is highly likely the sample was still not completely dry, whereas after 24 hours all excess water had a chance to escape, resulting in a higher transmission level. The positions of the transmission minima (vibrational frequencies), however, correlate very well between the two spectra. There is not a single feature that was not reproduced after 24 hours from initial measurements.To obtain the repeatability, one sample containing approximately 5 mg of thermally treated BG cells was
 | Figure 3. Reproducibility of spectra measured over 24 hrs period (thermally treated BG cells, 2.5 mg, 90º) |
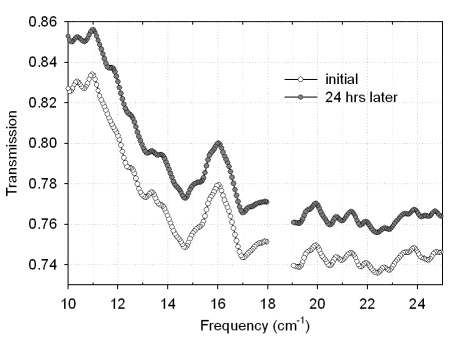
 | Figure 4. Absorption coefficient |
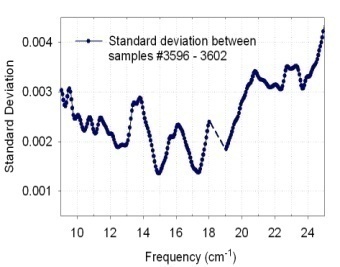 | Figure 5. Standard deviation |
3.2. Transmission Level Of a drying Sample
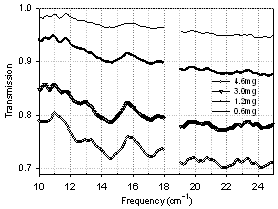
- Transmission level can vary depending on the amount of the biomaterial, water content, and substrate. Fig. 6 depicts transmission level scaling with varying amount of water. In the figure, a partially wet sample containing ~15 µl of suspension was measured continuously while the sample was drying. Initially, with high water content in the sample, the transmission level is lowest (0.72–0.78). As excess water evaporates the transmission level rises (0.88–0.95). The positions of the transmission minima (absorption peaks) on the frequency scale are fairly reproducible; for example, minima at 14.5 cm-1 and at 17 cm-1 do not change during sample drying. In addition, from Fig. 6, it can be seen that the peak intensity is higher when the sample is still wet. As sample dries, the peak intensity decreases; this was demonstrated in our earlier work[13].
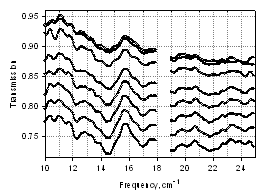 | Figure 6. Transmission spectra of BG spores, wet through dry, orientation 90º |
3.3. Orientation
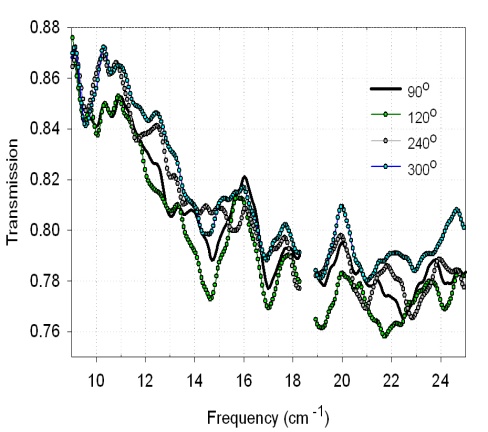
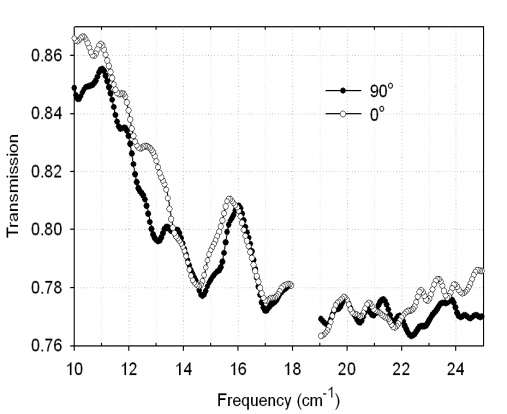
- We did expect that BG cells should be more prone to the orientation effects because they are much longer than spores. This is indeed the case as shown in Fig. 7 that shows spectra of lyophilized BG cells with ~5 mg of material at 0° (open circles) and 90° (solid circles) Cell spectra are very similar to one another in both orientations, and yet at 90° we consistently observed a unique transmission minimum occurring at 13 cm-1 and two smaller peaks at 13.6 cm-1 and 21cm-1.Fig. 8 shows spectra of E. coli DNA for several measurement angles. Orientation effects can be clearly seen. Transmission minima change intensity and positions on the frequency scale while the sample is measured at different angles relative to the polarization of the light.
 | Figure 7. Transmission spectra of BG cells at two orientations |
 | Figure 8. Transmission spectra of E. coli DNA at 4 orientations |
3.4. Scaling of Absorption Coefficient with the Amount of Material
- Fig. 9 shows the transmission spectra of four dry samples with varying amounts of BG spores. Qualitative scaling with mass is observed: more material leads to a lower transmission. At the same time, the positions of transmission minima do not change significantly from sample to sample. The overall pattern of the transmission spectra is well preserved even though transmission levels change. Specific absorption spectra (for 1 mg of biomaterial) were recalculated from the transmission and the results are shown in Fig. 10. Not only is the position of most peaks reproducible in all spectra, but absorption features become much stronger and more resolved in the samples with less biomaterial content, revealing more features than the spectra with higher amounts of biomaterial. For example, a rather broad single absorption peak at 14.5 cm-1, which is present in the spectrum of 4.6 mg sample, splits into two peaks at 14.2 cm-1 and 14.8 cm-1 as the amount of biomaterial decreases to 0.6 mg. All samples, except the one with lowest biomaterial content, give the same absorption coefficient value in the low frequency sub-range, while at the high frequency end, specific absorption coefficient seems to grow with the decreasing amount of material. The different absorption coefficient level in a sample with 0.6 mg of spores can be due to a nonuniform distribution of biomaterial in a suspension and possibly some loss of biomaterial during sample preparation.
 | Figure 9. Transmission spectra of dry BG spores, scaling with mass |
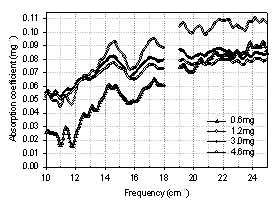 | Figure 10. Absorption coefficient spectra of dry BG spores at orientation 0º |
3.5. Spores in Air and Vacuum
- We also wished to ascertain what effect desiccation has on the transmission spectra. Additional measurements were performed in the vacuum at the level of ~5 mbar. The absorption coefficient spectra of BG spores dried in air (solid circles) and the vacuum (open circles) calculated from the transmission are presented in Fig. 11. Three observations can be made from comparison. First, water contribution may influence the absorption of the samples dried in the air. When samples are placed in the vacuum, water molecules that are stuck to the substrate and spore surface are removed and absorption can change. This will result in a reduced absorption coefficient. Second, the intensity of absorption peaks in the vacuum is slightly smaller compared to air. This effect is supported by our previous work[13] where we observed that vibrational modes intensity of a dry biomaterial is much weaker than the same modes from material in a liquid environment. Third, drying in vacuum results in new absorption features. Specifically, additional absorption peaks are revealed at 13.7, 15.3, 21.2 and 22 cm-1 for the sample in the vacuum, while the peak at 11.5 cm-1 (in the air) disappeared in the vacuum. Also the maximum at 17.1 cm-1 observed for the sample in air shifts to 16.7 cm-1 in vacuum.It has been documented that the spores can survive extreme desiccation for extended periods of time without any serious side effects[37, 38]. In our experiments, spores were exposed to a low vacuum for less than 20 minutes. Although this was not enough to cause permanent damage, perhaps our technique is able to detect small changes within the spores as a response to dehydration. These changes may or may not be harmful to the spore. More experiments are necessary to find the answer.
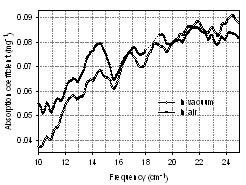 | Figure 11. Absorption coefficient spectra of BG spores (3 mg, orientation 0º) in air and in vacuum |
3.6. Absorption Spectra: BG Spores vs. Lyophilized cells
- BG cells transform into spores intra-cellularly during harsh environmental conditions, which would normally kill cells. Sporulation allows cells to preserve their genetic material; spores are also denser and have smaller water content than cells. The center of the spores, the core, consists of the cytoplasm, tightly bound and condensed DNA, ribosomes, enzymes and everything that is needed to function once returned to the vegetative state. The core is dehydrated, which is essential for the heat resistance, long-term dormancy and full chemical resistance. The core has large amounts of dipicolinic acid (DPA), which is not present in vegetative cells. DPA protects spore from heat and UV radiation. Outside the spore is protected by the coat containing several protein layers that are impermeable to most chemicals[39,40]. There are many common features between cell and a spore. However, cells have higher water content and have a more complicated structure, thus we expect that the differences might be revealed in the THz transmission and absorption spectra and allow us to distinguish cells from spores. Although we did not observe significant differences between cells and spores at 0° orientation, the 90° spectra have more distinguishing features as highlighted in Fig. 12. There are several new peaks in the cell absorption spectra at 11.7 cm-1, 13 cm-1, 19.7 cm-1 and 21 cm-1. Besides that, cells have a shoulder at 15.2 cm-1 and the peak at 17 cm-1 in cell spectra is shifted to 17.2 cm-1 in spore spectra. Spores also have a peak at 20.1cm-1 that the cell spectra do not possess.
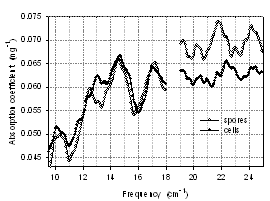 | Figure 12. Absorption coefficient spectra of BG lyophilized cells and spores, ~ 5mg, orientation 90º |
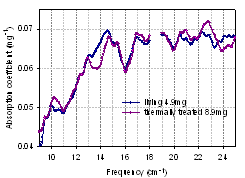
3.7. Thermal Treatment of Cultured Cells
 | Figure 13. Absorption spectra of thermally treated and untreated B subtilis cells (90°, PTFE substrate, dry) |
 | Figure 14. Absorption spectra of thermally treated and untreated E. coli cells (90o, PTFE, dry) |
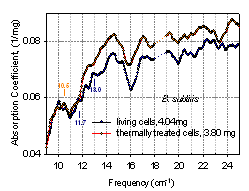
3.8. Absorption Spectra from different Biological Species
- The ability to discriminate between the different bacterial species quickly and reliably is important. For example in a medical field it would enable a faster and more tailored treatment once bacterial organism is identified. Spectroscopic signatures of air-dried living cells E. coli and B. subtilis are depicted in Fig. 15. The resemblance of the spectra is obvious. The main shape of the curves, peak positions and their intensities are rather close. In the averaged absorption spectrum of E.coli, several bands are apparently slightly shifted to lower frequencies compare to the spectra of BG. Although some specificity could be found, particularly in the 9 – 13 cm-1 and 21 – 24 cm-1 ranges, better spectral resolution is required for more certain discrimination result.
 | Figure 15. Sub-THz absorption spectra of E. coli and B. subtilis living cells (PTFE substrate, dry) |
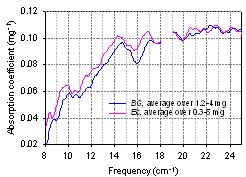
3.9. Absorption Spectrum of E. coli DNA
- Bacterial cells do not contain nucleus, but rather DNA is contained in the cytoplasm. It is typically a single, closed circle concentrated in the region called nucleoid. There has been extensive research for decades on the characterization of different cell components such as DNA, proteins, etc. We chose to characterize the E.coli DNA, which constitutes 5 – 15% of an entire cell weight[41]. Fig. 16 shows the absorption coefficient spectrum of E.coli DNA in air using interference technique, and the average results over 7 samples with the mass from 1.2 mg to 5.2 mg demonstrating reproducibility. The measurements were performed to examine how and to what extent the DNA might contribute to the transmission spectra of an entire cell. Spectra with approximately equal mass of the biomaterial were analyzed for the similarities and differences. Since the amount of the DNA inside the cells is less than the amount in the DNA only samples, we expect to see stronger spectroscopic features in the DNA only samples. Although DNA may have strong features, some of them can be masked inside the cell and also altered as the DNA interacts with the cytoplasm and the other molecular structures. Fig. 17 below shows a spectrum of E. coli DNA (2.1 mg) and a spectrum of E. coli cells (3.3 mg). Although, the mass of the DNA sample is somewhat smaller, its spectroscopic features are stronger, and both samples have a comparable transmission level. New features can be seen in the DNA spectrum, just as expected. Nevertheless, the similarity of two spectra and so the contribution from the DNA to the spectrum of cells are obvious. This result can be understood since many other components of a cell are much less absorbing at THz than DNA.
 | Figure 16. Absorption spectra of E. coli DNA |
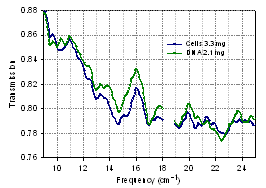 | Figure 17. Transmission spectra of E. coli cells and DNA on PTFE substrate |
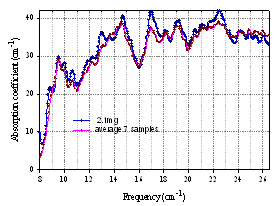
4. MD Simulation and Discussion
- We could not compare experimental spectra from the E. coli DNA shown in Fig. 16 with modeling since a large size of this macromolecule prevents direct application of MD simulation at the current level of computational capabilities. However, some components from bacterial cells and spores are relatively small macromolecules, and the absorption spectra of these entire molecules can be calculated directly from MD simulation of their vibrational modes. One example is shown in Fig. 18 for the tyrosine transfer RNA (tRNAtyr) from E. coli, where the simulated spectrum is compared with experimental absorption. THz spectrum of this molecule (74 bases and about 40000 atoms including water) was simulated using MD [20], and a similarity between measured and calculated spectra is obvious. Proteins are more difficult to perform the simulations. Nevertheless, rather good results were received for the protein thioredoxin from E. coli (see Fig. 19) after improving the convergence of simulation[22], thus validating both, the experimental and theoretical results. Therefore, multiple resonances due to low frequency vibrational modes within biological macromolecules, components of bacterial organisms, are demonstrated in the sub-THz frequency rangeexperimentally in agreement with the theoretical prediction.
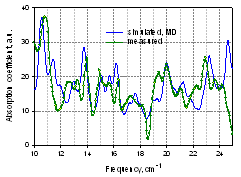 | Figure 18. Sub-THz vibrational absorption coefficient spectra of tRNAtyr(E. coli) in water: spectra simulated and measuredwith spectral resolution of 0.25 cm-1[20] |
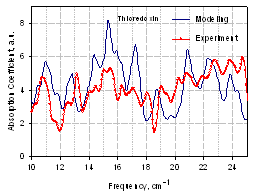 | Figure 19. Sub-THz vibrational absorption coefficient spectra of protein thioredoxin from E.coli simulated and measured with spectral resolution of 0.25 cm-1[22] |
5. Conclusions
- Significant progress in experimental THz spectroscopy has been made in the last 2-3 years to improve the sensitivity of THz spectroscopic characterization of bacterial cells and spores to secure reproducible results. The correct choice of substrate, material concentration in solution or suspension and material alignment at deposition permitted us to significantly enlarge the intensities of modes and the reproducibility of frequencies when using Bruker IFS66v with the spectral resolution of 0.25 cm-1. Our results demonstrate the contribution from the cellular molecular component to the vibrational spectrum of the entire cell and confirm that observed spectroscopic features are caused by fundamental physical mechanism of interaction between THz radiation and biological macromolecules. It became clear, however, that further improvement of sensitivity and especially of discriminative capability using sub-THz vibrational spectroscopy, as en effective method for characterization of bacterial organisms requires even better spectral resolution. There are evidences that the processes with different relaxation time, including long lasting processes, do exist, thus justifying the application of highly resolved spectroscopy. This promises characterization with better spectral resolution to become possible, and we work in this direction in our next study.
ACKNOWLEDGEMENTS
- This work was supported by grants #HDTRA 1–08–1–0038 and ARO # W911NF–08–1–0138. The authors are very grateful to Dr. Ngai M. Wong for drawing our attention to the problem as well as for critical discussions.