Fatma Taher1, Naoufel Werghi1, Hussain Al-Ahmad1, Rachid Sammouda2
1Department of Electronic and Computer Engineering, Khalifa University, Sharjah, UAE
2Department of Computer Science, King Saud University, Saudi Arabia
Correspondence to: Fatma Taher, Department of Electronic and Computer Engineering, Khalifa University, Sharjah, UAE.
| Email: |  |
Copyright © 2012 Scientific & Academic Publishing. All Rights Reserved.
Abstract
The early detection of lung cancer is a challenging problem, due to the structure of the cancer cells, where most of the cells are overlapped with each other. This paper presents two segmentation methods, Hopfield Neural Network (HNN) and a Fuzzy C-Mean (FCM) clustering algorithm, for segmenting sputum color images to detect the lung cancer in its early stages. The manual analysis of the sputum samples is time consuming, inaccurate and requires intensive trained person to avoid diagnostic errors. The segmentation results will be used as a base for a Computer Aided Diagnosis (CAD) system for early detection of lung cancer which will improve the chances of survival for the patient. However, the extreme variation in the gray level and the relative contrast among the images make the segmentation results less accurate, thus we applied a thresholding technique as a pre-processing step in all images to extract the nuclei and cytoplasm regions, because most of the quantitative procedures are based on the nuclear feature. The thresholding algorithm succeeded in extracting the nuclei and cytoplasm regions. Moreover, it succeeded in determining the best range of thresholding values. The HNN and FCM methods are designed to classify the image of N pixels among M classes. In this study, we used 1000 sputum color images to test both methods, and HNN has shown a better classification result than FCM, the HNN succeeded in extracting the nuclei and cytoplasm regions.
Keywords:
Lung Cancer Detection, Sputum Cells, Thresholdong Technique, Image Segmentation, Hopfield Neural Network, Fuzzy C-Mean Clustering
1. Introduction
Lung cancer is considered to be as the main cause of cancer death worldwide, and it is difficult to detect in its early stages because symptoms appear only at advanced stages causing the mortality rate to be the highest among all other types of cancer. More people die because of lung cancer than any other types of cancer such as: breast, colon, and prostate cancers. There is significant evidence indicating that the early detection of lung cancer will decrease the mortality rate. The most recent estimates according to the latest statistics provided by world health organization indicates that around 7.6 million deaths worldwide each year because of this type of cancer. Furthermore, mortality from cancer are expected to continue rising, to become around 17 million worldwide in 2030[1]. There are many techniques to diagnosis lung cancer, such as Chest Radiograph (x-ray), Computed Tomography (CT), Magnetic Resonance Imaging (MRI scan) and Sputum Cytology[2]. However, most of these techniques areexpensive and time consuming. In other words, most of these techniques are detecting the lung cancer in its advanced stages, where the patient’s chance of survival is very low. Therefore, there is a great need for a new technology to diagnose the lung cancer in its early stages. Image processing techniques provide a good quality tool for improving the manual analysis. A number of medical researchers utilized the analysis of sputum cells for early detection of lung cancer[3], most recent research relay on quantitative information, such as the size, shape and the ratio of the affected cells[4].For this reason we attempt to use automatic diagnostic system for detecting lung cancer in its early stages based on the analysis of the sputum color images. In order to formulate a rule we have developed a thresholding technique for unsupervised segmentation of the sputum color image to divide the images into several meaningful sub regions. Image segmentation has been used as the first step in image classification and clustering. There are many algorithms which have been proposed in other articles for medical image segmentation, such as histogram analysis, regional growth, edge detection and Adaptive Thresholding[5]. A review of such image segmentation techniques can be found in[6]. Other authors have considered the use of color information as the key discriminating factor for cell segmentation for lung cancer diagnosis[7]. The analysis of sputum images have been used in[8] for detecting tuberculosis; it consists of analyzing sputum images for detecting bacilli. They used analysis techniques and feature extraction for the enhancement of the images, such as edge detection, heuristic knowledge, region labelling and removing In our contribution, we approached the segmentation of sputum cells problem by using two techniques: Hopfield Neural Network (HNN) and Fuzzy C-Mean Clustering Algorithm (FCM). The sputum color images are prepared by the Papanicalaou standard staining methods into blue dyes and red dyes images[9]. However, the sputum images are characterized by a noisy and cluttered background patterns that make the segmentation and automatic detection of the cancerous cells very problematic. In addition to that there are many debris cells in the background of the images. We aim to design a system that maximizes the true positive and minimizes the false negative to their extremes. These force us to think about a pre-processing technique which can mask all these debris cells and keep the nuclei and cytoplasm. In the literature we found that, there have already been attempts to solve this problem using heuristic rules[10], thus we propose to address the problem by improving the thresholding technique which was used in[10]. In this method we want to extract the sputum cell regions from the background regions that include non sputum cells, our objective is to well extract the sputum cells, the nuclei and cytoplasm to be ready for the segmentation process where we want to partition these cells into regions, these regions later will be diagnose to see if it’s a normal cells or a cancerous cells. In this paper we proved that the HNN is better than FCM clustering algorithm in segmenting the sputum cells for lung cancer early diagnosis.The reminder of this paper is organized as follows. In Section 2, Thresholding Technique is presented. In Section 3, Hopfield Neural Network segmentation algorithm is described. In Section 4, fuzzy clustering algorithm is proposed. In Section 5, the analysis phase is discussed. Finally in Section 6, the conclusion and future work are given.
2. Thresholding Technique
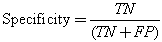
The nature of sputum color images, which contain many debris cells and the relative contrast among the cytoplasm and nuclei cells, makes the segmentation process less accurate, thus the extraction process for the nuclei and cytoplasm cells is very difficult. Furthermore, the diagnostic procedures are based on the measurements of nuclear features. For this reason, a filtering algorithm is used as a pre-processing step which will help to make a crisp segmentation of sputum color images. The filtering algorithm depends on the staining methods by which the image is organized and it is derived from the difference in the brightness level in RGB components of the sputum color images and it is based on the red major component in the image. It should be noted that the red color is the most dominant color between the sputum cells and the background. In this study we improved the filtering algorithm which was used in[10] and we determined the best rang of Θ that can be used.The filtering algorithm uses the appropriate range of the threshold parameter Θ which will allow an accurate extraction of the region of interest (ROI) composed of the nuclei and cytoplasm pixels.The filtering threshold algorithm for the first type of the blue image is the following:If (B(x,y) < G(x,y) + Θ ) then (B(x,y) is sputum else B (x,y) is non sputum (1)Figures 1 (a), shows the results of applying equation 1. For the second type of the image another filter algorithm was applied to extract the sputum cells and remove non sputum cells. To remove the debris cells the following rule was used:If (B(x,y) < G(x,y) or (B(x,y) >R(x,y)) then B(x,y)=0) (2)To extract the sputum cells, the debris must be removed from the Red and Green intensity images using the results of the first step. After that the following rule will be used:If (R(x,y) < (G(x,y) +Θ)) then R(x,y) is sputum else R(x,y) is non sputum (3)The nuclei of the sputum cells are extracted by the following rule:If ((2*G(x,y) +Θ) < (R(x,y) + B(x,y))), then G(x,y) is sputum else G(x,y) is non sputum (4)Figure 1 (b), shows the results of applying equations 2, 3 and 4 respectively. As shown in Figure 1, from left to right, the raw images, the results with the wrong threshold value, where the nuclei and cytoplasm are not detected correctly, as indicated by some parts in the background, which have been considered as part of the cells, this is due to the erroneous value of the threshold and a lot of debris cells are detected, the last images in the right show the correct results corresponding to the appropriate threshold value, where the nuclei and cytoplasm are detected and extracted correctly without debris cells. The images contain only three regions the nuclei, cytoplasm and the background. This example illustrates the serious impact of the threshold selection in the filtering stage. An erroneous threshold might impact negatively on the subsequent decision. This might result in increasing the false negative rate, which will lead to a critical consequence. Therefore, estimating the appropriate filtering threshold is very critical in the diagnostic process.The parameter Θ is determined by trial and error testing whereby the outcome of the segmentation is assessed visually. The values were found to be in the range from -35 to -15. For example, if we increase the value of the threshold Θ the segmentation becomes more selective and there is less pixels classified as a part of sputum. The positive effect is that less non sputum pixels are classified as sputum pixels. However, some pixels that are actually part of sputum are discarded.Figure. 2, represents the ROC-curve of the RGB space for the thresholding algorithm, the ROC curve is the parametric curve (FalseDetectionRate(Θ), CorrectDetectionRate(Θ)) where Θ is the classifier parameter. Here we can see how the extraction performance varies for different thresholds. The dots in the lower left correspond to small Θ (starting from -35 and getting up to -15 in the upper right). Moreover, from this curve we can suggest an optimal value for Θ around -25.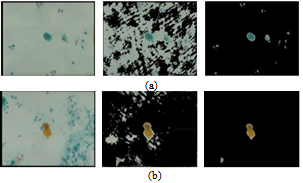 | Figure 1. Examples of threshold based segmentation using equation 1,2, 3 and 4. (a) Image stain with blue dye, (b) image stain with red dye. From left to right, raw images, the results with wrong threshold value, the results with an appropriate threshold value, respectively. |
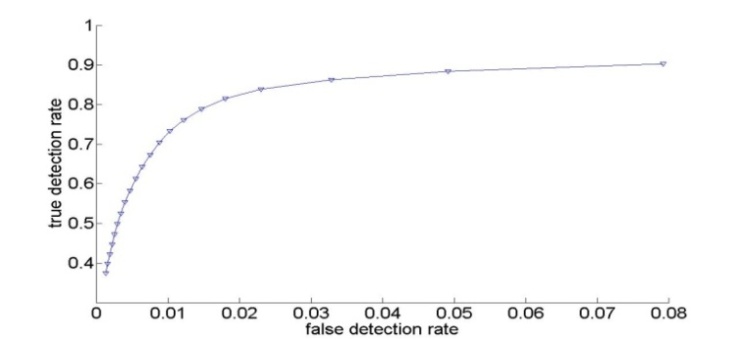 | Figure 2. ROC curve of RGB space for the thresholding algorithm |
We conducted a comprehensive set of experiments to analyze the effect of the proposed algorithm in segmenting the cells into sputum cells and background cells. As both the nucleus and the cytoplasm are both stained in red and blue and differ mostly in their pixel intensities, and for sake of reducing the computing complexity we converted the sputum cell pixels to gray-level. In addition to that, for each image a ground-truth data was obtained manually by selecting the regions of interest by masking the location of the corresponding pixels in binary images. Therefore, the ground-truth data is a binary image where one and zero corresponds to the ROI pixels and to the background pixels, respectively. Thus, the sputum image will be segmented into sputum pixels and background pixels. Then for testing, the threshold classifier was applied on the test images. Each image outcome was compared to the ground truth data and the threshold classifier shows good results where the nuclei and cytoplasm are extracted completely.Figure 3 (a), shows the example of the images stained with blue dye, and Figure 3 (b), shows the example of the images stained with red dye. From left to right, the raw images, the ground truth images which contain the nuclei and cytoplasm, the output image from the threshold classifier algorithm. As can be seen there is no overlapping between the background’s pixel and the ROI’s pixel, the ROI are extracted successfully. Furthermore, the filtered images are very close to the ground truth images.The ground-truth images are used in the comparison process to evaluate the filtered images to see if they have correctly detected the ROI. The thresholding is assessed by finding the intersection (correctly detected pixels) between the ROI in both the ground truth image and the filtered image. The correctly detected pixels then will be obtained while the remaining pixels will represent the wrongly detected pixels.The extraction performance was assessed in terms of sensitivity, specificity and accuracy. For performance measurement we first computed the true positives (i.e. pixels that were correctly classified as sputum pixels TP's), false positives (i.e. pixels that were mistakenly classified as sputum pixels FP's), true negatives (i.e. pixels that were correctly classified as non sputum pixels TN's), and false negatives (i.e. pixels that were mistakenly classified as non sputum pixels FN's).Further measurements are based on these values[11]: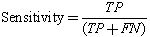
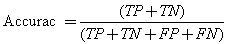 The sensitivity reflects the extent to which pixels classified as sputum pixels are actually sputum pixels. Specificity measures how good the background is classified and the accuracy evaluates the overall correctly classified pixels. We found that this algorithm achieves a best accuracy of 98% for Θ = -25. Figure 4, shows the performance measurements for the thresholding classifier.
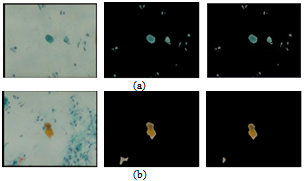 | Figure 3. Example of ground truth data with raw images and filtering results. From left to right, raw images, ground truth data, results of applying thresholding classifier. |
Table 1, summarizes the performances of the filtering method which was applied on 1000 sputum color images. We can see that, the results from the threshold filtering classifier are accurate and reliable in all cases. The sensitivity is 83 and it shows the number of true positive, which means the true sputum cells that are classified as sputum cells, on the other hand, the specificity and accuracy are quite similar.To demonstrate the results quantitatively, we computed the waveforms for visualization of the performance as shown in Figure 5, the sensitivity, specificity and accuracy.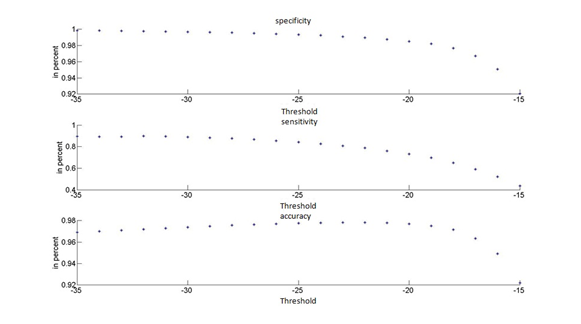 | Figure 4. Performance measurements of the thresholding classifier |
| Table 1. Performance Measurement of the thresholding classifier |
| | PerformanceMeasurement | Proposed Filtering algorithm | | Sensitivity | 83% | | Specificity | 99% | | Accuracy | 98% |
|
|
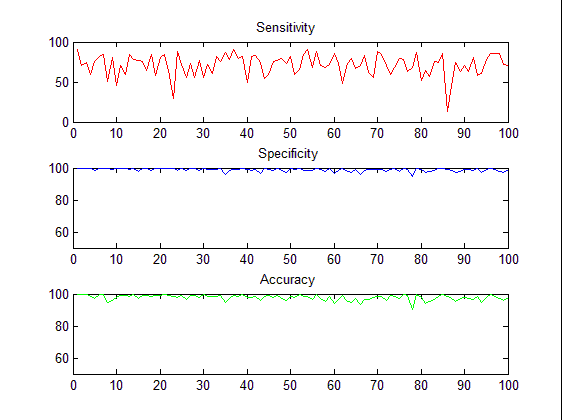 | Figure 5. The waveforms of the threshold classifier during the extracting process, the sensitivity, specificity and accuracy. |
3. Hopfield Neural Network
Hopfield Neural Network (HNN) is one of the artificial neural networks, which has been proposed for segmenting both gray-level and color images. In[12], the authors present the segmentation problem for gray-level images as minimizing a suitable energy function with HNN, it derived the network architecture from the energy function, and classify the sputum cells into nuclei, cytoplasm and background classes, where the input was the RGB component of the used images. In our work we used the HNN algorithm as our segmentation method. The HNN is very sensitive to intensity variation and it can detect the overlapping cytoplasm classes. HNN is considered as unsupervised learning. Therefore, the network classifies the feature space without teacher based on the compactness of each cluster calculated using the Euclidean distance measure between the kth pixel and the centroid of class l. The neural network structure consists of a grid of N x M neurons with each column representing a cluster and each row representing a pixel. The network is designed to classify the image of N pixels of P features among M classes, such that the assignment of the pixels minimizes the criterion function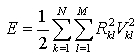 | (5) |
Where Rkl is considered as the Euclidean distance measure between the kth pixel and the centroid of class l, Vkl is the output of the kth neurons. The minimization is achieved using HNN and by solving the motion equations satisfying: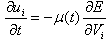 | (6) |
Where u(t) is as defined in[12] a scalar positive function of time used to increase the convergence speed of the HNN. By applying the relation (6) to equation (5), we get a set of neural dynamics given by: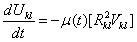 | (7) |
where Ukl and Vkl are the input and output of the kth neuron respectively. To assign a label m to the kth pixel we use the input-output function given by: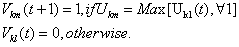 | (8) |
The HNN segmentation algorithm can be summarized in the following steps:1. Initialize the input of neurons to random values. 2. Apply the input-output relation given in (8) to obtain the new output value for each neuron, establishing the assignment of pixel to classes.3. Compute the centroid for each class as follow: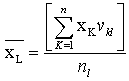 | (9) |
Where nl is the number of pixels in class l.1. Solve the set of differential equation in (7) to update the input of each neuron: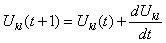 | (10) |
2. Repeat from step 2 until convergence then terminate.We applied the HNN with the specification mentioned above to 1000 sputum color images and maintained the results for further processing in the following steps. Our algorithm could segment 97% of the images successfully in nuclei, cytoplasm regions and clear background. Furthermore, HNN took short time to achieve the desired results. By experiment, HNN needed less than 120 iterations to reach the desired segmentation result in 36 seconds.
4. Fuzzy Clustering
Clustering is the process of dividing the data into homogenous regions based on the similarity of objects; information that is logically similar physically is stored together, in order to increase the efficiency in the database system and to minimize the number of disk access[13]. The process of clustering is to assign the q feature vectors into K clusters, for each kth cluster Ck is its center. Fuzzy Clustering has been used in many fields like pattern recognition and Fuzzy identification. A variety of Fuzzy clustering methods have been proposed and most of them are based upon distance criteria[14]. The most widely used algorithm is the Fuzzy C-Mean algorithm (FCM), it uses reciprocal distance to compute fuzzy weights. This algorithm has as input a predefined number of clusters, which is the k from its name. Means stands for an average location of all the members of particular cluster and the output is a partitioning of k cluster on a set of objects. The objective of the FCM cluster is to minimize the total weighted mean square error[15]: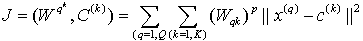 | (11) |
The FCM allows each feature vector to belong to multiple clusters with various fuzzy membership values. Then the final classification will be according to the maximum weight of the feature vector over all clusters. The detailed algorithm[15]:Input: Vectors of objects, each object represent s dimensions, where v = {v1,v2,……,vn} in our case will be an image pixels, each pixel has three dimensions RGB, K = number of clusters. Output = a set of K clusters which minimize the sum of distance error.1. Initialize random weight for each pixel, it uses fuzz weighting with positive weights {Wqk } between[0, 1]. 2. Standardize the initial weights for each qth feature vector over all K clusters via: | (12) |
3. Standardize the weights over k = 1,…,K for each q to obtain Wqk, via: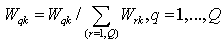 | (13) |
4. Compute new centroids C(k), k = 1,….,K via | (14) |
5. Update the weights { Wqk, } via | (15) |
6. If there is change in the input, repeat from step 3, else terminate.7. Assign each pixel to a cluster based on the maximum weight.We applied the FCM clustering algorithm with the specification mentioned above to 1000 sputum color images and maintain the results for further processing in the following steps. Our algorithm could segment the images into nuclei, cytoplasm regions and clear background, however, the FCM is not sensitive to intensity variation, therefore, the cytoplasm regions are detected as one cluster when we fixed the cluster number to three, four, five and six. Moreover, FCM failed in detecting the nuclei, it detected only part of it. By experiment, the FCM algorithm takes less than 50 iterations to reach the desired results in 10 seconds on average.
5. Analysis Phase
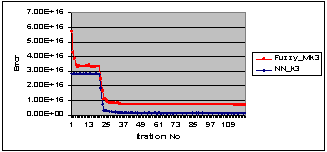
In this section, we presented the results obtained with two sample images, the first sample containing red cells surrounded by a lot of debris nuclei and a background reflecting a large number of intensity variation in its pixel values as shown in Figure 6 (a), and the second sample is composed of blue stained cells as shown in Figure 8 (a). The results of applying the HNN and FCM algorithms to the raw image in Figure 6 (a) are shown in Figure 6 (b) and Figure 6 (c), respectively. As can be seen in the segmentation results for both algorithms in Figure 6 (b) and Figure 6 (c), the nuclei of the cells were not detected, as in the case of HNN in Figure 6 (b), and were not accurately represented by using FCM as in Figure 6 (c). For this reason we used the output image from the thresholding classifier (which was described in section 2) to be the input for HNN and FCM algorithms to extract the ROI. Figure 6 (d) shows the output image of the thresholding classifier. The results after applying the HNN and FCM on the image of Figure 6 (d) are shown in Figure 6 (e) and Figure 6 (f). By fixing the cluster number to three, respectively, we realized that in the case of HNN, the nuclei were detected but not precisely. In the case of FCM only part of the nuclei has been detected, we increased the cluster number to four as an attempt to solve the nuclei detection problem. The results are shown in Figure 6 (g) and Figure 6 (h) for both HNN and FCM, respectively. Comparing the HNN segmentation result in Figure 6 (g) to the raw image in Figure 6 (d), we can see that the nuclei regions were detected perfectly, and also their corresponding cytoplasm regions. However, due to the problem of intensity variation in the image in Figure 6 (d) and also due to the sensitivity of HNN, the cytoplasm regions were represented by two clusters. These cytoplasm clusters will be merged later if the difference in their mean values is not large. On the other hand, comparing the FCM segmentation result in Figure 6 (h) to the image in Figure 6 (d), we can see that the nuclei regions are detected, but they present a little overlapping in the way that the two different nuclei may be seen or considered as one nucleus, and this can affect the diagnosis results. The cytoplasm regions are smoother than in the case of HNN, reflecting that the FCM is less sensitive to the intensity variation than HNN. The learning error waveforms of the above comparison and discussion are shown in Figure 7. As can be seen the segmentation error at convergence is smaller with HNN than with the FCM. 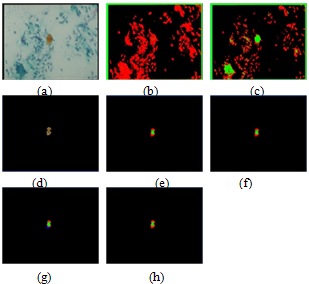 | Figure 6. Example of HNN and FCM segmentation algorithm for red dyes image (a) Original raw image, (b) and (c) the segmentation results for the raw image in (a) by using HNN and FCM, respectively. (d) The filtered image. (e) And (f) show the segmentation results for the filtered image in (d) by using HNN and FCM, and by fixing the cluster number to three, respectively. (g) And (h) the results by fixing the cluster number to four, respectively. |
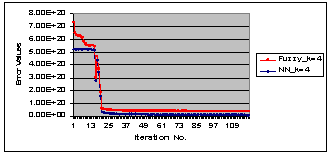 | Figure 7. The learning error waveforms of HNN and FCM during the segmentation process, for the red cells raw image in Figure 6. |
Figure 8 (a) shows a sample of sputum color image stained with blue dyes, Figure 8 (b) and Figure 8 (c) show the segmentation results using HNN and the FCM for the raw image in Figure 8 (a), respectively. As can be seen from the segmentation results the nuclei have not been detected and the background presents a lot of intensity variation. For these reasons we used the output image from the threshold classifier as shown in Figure 8 (d) to be the input to the HNN and FCM respectively, and the results are shown in Figure 8 (e) and Figure 8 (f) with cluster number equal to three. As can be seen the nuclei have been well detected in the case of HNN. Figure 8 (g) and Figure 8 (h), show the HNN and FCM segmentation results with cluster number equal to four, however, a color cluster is missing in the result of FCM as shown in Figure 8 (h). Figure 9, shows quantitatively, the learning error waveforms of HNN and FCM during the segmentation process of the blue sample in Figure 8. Figure 6 and Figure 8, illustrate that the HNN is significantly outperforms the FCM clustering algorithm in segmenting the sputum color image for lung cancer early diagnosis. Thus, the HNN has the ability to segment the nuclei and cytoplasm into accurate regions without overlapping between the nuclei and cytoplasm, where the FCM failed to solve the problem of overlapping between the nuclei and cytoplasm. Moreover, we used Figure 7 and Figure 9 to prove that the HNN is better than FCM in sputum cell segmentation and it can be used in the process of lung cancer early diagnosis. 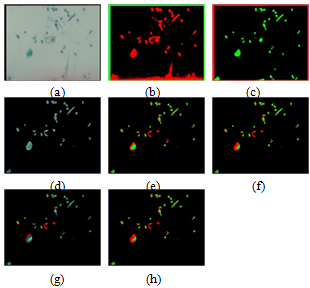 | Figure 8. Example of HNN and FCM segmentation algorithm for blue dye image (a) Original raw image (b) and (c) the segmentation results for the image in (a) by using HNN and FCM, respectively. (d) The filtered image. (e) And (f) show the segmentation results for the filtered image in (d) by using HNN and FCM, and by fixing the cluster number to three, respectively. (g) And (h) the results by fixing the cluster number to four, respectively. |
 | Figure 9. The learning error waveforms of HNN and FCM during the segmentation process, for the blue cells image in Figure 8. |
6. Conclusions
In this study, two segmentation processes have been used, the first one was Hopfield Neural Network (HNN), and the second one was Fuzzy C-Mean (FCM) Clustering algorithm. It was found that the HNN segmentation results are more accurate and reliable than FCM clustering in all cases. The HNN succeeded in detecting and segmenting the nuclei and cytoplasm regions. However FCM failed in detecting the nuclei, instead it detected only part of it. In addition to that, the FCM is not sensitive to intensity variations as the segmentation error at convergence is larger with FCM compared to that with HNN.However, due to the extreme variation in the gray level and the relative contrast among the images which makes the segmentation results less accurate, we applied a rule based thresholding classifier as a pre-processing step. The thresholding classifier is succeeded in solving the problem of intensity variation and in detecting the nuclei and cytoplasm regions, it has the ability to mask all the debris cells and to determine the best rang of threshold values. Overall, the thresholding classifier has achieved a good accuracy of 98% with high value of sensitivity and specificity of 83% and 99% respectively.The HNN will be used as a basis for a Computer Aided Diagnosis (CAD) system for early detection of lung cancer. In the future, we plan to consider a Bayesian decision theory for the detection of the lung cancer cells, followed by developing a model based on the idea of mean shift algorithm which combined the idea of edge detection and region based approach to extract the homogeneous tissues represented in the image.
References
| [1] | Dignam JJ, Huang L, Ries L, Reichman M, Mariotto A, Feuer E. “Estimating cancer statistic and other-cause mortality in clinical trial and population-based cancer registry cohorts”, Cancer 10, Aug 2009. |
| [2] | W. Wang and S. Wu, “A Study on Lung Cancer Detection by Image Processing”, proceeding of the IEEE conference on Communications, Circuits and Systems, pp. 371-374, 2006. |
| [3] | A. Sheila and T. Ried “Interphase Cytogenetics of Sputum Cells for the Early Detection of Lung Carcinogenesis”, Journal of Cancer Prevention Research, vol. 3, no. 4, pp. 416-419, March, 2010. |
| [4] | D. Kim, C. Chung and K. Barnard, "Relevance Feedback using Adaptive Clustering for Image Similarity Retrieval," Journal of Systems and Software, vol. 78, pp. 9-23, Oct. 2005. |
| [5] | S. Saleh, N. Kalyankar, and S. Khamitkar,” Image Segmentation by using Edge Detection”, International Journal on Computer Science and Engineering(IJCSE), vol. 2, no. 3, pp. 804-807, 2010. |
| [6] | L. Lucchese and S. K. Mitra, “Color Image Segmentation: A State of the Art Survey,” Proceeding of the Indian National Science Academy (INSA-A), New Delhi, India, vol. 67, no. 2, pp. 207-221, 2001. |
| [7] | F. Taher and R. Sammouda,” Identification of Lung Cancer based on shape and Color”, Proceeding of the 4th International Conference on Innovation in Information Technology, pp.481-485, Dubai, UAE, Nov. 2007. |
| [8] | M. G. Forero, F. Sroubek and G. Cristobal, “Identification of Tuberculosis Based on Shape and Color,” Journal of Real time imaging, vol. 10, pp. 251-262, 2004. |
| [9] | Y. HIROO,” Usefulness of Papanicolaou stain by rehydration of airdried smears ”, Journal of the Japanese Society of Clinical Cytology, vol. 34, pp. 107-110, Japan, 2003. |
| [10] | R. Sammouda, N. Niki, H. Nishitani, S. Nakamura, and S. Mori, “Segmentation of Sputum Color Image for Lung Cancer Diagnosis based on Neural Network,” IEICE Transactions on Information and Systems. vol. 8, pp. 862-870, August, 1998. |
| [11] | Margaret H. Dunham,” Data Mining Introductory and Advanced Topics”, Prentice Hall 1st edition, 2003. |
| [12] | F.Taher and R. Sammouda, “Lung Cancer Detection based on the Analysis of Sputum Color Images”, Proceeding in the International Conference on Image Processing, Computer Vision, & Pattern Recognition (IPCV'10:WORLDCOMP 2010), pp. 168-173, Las Vegas, USA, 12-15 July, 2010. |
| [13] | R. Duda, P. Hart, ”Pattern Classification”, Wiley-Interscience 2nd edition, October 2001. |
| [14] | S. Aravind, J. Ramesh, P. Vanathi and K. Gunavathi,” Roubust and Atomated lung Nodule Diagnosis from CT Images based on fuzzy Systems”, processing in International Conference on Process Automation, Control and Computing (PACC), pp. 1-6, Coimbatore, India, July, 2011. |
| [15] | H. Sun, S. Wang and Q. Jiang, "Fuzzy C-Mean based Model Selection Algorithms for Determining the Number of Clusters," Pattern Recognition, vol. 37, pp.2027-2037, 2004. |
 Abstract
 Reference
 Full-Text PDF
 Full-Text HTML