Fatma El-Zahraa Labib1, Islam Fouad2, Mai Mabrouk3, Amr Sharawy1
1Biomedical Engineering, Cairo University, Giza, Egypt
2College of Applied Medical Sciences, SALMAN Bin ABDUL-AZIZ University, Kharj, KSA
3Biomedical Engineering, MUST University, 6th of October, Egypt
Correspondence to: Mai Mabrouk, Biomedical Engineering, MUST University, 6th of October, Egypt.
| Email: |  |
Copyright © 2012 Scientific & Academic Publishing. All Rights Reserved.
Abstract
DNA microarray is a powerful tool and is widely used in genetics to monitor expression levels of thousands of genes in parallel. The gene expression process consists of three stages: gridding, segmentation and quantification. Gridding deals with finding areas in the microarray image which contain one spot using grid lines. This step can be done manually or automatically. In this paper, we propose an efficient and simple automatic gridding method for microarray image analysis. This method was implemented using MATLAB software and found very effective for gridding arrays with low intensity, poor quality spotsand tested by a number of microarray images. Results show that this method gives high accuracy of 76.9% improved to 98.6% when a preprocessing step is considered, rendering the method a promising technique for an efficient and automatic gridding the noisy microarray images.
Keywords:
Microarray,Gene Expression, Gridding,Spot,Image Analysis
1. Introduction
A DNA microarray is a powerful tool and is widely used in many research areas. For biologists, genetic research, understanding and diagnosis of cancer and many other dangerous diseases, as well as discovering treatments of diseases, are among the most interesting areas where DNA microarray analysis may be extremely helpful[1]. Traditional methods in molecular biology generally work on one gene on a one-experiment basis, which means that the throughput is very limited and biologists can only be able to do such genetic analysis on a few genes at a time. Microarray technology makes it possible to measure the expression level of thousands of genes in a biological sample rapidly and efficiently on the slides[2].A DNA microarray consists of a solid surface, onto which DNA molecules have been chemically bounded. The purpose of a microarray is to detect the presence and abundance of labelled nucleic acids in a biological sample, which will hybridize to the DNA on the array, and which can be detected via the label. In the majority of microarray experiments, the labelled nucleic acids are derived from the mRNA of a sample or tissue. Typically, control and test RNA samples are processed on the same array using two different dye tagged probes (e.g., the red fluorescent dyeCy5 and green fluorescent dye Cy3)[2-4], and so the microarray measures gene expression.The next step is to produce an image, where the microar-ray is scanned by laser. By comparing the gene expression level in normal and diseased cells, it is found that this tool is really useful to identify diseased genes leading to accurate production of a therapeutic drug for that disease[5]. This gene expression process consists of three steps:1) Gridding:This step seeks to find areas in the image which contain one spot using grid lines, i.e. to assign each spot to an individual compartment.2) Segmentation:This step seeks to classify each compartment in the image into a foreground (spot) and a background area.3) Quantification:This step seeks to calculate the intensity value of each spot.Gridding is the most fundamental and important step in the whole process of gene expression. There are various levels of image processing algorithms, which require a certain level of user intervention for accurately gridding the microarray images. Grid alignment techniques can be viewed in terms of automation as manual, semiautomatic, and fully automated[6].Major work has been presented in microarray image analysis. Roberto Hirata JR et al.[12] introduces a technique using morphological operators to perform automatic gridding procedures for sub grids and spots. Buhler et al.[13] describes a semi-automatic system which mainly focuses on the problem of finding individual spot with high accuracy. Jain et al.[14] describes a system for microarray gridding and quantitative analysis that imposes different kinds of restrictions on the print layout. This method requires the rows and columns of all grids to be strictly aligned.In manual grid alignment methods the user specifies the dimensions of a grid template and the radius of each spot to form the template. The advantage of this method is that one could possibly obtain ‘perfect’ grid alignment by providing human computer interface software tools that are built for adjusting shape and location of each spot individually. However, this approach is very time consuming and tedious[16].The semiautomatic grid alignment approach can perform grid alignment by means of a computer and also allows the user to intervene in order to achieve correctness of gridding results. The benefits of the semiautomatic grid alignment method include reduction of human labour and time. Nevertheless these methods might not suffice to meet requirements of high throughput of microarray image processing[16].The approach of fully automated grid alignment should reliably identify all spots without any human intervention based on a one-time human setup. In most cases, the challenge of designing fully automated gridding systems is to identify all parameters that represent prior knowledge and quantify constraints for those parameters. Typically these systems are data-driven[12, 15].An ideal image should only reflect measures of the fluorescence intensities for the dye of interest[4], where, the size and shape of the spots are perfectly circular and it is the same for all the spots, the location of the grid is fixed in images for a given type of slides, no dust or contamination is on the slide, and there is minimal and uniform background intensity across the image.However, in the real world, almost no real microarray image meets all the above criteria. In fact, there are frequently observed variations on the spot position, irregularities on the spot shape and size, contamination such as undesired signals like photon noise, electronic noise, background fluorescence and global problem that affect spots. For detailed noise factor analysis, refer to Yoganand et al[17]. This makes image processing more challenging. Many algorithms and a lot of software exist for processing and analyzing microarray images.This paper presents a fully automatic gridding method preceded by performing a noise removal step to overcome the effect of noise on the microarray image before starting the gridding process. The results are verified using a number of microarray images and are planned to produce a high accuracy.
2. Material and Methods
The used microarray images are downloaded from the Stanford Microarray database (SMD)[10], which stores raw and normalized data from microarray experiments, and provides web interfaces for researchers to retrieve, analyze and visualize their data[11].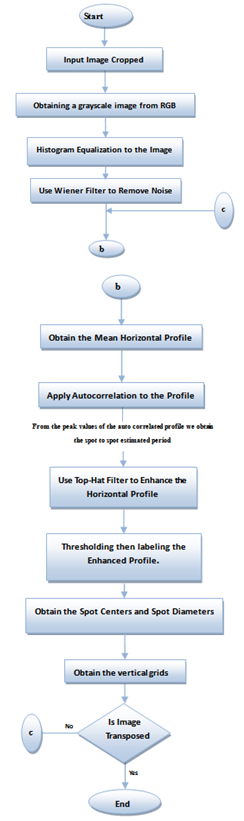 | Figure 1. Flowchart of the Proposed Method of Gridding Microarray Spots |
The computing platform was an Intel(R) Core (TM) i5 – 2.27G.Hz processor. We used Matlab version 7.11.0.584 (R2010b) and its powerful “Image Processing Toolbox” for data analysis and image processing[7].Most of the microarray images consist of low-intensity features that are not well distinguishable from the background, these problems lead to errors that propagate to all stages of statistical analysis. So, we suggested a pre-processing step to the microarray image to overcome those problems.Finally, we presented the effect of the proposed gridding method before and after pre-processingon the results. Our method starts by cropping a chosen microarray sub-image then converting it to grayscale. Then, we proposed the pre-processing step by applying histogram equalization, to obtain high contrast between the foreground (spots) and the background. But due to the high background noise, we resorted to Wiener filtering to eliminate that noise[7-9].After that, we computed the mean horizontal profile MH(y) of the image f (x, y) (dimensions X and Y, pixel x = (x, y)), where,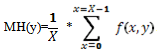 | (1) |
Then followed by autocorrelatingthat profile in order to enhance it. From the peak values of the auto correlated profile, we obtain the spot to spot estimated interval. The next step in the enhancement of the mean horizontal profile was to use a top-hat filter with a morphological flat, linear structuring element of length equal to the obtained estimated interval. The top-hat filter is defined as the difference between an image and its opened version. It enhances thedetails that would otherwise be hidden in low contrast regions[8].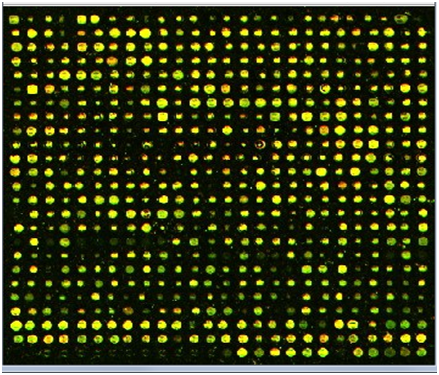 | Figure 2. Color cropped microarray image |
Next, we applied thresholding then labelling to the enhanced horizontal profile. Then we measured a set of parameters for each labelled region, so as to obtain the centres of the peaks which correspond to the spot centres. Thus, we could get the estimated spot centres and diameters. These parameters were used to determine the locations of the vertical grids and draw them on the image. Finally, we transposed the image for only one time to get the horizontal grids on the image, that’s by repeating the steps starting from the computation of the mean vertical profile and ending with drawing the horizontal grids on the image.The flowchart of our proposed microarray spot gridding algorithm is shown in Figure 1.
3. Results and Discussion
A sample cropped microarray image in colour format with 676 spots and its grayscale equivalent is shown in Figure 2, and Figure 3. The results of the detailed steps of the proposed method are shown in Figure 4, Figure 5, Figure 6, Figure 7, Figure 8, and Figure 9, while the effect of applying the preprocessing step on that method is shown in Figure 10 and Figure 11. The algorithm was tested using a number of microarray images available on Stanford Microarray Database (SMD), and it gave high accuracy results.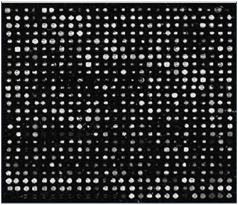 | Figure 3. Gray scale cropped microarray image |
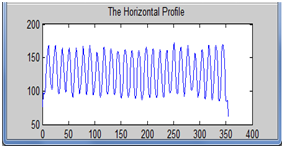 | Figure 4. Mean horizontal profile |
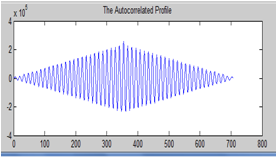 | Figure 5. Auto correlated horizontal profile |
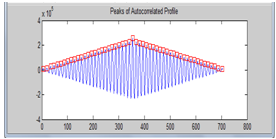 | Figure 6. Peaks of the auto correlated horizontal profile |
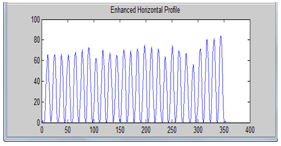 | Figure 7. Enhanced horizontal profile. |
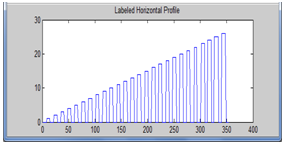 | Figure 8. Labeled horizontal profile |
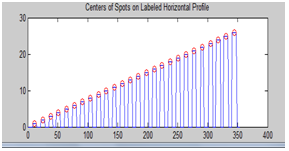 | Figure 9. Centers of spots on labeled horizontal profile |
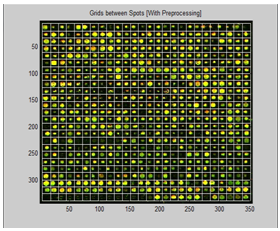 | Figure 10. Resulted image after preprocessing |
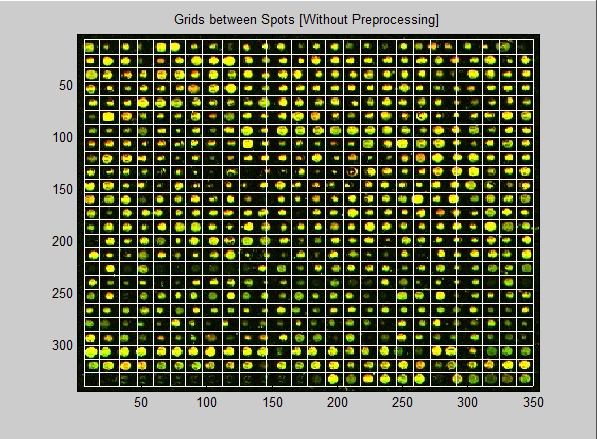 | Figure 11. Resulted image without preprocessing |
The accuracy[11] of this gridding method on a specified input image, having n total spots, can be calculated as follows: | (2) |
Where, A is the gridding accuracy, ncorrect spots and ntotal spots indicates the number of spots correctly gridded and the total number of spots in the image respectively.The comparison of the applied gridding algorithm with and without passing the preprocessing step first is shown in table (1).| Table 1. Accuracy Results |
| | Gridding Accuracy % | | Applying Preprocessing | Without Applying Preprocessing | | 98.6 % | 76.9 % |
|
|
From the above table, it is obvious that the proposed method gives high accuracy result, when applying the pre-processing step first. Also, the bad results of skipping the pre-processing step are clear as the accuracy falls down and this reflects the effectiveness of the pre-processing on the microarray spot gridding process.
4. Conclusions
Microarrays provide biologists with the possibility to monitor thousands of genomic sequences (e.g. genes) simultaneously. All of these collected data are measured by means of image analysis. For that reason, image analysis is an important phase of microarray data analysis. It is necessary to decrease human intervention as much as possible, in a way to disable complete repetition of the analysis, because either the processing of biological samples of some kind is very expensive or because these samples rarely exist. In this work, we applied a fully automated statistically based gridding method to noisy microarray image. To enhance the microarray noisy images we proposed a pre-processing noise removal technique, and the results obviously reflected the impact of pre-processing the microarray image before gridding its spots, where it’s shown that this method gave high accuracy.Finally, Microarray image analysis is a very interesting research area and so our future work intended to pursue the research about developing a new method of extracting the foreground (spot) from the background, enhancing the microarray image, and computing the intensity value for each spot.
References
| [1] | A.Baxevanis, B. F. Ouellette, “A Practical Guide to Analysis of Genes and Proteins”, 2nd ed., Wiley, New York. 2001. |
| [2] | DovStekel,“MicroarrayBioinformatics”,Cambridge University Press, New York, 2003. |
| [3] | Sorin, Draghici, “Data analysis tool for DNA Microarrays”, Chapman& Hall/CRC, Mathematical biology and medicine series, London New York, 2003. |
| [4] | Stefano Lonardi and Yu luo “Gridding and compression of microarray images”, Proceedings of IEEE Computational systems Bioinformatics conferences (CSB), 0-7695-2194-0/04, 2004. |
| [5] | Alan wee-Chung Liew, Hong Yan, Mengsu Yang, “Robust adaptive spot segmentation of DNAmicroarray images”, Pattern recognition 36, 1251-1254,2003. |
| [6] | Bozinov Daniel, RahnenfuhrerJorg, “Unsupervised Technique for Robust Target Separation andAnalysis of DNA Microarray Spots Through Adaptive Pixel Clustering”, Bioinformatics.Vol. 18, no. 5, Page(s): 747 – 756. , Oxford University Press. , 2002. |
| [7] | Matlab (R2010b) Image Processing Toolbox, Signal Processing Toolbox. |
| [8] | Rafael C. Gonzalez and Richard E.Woods, “Digital Image processing”, Second Edition. Chapter 9, Page(s): 557– 558, Prentice Hall, 2002. |
| [9] | AcharyaTinku, Ray AjoyK.,“Image Processing Principles and Applications”, Chapter 6, John Wiley & Sons Inc., 2005. |
| [10] | Internet, http://smd.stanford.edu. |
| [11] | Deepa J, and Tessamma Thomas, “Automatic Gridding of DNA Microarray Images using Optimum Sub image”, International Journal of Recent Trends in Engineering, Vol. 1, No. 4, May 2009. |
| [12] | Hirata Jr. Roberto, et al, “Microarray Gridding by Mathematical Morphology”, Proceeding of the XIV BrazilianSymposium on Computer Graphics and Image Processing , 2001. |
| [13] | J.Buhler, T.Ideker and D.Haynor, “Dapple:Improved Techniques for Finding Spots on DNAMicroarrays”,Technical Report UWTR 2000-08-05, University of Washington, 2000. |
| [14] | A.Jain, T.Tokuyasu, A.Snijderts, R.Segraves, D.Albertson and D.Pinkel, “Fully Automatic Quantification of Microarray Image Data”, Genome Res.,12(2):325 - 332, 2003. |
| [15] | Guiliano Antonio and Michele Ceccarelli,“A Markov Radom Field Approach toMicroarray Image Gridding”, Pattern Recognition, 2004. ICPR 2004.Proceedingsof the 17th International Conference on Volume 3, Issue, Page(s): 550 - 553 Vol.3, 23-26 Aug. 2004. |
| [16] | Peter Bajcsy, “An overview of DNA Microarray Grid Alignment and Foreground Separation Approaches”, EURASIP journal on Applied SignalProcessing,Article ID 80163, Pages 1-13, Volume 2006. |
| [17] | YoganandBalagurunathan, Naisyin Wang, Edward R. Fougherty, Danh Nguyen, Yidong Chen,Michael L.Bittner, Jeffrey Trent and Raymond Carrol, “Noise factor analysis for cDNA microarrays,” Journal of Biomedical Optics,9, 663, doi:10.1117/1.1755232, 2004. |
 Abstract
 Reference
 Full-Text PDF
 Full-Text HTML