Mahdieh Ghasemi 1, Ali Mahloojifar 1, Mojtaba Zarei 2
1Electrical and Computer Engineering (ECE) Department, Tarbiat Modares University, Tehran, Iran
2FMRIB Centre, John Radcliffe Hospital, Oxford OX3 9DU, UK & Imperial College London, Department of Clinical Neuroscience, London, UK
Correspondence to: Ali Mahloojifar , Electrical and Computer Engineering (ECE) Department, Tarbiat Modares University, Tehran, Iran.
| Email: |  |
Copyright © 2012 Scientific & Academic Publishing. All Rights Reserved.
Abstract
Parkinson’s disease (PD) is a progressive neurological disorder characterized by tremor, rigidity, and slowness of movements. Determining changes of spontaneous activity and connectivity of the brain is a critical step towards treatment of PD patients. Resting State functional Magnetic Resonance Imaging (RS-fMRI) is a non-invasive method that we use in this work to investigate changes of default mode network of the brain in PD. To this end, we apply two methods, Seed Correlation Analysis (SCA) and probabilistic independent Component Analysis (PICA). The results of advanced statistical group analysis on SCA values show that there is negative significant correlation between motor cortex and cerebellum in healthy, while this connection in PD is positive and not significant. This result implies the disturbance of equilibrium function of the brain in resting. Moreover, in both groups, there is significant positive correlation between areas located in basal ganglia. The results show that in healthy, there is not significant correlation between motor areas and basal ganglia, while in PD there are significant negative correlations between motor cortex and cerebellum with areas located in basal ganglia. The comparison of five ICs extracted by PICA showed lower DMN activation in basal ganglia. Finally, The result of our study show that the functional correlations between ROIs are more affected in PD than pattern maps of activity by PICA.
Keywords:
Functional Magnetic Resonance Imaging (fMRI), Medical Imaging, Resting State, Seed Correlation Analysis(SCA), Probabilistic Independent Component Analysis (PICA), Parkinson Disease (PD)
1. Introduction
Parkinson's disease (PD) is a degenerative disorder of the central nervous system that often impairs the sufferer's motor skills, speech, and other functions. Parkinson's disease belongs to a group of conditions called movement disorders. It is characterized by muscle rigidity, tremor, a slowing of physical movement and a loss of physical movement (akinesia) in extreme cases. The primary symptoms are the results of decreased stimulation of the motor cortex by the basal ganglia, normally caused by the insufficient formation and action of dopamine, which is produced specifically the substantia nigra[1]. While diagnosis of PD is essentially based on a set of clinical criteria that only provides accuracy of 82%, imaging markers such as MRI, PET and SPECT may help to improve accuracy of the diagnosis. Some researches consider anatomical and structural changes in T1-weighted and DTI images[2]. In recent years, functional magnetic resonance imaging (fMRI) has been extensively used on PD research for assessment of functional activities and connectivity between areas. While Resting State analysis could reflect brain areas dysfunction more clearly, to date, due to movement defects of PD, most researches were limited in task-related neural activity changes and only few studies have investigated resting state fMRI[3]. Resting-state fMRI may therefore also serve as an indicator for dysfunctions in brain connectivity, possibly allowing for improved detection of pathological changes in the brain. While the resting state is an ill-defined condition, consistent functional patterns across individuals should represent common default state activity. Because this network is typically deactivated during external stimulation, it has been termed the ‘default mode network’. Since most dysfunctions are related to rest conditions, resting state fMRI indentified significant disruptions in DMN co-activation in patient with PD. Hence, attempts have been made to apply resting state fMRI as a non-invasive available of PD. Currently; limited information is available on the influence of PD on DMN co-activation[3-5].An important concern in studying DMNs is whether the method used for their identification is appropriately sensitive. Either correlations of signal time courses between different brain areas using region of interest analyses (ROI)[6] or data-driven extraction of DMN co-activation by independent component analyses was used to determine DMN connectivity from fMRI data. Most studies only focused on one of these methods. Substantially different properties of both approaches, however, raise the question, which approach is more sensitive towards changes in DMN connectivity. Methods based on direct correlations with time-courses of signal change identified from a ‘‘seed’’ voxel are limited to applications to regions for which there is an a priori expectation of a network pattern. Independent component analysis, on the other hand, is likely to be more comprehensive in detecting variation across a well-defined network. Based on these hypotheses, both approaches will most likely show different sensitivity profiles for the detection of small changes of DMN activity. Therefore, in the present study, we aimed (1) to characterize the effects of PD on resting state DMN co-activation as assessed with fMRI by two mentioned methods and (2) to determine which method, ROI-based correlation analysis or data-driven ICA, is more sensitive to effects of PD. This information is a prerequisite to better understand the effects of PD on DMN.
2. Methods
In this research, We have applied Cross Correlation Analysis(CCA) and probabilistic ICA (PICA) to the characterization of DMNs in resting brain BOLD datasets. Before their applications, some preprocessing steps are done. All data are first pre-processed using tools from the FMRIB Software Library (FSL, http://www.fmrib.ox.ac.uk/fsl)[7], applying the following procedures: slice-timing, head motion correction, mean-based intensity normalization of all volumes by the same factor and removing nonbrain tissue using BET also part of FSL. The first four volumes are discarded to remove the initial transient effects. Further preprocessing included, spatial normalization is done in two steps: coregistration to structural images with 7 DOF and then normalization to the MNI (Montreal Neurological Institute) template with 12 DOF using FMRIB's Linear Image Registration Tool (FLIRT). Moreover data is temporally band-pass filtered (0.01–0.08 Hz) to reduce physiological noise. Following the pre-processing, the data are analyzed using the following methods.
2.1. Cross Correlation Analysis
Currently, two major analysis approaches are used for assessing functional correlation in resting-state data: voxel wise and ROI (seed) wise. Seed Correlation Analysis (SCA) is based on calculating cross-correlation coefficients of the time series in two particular seed region-of-interest (ROI). SCA thus requires strong a priori assumptions, as the definition of seeds. The mean time series within this ROI is considered as the reference time course. In our analysis, we remove Cerebro-Spinal Fluid (CSF) pulsation as covariate. The extracted time courses of each subject are then cross-correlated region by region; Pearson's correlation coefficients are calculated: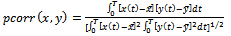 | (2) |
where x and y are the time courses of two regions. For all regions, we have: 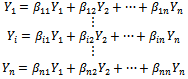 | (3) |
where Yi is the time course of region i, 1<i<n and n is the number of regions. Finally, square correlation matrices are generated (n×n) from these values for each subject. Indi-vidual r-maps are normalized to Z-maps using Fisher’s Z transformation: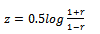 | (4) |
The most effective preprocessing and processing steps in implementation of SCA approach illustrated in Fig. 1[8].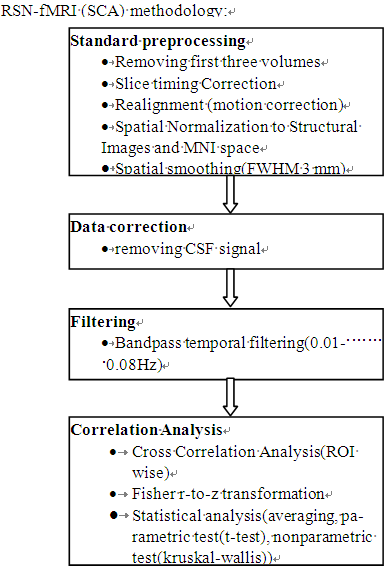 | Figure 1. Recommended resting-state functional connectivity fMRI preprocessing methodology |
Finally, the statistical analyses such as averaging and student t-test are applied for group inference:  | (5) |
 | (6) |
 | (7) |
where X1 and X2 are the samples, µ and S are related to mean and Standard Deviation of samples respectively and n is the number of samples.
2.2. Probabilistic ICA
Independent component analysis (ICA) is becoming a popular exploratory method for analyzing complex data such as that from fMRI experiments. ICA views the 4D data as a sum of a set of spatiotemporal components, each of which consists of a spatial map modulated in time by that component’s associated time course. It attempts to separate the different components by making the assumption that the spatial maps are statistically independent of each other, and, having different time-courses, they will ideally each represent a different artefact or activation pattern. By using the entire 4D dataset at once in this multivariate analysis, this kind of approach does not need to be fed any temporal model. In attempting to find RSNs in fMRI data, it is preferable to use a methodology that does not require the additional experimental sessions, extra analysis steps, and potential bias associated with activation-derived seeding.The application of ‘‘model-free’’ methods such as ICA, however, has previously been restricted both by the view that results can be hard to interpret, and by the lack of ability to quantify statistical significance for estimated spatial maps. Beckmann and Smith[9] proposed a probabilistic ICA (PICA) model for fMRI which models the observations as mixtures of spatially non-Gaussian signals and artefacts in the presence of Gaussian noise. It was demonstrated in the same work that using an objective estimation of the amount of Gaussian noise through Bayesian analysis of the number of activation and (non-Gaussian) noise sources, the problem of overfitting can be overcome. The approach proposed for estimating a suitable model order also allows for a unique decomposition of the data and reduces problems of interpretation.
3. Experimental Results
3.1. Subjects
Ten PD patients and ten age- and sex-matched healthy subjects were recruited. The experiments were undertaken with the understanding and written consent of each subject, with the approval from the local ethics committee, and in compliance with national legislation and the Declaration of Helsinki. Patients were scanned while taking their medication as usual. All patients were assessed clinically and scored according to the Hoehn and Yahr scale.Data were acquired on a 3T Siemens MRI system at John Radcliffe Hospital, Oxford, UK (at the Oxford Centre for Functional Magnetic Imaging of the brain). For each subject, a structural high resolution T1-weighted with flip angle:18o and 91×109×91 matrix size, and 120 volumes resting state functional T2-weighted images with parameters: slice thickness=3mm, resolution=3mm×3mm, TE=30ms, TR=3000ms were acquired.
3.2. Data Analysis
SCA results: Based on the pathophysiology model of Parkinson Disease in[10], eight ROIs in each hemisphere are chosen and investigated in this study. Table 1 shows ROIs with their Abbreviations. Motor cortex have made by the primary motor cortex, Premotor cortex and supplementary motor area. For preparing the mask of ROIs, three following steps are required:● Extracting the ROIs using the FSL atlases.● Splitting ROIs in left and right hemisphere using the fslmaths commands.● Binarization the weighted masks with 50% threshold.After ROI extraction, the averaging time course of each ROI calculates. The extracted signal time courses of each subject are then cross-correlated region by region, Pearson's correlation coefficients are calculated and square correlation matrices are generated (16×16) from these values for each subject. To compare quantitative r-values, we performe two-tailed two-sample t-test (P≤.05) between patients and healthy subjects.| Table 1. Eight Selected ROIs in Each Hemisphere with their Abbreviations |
| | ROIs | Abbreviation | | Thalamus | THA | | Caudate | CAU | | Putamen | PUT | | Pallidum | PAL | | Hippocampus | HIPP | | Prefrontal Cortex | PFC | | cerebellum | CER | | motor cortex(primary motor cortex+ Premotor cortex+ Supplementary motor area) | MC(M1+PMC+SMA) |
|
|
After ROI extraction, the averaging time course of each ROI calculates. The extracted signal time courses of each subject are then cross-correlated region by region, Pearson's correlation coefficients are calculated and square correlation matrices are generated (16×16) from these values for each subject. To compare quantitative r-values, we performe two-tailed two-sample t-test (P≤.05) between patients and healthy subjects. Normality of data is confirmed by calculating skewness and kurtosis as well as Kolmogorov–Smirnov tests. Details of the results are listed in TABLEs II, where the averaging r-values and T and corresponding p values are presented. Moreover, we also do kruskal-wallis analysis as a non-parametric test to ensure the accuracy of t-test results and we found that non-parametric analysis confirms parametric results. Considering the results, the following achieved could be highlight:• In healthy group, there is negative significant correlation between motor cortex and cerebellum, while this connection in PD patients is positive and not significant. This result implies the disturbance of equilibrium function of the brain in resting state which is the most important factor in tremor. Inter group analysis with p=0.014 and t=-2.708 confirm this result.| Table 2. Averaging of R-Values and Result of Group Statistical Analysis in Functional Correlation of Selected ROIs in Left Hemisphere |
| | ROIs | NC group | PD group | Group Comparison | | ROI1 | ROI2 | r-value | p-value | r-value | p-value | p-value | T statistics | Nonparametric test | | L_CAU | L_CER | -0.011 | 0.851 | -0.278 | 0.017 | 0.033 | 2.335 | 0.023 | | L_CAU | L_HIPP | -0.132 | 0.257 | 0.0818 | 0.497 | 0.195 | -1.344 | 0.226 | | L_CAU | L_MC | -0.113 | 0.292 | -0.162 | 0.043 | 0.697 | 0.395 | 0.821 | | L_CAU | L_PALL | 0.002 | 0.984 | 0.030 | 0.808 | 0.860 | -0.178 | 0.597 | | L_CAU | L_PFC | -0.047 | 0.584 | 0.092 | 0.140 | 0.185 | -1.383 | 0.364 | | L_CAU | L_PUT | 0.222 | 0.083 | 0.259 | 0.024 | 0.808 | -0.245 | 0.650 | | L_CAU | L_THAL | 0.020 | 0.851 | 0.231 | 0.178 | 0.286 | -1.102 | 0.364 | | L_CER | L_HIPP | 0.266 | 0.135 | -0.222 | 0.023 | 0.018 | 2.689 | 0.010 | | L_CER | L_MC | -0.099 | 0.320 | 0.055 | 0.342 | 0.179 | -1.410 | 0.041 | | L_CER | L_PALL | 0.160 | 0.342 | -0.373 | 0.004 | 0.012 | 2.845 | 0.010 | | L_CER | L_PFC | -0.193 | 0.245 | -0.205 | 0.055 | 0.946 | 0.067 | 0.545 | | L_CER | L_PUT | 0.194 | 0.254 | -0.431 | 0.0003 | 0.0037 | 3.520 | 0.004 | | L_CER | L_THAL | 0.049 | 0.611 | -0.169 | 0.030 | 0.074 | 1.907 | 0.174 | | L_HIPP | L_MC | -0.020 | 0.857 | -0.161 | 0.101 | 0.335 | 0.991 | 0.406 | | L_HIPP | L_PALL | 0.368 | 0.088 | 0.291 | 0.022 | 0.734 | 0.346 | 0.705 | | L_HIPP | L_PFC | -0.111 | 0.511 | -0.040 | 0.588 | 0.698 | -0.396 | 0.762 | | L_HIPP | L_PUT | 0.388 | 0.030 | 0.311 | 0.028 | 0.695 | 0.397 | 0.762 | | L_HIPP | L_THAL | 0.228 | 0.037 | 0.114 | 0.340 | 0.451 | 0.770 | 0.762 | | L_MC | L_PALL | -0.091 | 0.336 | -0.199 | 0.013 | 0.348 | 0.966 | 0.545 | | L_MC | L_PFC | 0.311 | 0.006 | 0.176 | 0.025 | 0.235 | 1.229 | 0.226 | | L_MC | L_PUT | 0.024 | 0.869 | -0.203 | 0.024 | 0.184 | 1.397 | 0.326 | | L_MC | L_THAL | -0.161 | 0.040 | -0.249 | 0.003 | 0.351 | 0.957 | 0.406 | | L_PALL | L_PFC | -0.065 | 0.700 | -0.049 | 0.730 | 0.942 | -0.073 | 0.705 | | L_PALL | L_PUT | 0.870 | 0.0001 | 0.919 | 4.7e-07 | 0.762 | -0.308 | 0.326 | | L_PALL | L_THAL | 0.645 | 0.0001 | 0.756 | 0.0003 | 0.512 | -0.669 | 0.597 | | L_PFC | L_PUT | -0.081 | 0.643 | -0.050 | 0.638 | 0.877 | -0.156 | 0.762 | | L_PFC | L_THAL | -0.098 | 0.423 | -0.017 | 0.730 | 0.539 | -0.631 | 0.705 | | L_PUT | L_THAL | 0.573 | 0.001 | 0.539 | 3.3e-05 | 0.812 | 0.242 | 0.605 |
|
|
• In both groups, there is significant positive correlation between areas located in basal ganglia such as THALL, PUT, PALL and CAU.• In healthy, there isn’t significant correlation value between motor areas and basal ganglia areas, while in PD group there are significant negative correlations between motor cortex and cerebellum with areas located in basal ganglia (p-value<0.05 and |r|>0.169). Negative functional connectivity in PD implies decreasing activity in one regions and increasing in the other. We found in previous research that there are hyperactivation in motor cortex and hypoactivation in basal ganglia. • The only exception is significant negative connectivity between MC and THAL in both groups and both hemispheres. PICA results: The averaging number of components extracted by ICA from healthy group was 36.3 and for PD was 35. This included scanner-related artefacts such as EPI ghosting and physiological artefacts such as cardiac pulsation. Fig. 2 illustrates the ANOVA analysis for number of extracted ROIs for two groups. This figure indicates that IC numbers isn’t a discriminative parameter between two groups.After the separate single-subject PICA analyses, in order to combine the results from different subjects, we also have done group PICA[9] with 0.7 threshold and 37 ICs are extracted in each group. Spatial consistency between different IC maps was quantified by finding the spatial pair-wise correlation coefficient of each IC map from one group with each map of another group. Then we select five spatial maps in each group which have less correlation with IC maps in another group. High correlations between ICs in two groups indicate common BOLD activity and mostly related to physiological noises. Fig.3 and 4 show these patterns in healthy and PD groups respectively. So for comparing ICs in two groups, we just focused on these five patterns. To understand the anatomical information of these resting fluctuations, the 5 distinct patterns from each group were registered individually into common brain space maps using PICA.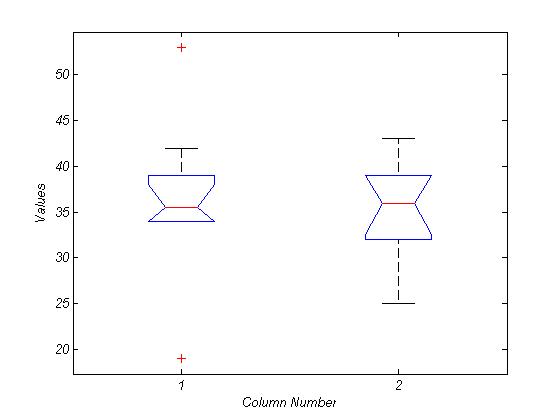 | Figure 2. ANOVA analysis for IC number between healthy (first value) and PD (second value) |
As the figures show, the peak of coherence from the maps in healthy group mostly corresponds to a region in the probabilistic thalamic atlas in FSL with strongest connectivity to the basal ganglia. By contrast, the anatomical localization of highlight cluster in IC maps of PD (Fig. 4) corresponds to a region that connects most anatomically strongly with motor cortex and basal ganglia cluster has weak BOLD signal.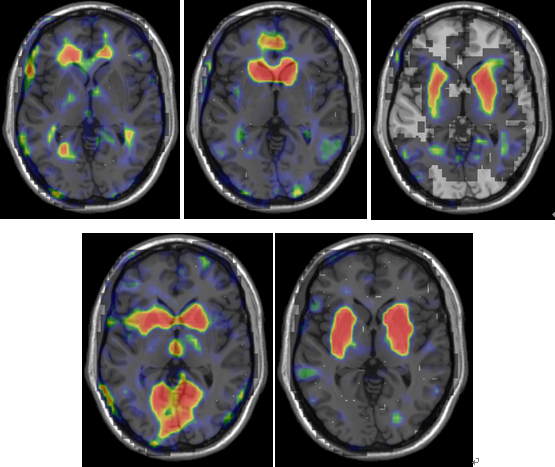 | Figure 3. Five IC maps selected from 37 extracted ICs of healthy which have less spatial correlation with extracted ICs of PD group. Background is ch2 |
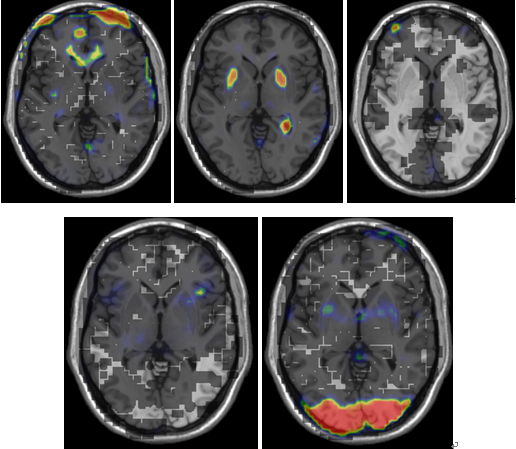 | Figure 4. Five IC maps selected from 37 extracted ICs of PD which have less spatial correlation with extracted ICs of healthy group. Background is ch2 |
4. Conclusions
In this paper, we used two analysis methods of resting state fMRI data (SCA and PICA) for investigating the changes of DMN activity in Parkinson Disease. For this purpose, we extract some ROIs based on pathophysiology of PD and apply SCA methods in regions. The statistical group analysis of pair-wise correlation shows that there is negative significant correlation between motor cortex and cerebellum in healthy, while this connection in PD patients is positive and not significant. This result implies the disturbance of equilibrium function of the brain in resting state which is the most important factor in tremor. Moreover, in both groups, there is significant positive correlation between areas located in basal ganglia such as THALL, PUT, PALL and CAU. The results show that in healthy, there is not significant correlation value between motor areas and basal ganglia, while in PD group there are significant negative correlations between motor cortex and cerebellum with areas located in basal ganglia. Negative functional connectivity in PD implies decreasing activity in one regions and increasing in the other. This result confirms our previous research that there are hyperactivation in motor cortex and hypoactivation in basal ganglia.In our study, we additionally extended analysis using a relatively unbiased approach based on probabilistic ICA[9]. We identified five distinct patterns of ICs among 37 extracted ICs in each group which have less correlation with each other. The PICA method clearly distinguishes these patterns of activity from those associated with cardio- respiratory motion of the brain. The comparison of group PICA maps showed lower DMN activation in basal ganglia. The PICA approach offers specific advantages relative to correlation-based analysis with ‘‘seeding’’ of a region identified by a prior. The result of our study show that the functional correlations between ROIs are more affected in PD than pattern maps of activity. However, these methods could potentially provide information on functional systems and the dynamics of interactions within them. They also may prove to be a useful probe for functional alterations in the brain as a consequence of changes in brain state, disease, or pharmacological interventions.
References
| [1] | J. Jankovic, “Parkinson’s disease: clinical features and diagnosis”, J Neurol Neurosurg Psychiatry, Vol. 79, Vol. 368–376, 2008. |
| [2] | R. A. Menke, J. Scholz, K. L. Miller, S. Deoni, S. Jbabdi, P. M. Matthews, M. Zarei, “MRI characteristics of the substantia nigra in Parkinson's disease: A combined quantitative T1 and DTI study”, NeuroImage, Vol. 47, pp. 435-441, 2009. |
| [3] | Rowe, K.E. Stephan, K. Friston, R. Frackowiak, A. Lees, R. Passingham, “Attention to action in Parkinson’s disease: impaired effective connectivity among frontal cortical regions”, Brain, Vol. 125 , pp. 276–289, 2002. |
| [4] | T. Wu, M. Hallett, “A functional MRI study of automatic movements in patients with Parkinson's disease”, Brain, Vol. 15, pp. 15, 2005. |
| [5] | Y. Hong, S. Dagmar, D. M, Corcos, and D. E. Vaillancourt, “Role of hyperactive cerebellum and motor cortex in Parkinson's disease”, NeuroImage, Vol. 35, pp. 222–233, 2007. |
| [6] | P. Fransson, “Spontaneous low-frequency BOLD signal fluc tuations: an fMRI investigation of the resting-state default mode of brain function hypothesis”, HumBrainMapp, Vol.26, pp. 15–29, 2005. |
| [7] | S.M. Smith, M. Jenkinson, M. W. Woolrich, C.F. Beckmann, T.E.J. Behrens, H. Johansen-Berg, , P.R. Bannister, , M. De Luca, I. Drobnjak, D.E. Flitney, R.K. Niazy, J. Saunders, J. Vickers, Y. Zhang, N. De Stefano, J.M. Brady, P.M. Matthews, “Advances in functional and structural MR image analysis and implementation as FSL”, NeuroImage, Vol. 23, pp. 208–219, 2004. |
| [8] | A. Weissenbacher, C. Kasess, F. Gerstl, R. Lanzenberger, E. Moser, C. Windischberger, “Correlations and anticorrelations in resting-state functional connectivity MRI: A quantitative comparison of preprocessing strategies”, NeuroImage, Vol. 47, pp. 1408–1416, 2009. |
| [9] | C. Beckmann, S.M. Smith, “Probabilistic independent component analysis for functional magnetic resonance imaging”, IEEE Trans. Med. Imag, Vol. 23, pp. 137– 152, 2004. |
| [10] | A. Galvan, T. Wichmann, “Pathophysiology of Parkinsonism”, Clinical Neurophysiology, Vol. 119 pp. 1459–1474, 2008. |
| [11] | M. D. Luca, C.F. Beckmann, N. D. Stefano, P.M. Matthews, and S.M. Smith, “fMRI resting state networks define distinct modes of long-distance interactions in the human brain”, NeuroImage, Vol. 29, pp. 1359 – 1367, 2006. |
 Abstract
 Reference
 Full-Text PDF
 Full-Text HTML