-
Paper Information
- Next Paper
- Previous Paper
- Paper Submission
-
Journal Information
- About This Journal
- Editorial Board
- Current Issue
- Archive
- Author Guidelines
- Contact Us
American Journal of Biomedical Engineering
p-ISSN: 2163-1050 e-ISSN: 2163-1077
2012; 2(1): 9-16
doi: 10.5923/j.ajbe.20120201.02
A New Interactive 3-D Numerical Model of the Human Mandible for Peri-Implant Analysis in-Vivo Compared With Cone Beam Computed Tomography 3-D Quality
 Abstract
 Reference
 Full-Text PDF
 Full-Text HTML
R. Moustafa 1, Tamer M. Nassef 2, M. Alkhodary 3, Mona K. Marei 3, Magdy A. Awadalla 4
1Faculty of Dentistry, Pharaohs University, Alexandria, Alex., Egypt
2Computer and Software Dept., Faculty of Engineering, Misr University for Science and Technology, Giza, Egypt
3Tissue Engineering Laboratory (TE-Lab), Faculty of Dentistry, Alexandria University, Alex., Egypt
4Prosthodontics department, Faculty of Dentistry, Alexandria University, Alex., Egypt
Correspondence to: Tamer M. Nassef , Computer and Software Dept., Faculty of Engineering, Misr University for Science and Technology, Giza, Egypt.
| Email: |  |
Copyright © 2012 Scientific & Academic Publishing. All Rights Reserved.
Dental implants have been widely and increasingly used in the past few decades to support and retain partial and complete dental prosthesis. The fear of failure due to mechanical overloading increased the need for stress-strain analysis along bone-implant interface of the ever growing designs of dental implants. Finite element analysis (FEA) was used by many authors to evaluate stresses around dental implants and to predict their survivability, where to extract a robust FEA model a realistic information system must be used. In this study an interactive 3-D model was retrieved from Computed Tomography (CT) images utilizing, a proposed software are used to obtain high image quality of the jaw bones scanned by 3-D CT compared with Cone Beam Computed tomography (CBCT) output. Identification of different anatomical regions set for mandible cortical and spongy bones with soft tissues by generated 3-D models and validated with real measurements from solid model.
Keywords: 3-D Computed Tomography, Cone Beam Computed Tomography, Dental Finite Element Analysis
Cite this paper: R. Moustafa , Tamer M. Nassef , M. Alkhodary , Mona K. Marei , Magdy A. Awadalla , "A New Interactive 3-D Numerical Model of the Human Mandible for Peri-Implant Analysis in-Vivo Compared With Cone Beam Computed Tomography 3-D Quality", American Journal of Biomedical Engineering, Vol. 2 No. 1, 2012, pp. 9-16. doi: 10.5923/j.ajbe.20120201.02.
Article Outline
1. Introduction
- Dental implants are widely used in prosthodontic rehabilitation of partially and completely edentulous maxilla and mandible to restore or improve function where mandibular over denture retained by 2 implants is considered as first- choice standard care over conventional complete denture[1]. Dental implants are provided in different materials, shape, length, diameter, implant surface treatment and coatings to enhance clinical performances and osseointegration where dentists can now choose from more than 1300 different types of implants[2]. Most implants currently available have surface coatings and roughness with random topography of variable thicknesses, from nanometers to millimeters.[3,4] High surface roughness is essential to enhance mechanical interlocking of the bone on the implant surface and to ensure proper osseointegration, however it is not the only criterion, where pattern of roughness, size and the distribution of micro or nano pores in a random or regular pattern have influenced micromechanical interlocking and strain along bone-implant interface.[5,6] Occlusal forces are transferred to bone through implant and it has long been recognized that both implant and bone should be stressed within a certain range for physiologic homeostasis. Overload can cause bone resorbtion or fatigue failure of the implant, whereas under loading of the bone may lead to disuse atrophy and subsequent bone loss.[7]Over years, attempts have been made to improve mechanical compatibility of dental implants and to reduce marginal bone loss resulting from ineffective transfer of occlusal forces from implant to the surrounding bone Implants with modified surface roughness at the nanometer scale in a reproducible manner, were introduced utilizing processing methods from the electronic industry such as lithography and surface laser-pitting.[8-10] To ensure clinical success of new dental implants designs and to predict survivability, analyzing stresses at bone-implant interface is an essential step in the overall analysis of loading, which determines the success or failure of an implant. Many different methods have been used to study the stress/strains in bone and dental implants, where Photo elasticity provides good qualitative information pertaining to the overall location of stresses but only limited quantitative information. Finite element analysis (FEA) is one of the numerical methods that capable of providing detailed quantitative data at any location within a mathematical model. FEA can simulate stress using a computer-created model to calculate stress, strain, and displacement. Such analysis has the advantage of allowing several conditions to be changed easily and allows measurement of stress distribution around implants at optional points that are difficult to examine clinically and are difficult to replicate in experiments. The distribution of forces in peri-implant bone has been investigated by FEA in several studies.[11-14]Modeling of biological tissues, such as bone related organs, is a difficult task because of their inherent inhomogeneous and anisotropic character, although inhomogeneous character is in some sense “directly” accessible via imaging techniques. Unfortunately, this is not the case for the trajectories of anisotropic elasticity. Many investigators have evaluated 3-D models from Computed Tomography (CT) 2-D images. The results of these studies have been approximated for the conversion of images formats. Mechanical anisotropy means that the mechanical properties of the material are different when measured in different directions in the same sample. For reasons of simplification, modulus of elasticity of the mandibular bones, was given constant values and considered isotropic to facilitate simulation.[15,16]To create patient specific models, the adoption of automatic mesh generators (AMG) is mandatory and assignment of proper material properties to FEA is a fundamental step to ensure predictive accuracy. The flow of peri-implant stress analysis may proceed in a sequential flow by first reconstruct mandible surface from an adequate imaging technique, second re-mesh the surface and generate surface mesh, third assign material properties to the FEA, finally set boundary conditions (as occlusal loads that are dynamic forces, axial and non-axial). Tetrahedral elements are suitable to divide the mandible model to finite elements for mechanical analysis studies like implant stress-strain; multi-objects technique can be used to separate mandible to multi-objects for decreasing the number of nodes and elements to reduce the number of FEA equations; this will accelerate the idealization process at FEA modeling. The starting point is a well reproduced geometry of a complete range of mandible to include a separation of cortical and cancellous (spongy) bone. Cortical and spongy bones provide different functions and respond differently to mechanical influences. Several imaging techniques have been available in implant dentistry for the preoperative planning and post-operative evaluation of dental implant; intra oral peri apical and occlusal radiographs, and extra oral lateral cephalometric, conventional tomograms, 2-D and 3-D CT scan, Cone Beam Computed Tomography (CBCT) and Magnetic Resonance Imaging (MRI).[14,17]Intraoral peri-apical x-rays considered inexpensive and results in reduced radiation dose, however, region covered is limited in size and does not often extend to the mandibular canal, visualization is limited to mesio-distal and apico- coronal directions. Panoramic radiography has been one of the most commonly utilized radiographic techniques in dental implantology that present a global view of the shape and height of the jawbone, it provides no information about jaw thickness and suffers from distortion factor of about 25% mainly in the horizontal (mesio-distal) direction. The visualization of most significant details is limited in cephalometric radiography by the overlapping of the left and right sides. Although low cost and availability are advantages, when this technique is used for implant planning but the advantages are limited.[17-20] The limitations of conventional peri-implant treatment planning, which was based on 2-D radiographs, have been over-passed, to a certain extent, by development of 3-D computer software systems and tools.[21] 3-D CT enabled bone density estimation, examination of alveolar ridge width and height, vertical relation between the upper and lower jaw can also be seen on the scout view and preservation of soft-tissue details that are useful in reconstructions done in esthetic areas. Using CT data, it is now possible to reconstruct 3-D images of the jaw bone and fabricate stereo lithographic models. CT data enabled interactive visualization of multi-planar 2-D sections of the relevant anatomy including axial, cross-sectional and user-defined panoramic images, extended by 3-D rendered representations of CT data. Within this multi-view graphical environment, 3-D Computer Aided Design (CAD) models of implants can be interactively inserted inside the bone and evaluated. Aesthetics and morphological considerations for implant positioning in relation to the final prosthetic restoration are integrated by using CT images that either contain the provisional tooth setup or have been generated from a diagnostic wax-up.[22]Recently, CBCT technology has evolved that allows 3-D visualization of the oral and maxillofacial complex from any plane. [23] This digital imaging system is capable of producing 2-D and 3-D images, as well as Ortho-radial views of the jaws, to permit more accurate assessment of bone for implant placement or localization of teeth and lesions within the jaws. Such cone beam system allows the physician to acquire 3-D volume data in one rotation at reasonably low levels of radiation dosage Medical CT differs in that it uses a fan-shaped beam and captures portions or slices of anatomy as the source and receptor move along the long axis of the section of anatomy being examined. The effective dose equivalent measured using CBCT is between 30 and 400 μSv, 6 depending on the manufacturer and technical factors involved. This compares with an effective dose equivalent of 2,100 μSv from a conventional medical CT scan of the maxilla and mandible.[24]The aim of this study is to generate a new interactive 3-D model based on the radiological information offered by medium-dose CT technology, the model is reconstructed by faster and easier data transformation proposed software for use in 3-D analyses including functional imaging and real time imaging for guiding interventional procedures, this was compared with quality of 3-D model retrieved from CBCT imaging. Second is meshing of the 3-D model from the CT scan to help on simulation of occlusal loads on dental implants.
2. Materials and Methods
- This study is carried out in the outpatient clinic at the Prosthodontics department faculty of dentistry Alexandria University and the Tissue Engineering laboratory, Alexandria University. Nine completely edentulous male patients are selected with age range 55-65 years old, free from any systemic disease. All patients signed an informed consent after a thorough explanation of the nature of the study in compliance with Dental Research Committee guidelines (EDRC), Faculty of Dentistry Alexandria University. All patients are scheduled for prosthetic rehabilitation by conventional maxillary complete denture and mandibular over denture retained by two dental implants (Laser micro- grooved dental implants manufactured at Princeton University-USA of fixture length 14mm and diameter 3.5mm Fig. 1. (a). Resorbable Blast Texturing (RBT) Roughened TiO2 surface dental implant 15mm in length and 3.5mm in diameter). Fig. 1. (b)
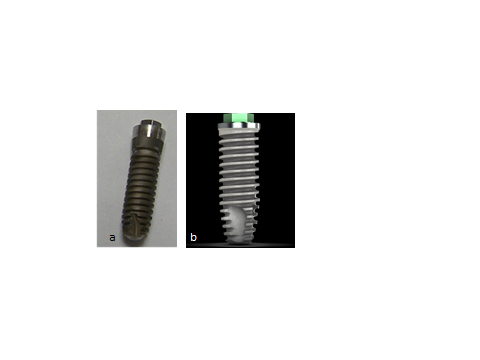 | Figure 1. dental implant fixtures used to retain mandibular overdenture, (a) Laser micro-grooved dental implant manufactured at Princeton University-USA of fixture length 14mm and diameter 3.5mm, and (b) Roughened TiO2 surface dental implant 15mm in length and 3.5mm in diameter |
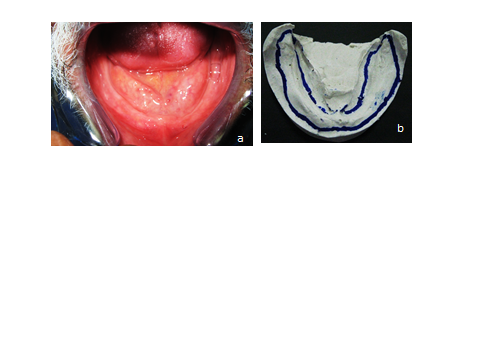 | Figure 2. (a) oral cavity o the patient showing mandibular (lower) edentulous ridge, where no signs of inflammation or pathoses were observed and (b) dental stone model that was retrieved from primary impression where the functional extension of the proposed denture was delineated |
2.1. Matrix Reduction
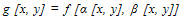
- This option allows grouping of voxels to calculate the triangles. The reduction is given relative to the X-size (= Y-size) of a pixel in the image and relative to the height (Z-size) of a pixel in the 3-D dataset, where XY resolution Decides how many voxels are grouped in the XY plane and Z resolution Decides how many voxels are grouped in the Z-direction. The XY- or Z-resolution of 1 means no matrix reduction in the plan or the Z-direction. To use the matrix reduction needs to avoid using the gray-value interpolation algorithm for reconstruct the 3-D model, where The gray level f at the location [x, y] is transferred to the new coordinates [x0, y0] to create the output image f [x0, y0]. This sequence of operations equivalent to defining a “new” image g [x, y] in the same coordinates [x, y] but with different gray levels; hence,
 | (1) |
 {T, W = A with inter-
 contour spaces set to M}repeat
 {Grayscale erode W untiluntil max(W) < M all M pixels are gone}
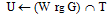 {Dilate & mask to overlap}
 {Overlap V=medial line(s)}for all V > 0
 medial line mask}
 {Get medial line height}
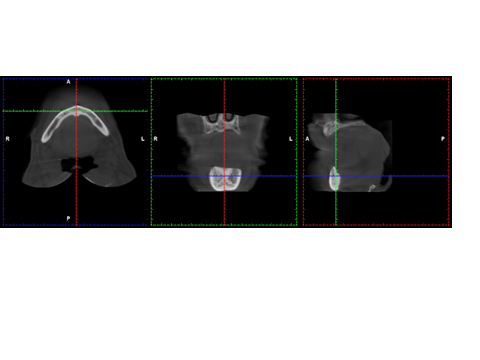
 new medial pixels} In the default configuration of DICOM format output of images appear in a 3-D engineering view. The images in the right view are called the axial images (XY-view or Top-view) and are surrounded by a red border. The upper left view (surrounded by an orange border) shows the coronal images that are the images resliced in the XZ-direction (Front-view). The lower left view (surrounded by a green border) shows the sagittal images that are the images resliced in the YZ-direction (Side-view) as shown at Fig. 3.
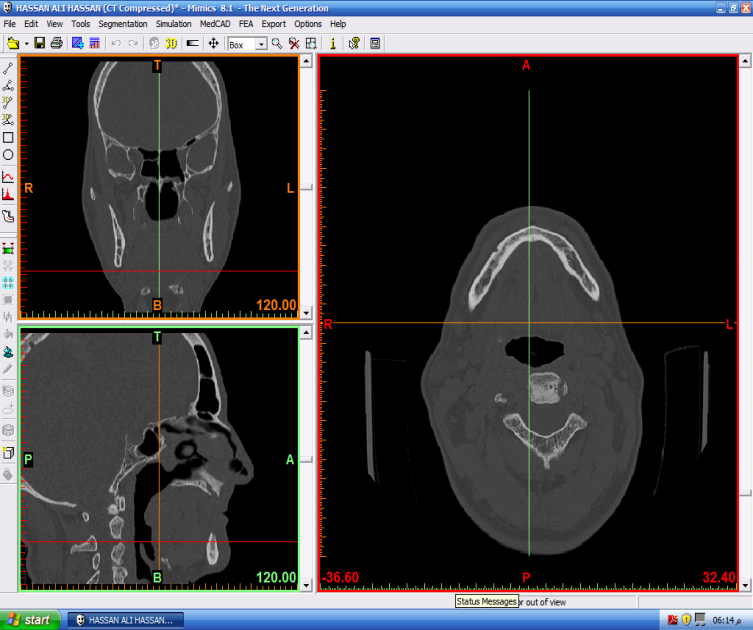 | Figure 3. Representative CT image showing axial, coronal, and sagittal thin section slices |
2.2. Triangle Reduction
- Triangle reduction allows reducing the number of triangles in the mesh. This makes it easier to manipulate the file. There are two types of triangle reduction, the Point-type and the Edge-type. They both have the same parameters. The edge reduction algorithm generates less noise on the resulting surface and is therefore better for medical objects. The point reduction could be better for technical objects. The Tolerance indicates the maximum deviation in mm that a related triangle may have, to be part of the same plane that contains the selected triangle. It makes sense to keep this value related to the pixel size. The Number of iterations defines how many times the program should make the calculations. The algorithm needs several iterations to reduce the number of triangles in larger flat areas. This algorithm converges to a stable result after about 15 iterations. Therefore more than 15 iterations do not make a lot of sense. The Edge Angle-value defines which angle should be used to determine edges of the part that cannot be removed. Triangles deviating less than this angle will be grouped into the plane of the other triangles.It is advisable not to use the reducer on very noisy dataset. In this case it is better to perform a smoothing first. If a plane, defined by the Tolerance and the Angle consists out of several triangles, the program will try to re-triangulate this area. The Point-type reduction mode will try to reduce the amount of triangles by removing a point. The Edge-type will remove a triangles edge (two points + the connecting line between these two points). If the tolerance-value is too big, essential part information may get lost.
3. Results and Discussion
- The lower denture was duplicated in clear acrylic resin, metal balls about 4mm in diameter was placed in the proposed implant position and a panoramic x-ray was made to the patient to verify the implant position to be away from the mandibular nerve canal to avoid injury of the nerve during surgical implant placement as shown at Fig. 4.
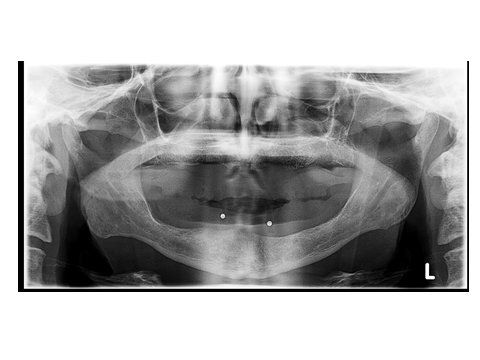 | Figure 4. Image showing panoramic x-ray image of the patient wearing a clear acrylic template with metal balls placed in the fitting surface o the template in the proposed implant position |
 | Figure 5. Representative CBCT image showing (a) axial, (b) coronal, (c) sagittal thin section slices |
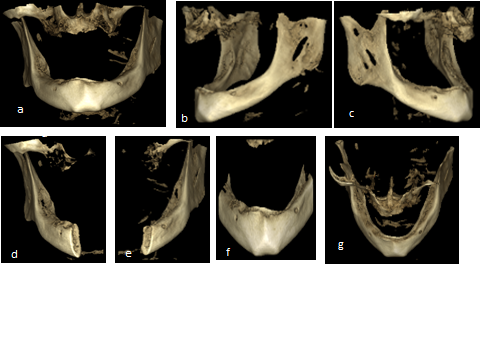 | Figure 6. Representative CBCT image showing three dimensional model of the patient (a) frontal view, (b) lateral left view, (c) right side, (d) right side of the mandible in cross section, (e) left side of the mandible in cross section, (f) anterior segment of the mandible, (g) posterior view of the mandible showing outer and inner cortical plate o bone and in between cancellous bone |
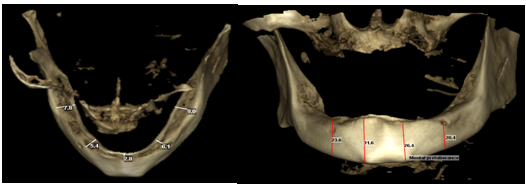 | Figure 7. CBCT Measurements: (a) Measurements of alveolar crest width: Right molar region: 7.8mm, Right at mental foramen: 5.4mm, At midline: 2.8mm, Left molar region: 9.0 mm, and Left at mental foramen: 6.1 mm, (b) Vertical length at right mental foramen: 23.6mm, At Left mental foramen: 20.4mm, Right mental protuberance: 31.6mm, Left mental protuberance: 26.4mm |
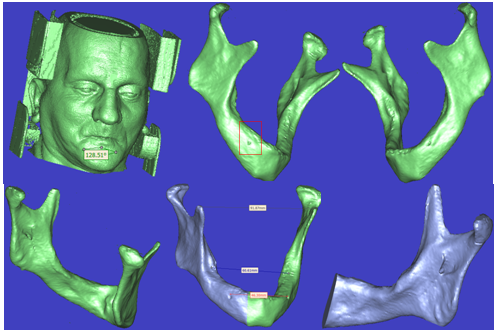 | Figure 8. Representative 3-D CT image showing three dimensional model of the patient (a) anterior view of fully face skin (Soft Tissue) with ears (Cartilage) and even the CT scanner device (Metal) without any artefact, (b) fully mandible right rotated side, (c) left rotated side, (d) Posterior view of the mandible, (e) left and right sides segmented with some measurements, (f) right side of mandible rotated, resized and translated |
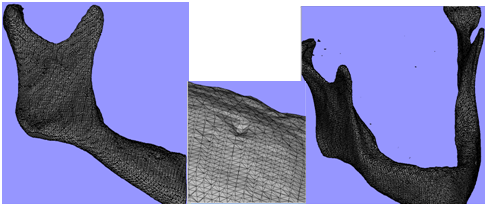 | Figure 9. Representative 3-D mesh process of the mandibular mdel (a) right mandible side are mished by tetrahedral elements with all topographic details, (b) zooming on mental foramen side with the elements reductions, (c) fully mandible meshing with conroid process and TMJ. |
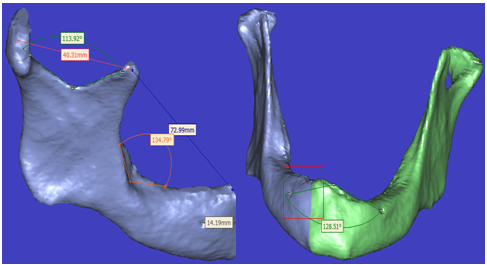 | Figure 10. Representative 3-D model with some measurement determination (a) angular and direct line measures on the right mandible side, (b) fully mandible with angular determination |
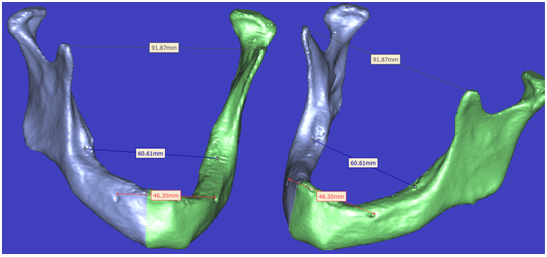 | Figure 11. Representative 3-D model with some measurement determination with rotation and translation process without any change at measured records |
4. Conclusions
- One of the drawbacks of CBCT was its inability of discriminating soft tissue because of its low contrast resolution. When comparing CT with CBCT reconstructed images, CT scans showed the most suitable images for tumor-derived alterations due to their capacity for soft tissue reconstruction. On the other hand, CBCT could only visualize primary osseous tumours or soft tissue tumours via osseous destruction of an impinging tumour. The ideal goal of the radiographic examination is to achieve as much information on the jawbone as possible and at the same time minimize the radiation burden to the patient regarding the ALARA principle (as low as reasonably achievable) and the costs. This radiation dose has to be balanced by the required information for implant placement. Its use can seldom be justified except for the imaging of large jawbone segments.A contour interpolation results in a 3-D that looks smoother and better (less gaps). Contour interpolation is recommended to use for medical CT applications, where a Grey value interpolation results always in correct dimensions and correct positioning of the 3-D, but the 3-D can be noisy. This new interactive reconstruction model can helps at diagnosis and pre-surgical process and provides a direct meshing lossless method for the FEA to ensure that all numerical analysis that can be determined from these models gain the reality and be more accurate than other classical methods.
References
| [1] | J.S. Feine, G.S. Carlsson, M.A. Awad, A. Chehade, W.J. Duncan, S. Gizani, et al, "The McGill consensus statement on overdentures," Int. J. Prosthodont., vol. 15, pp. 413-414, 2002. |
| [2] | Y. Oshida, E.B. Tuna, O. Aktören and K. Gençay, "Dental Implant Systems, review," Int. J. Mol. Sci., vol.11, pp.1580-1678,2010. |
| [3] | K. Mustafa, J. Wroblewski, K. Hultenby, B.S. Lopez and K. Arvidson,"Effects of titanium surfaces blasted with TiO2 particles on the initial attachment of cells derived from human mandibular bone. A scanning electron microscopic and histomorphometric analysis," Clin. Oral Implants Res., vol. 11, pp. 116–128, 2000. |
| [4] | D. Weng, M. Hoffmer, M.B. Hurzeler and E.J. Richter," Osseotite versus Machined surface in poor bone quality," Clin. Oral Implants Res. vol. 14, pp. 703–708, 2003. |
| [5] | A. Wennerberg, T. Albrektsson and J.J. Albrektsson- Kroll," Histomorphometric and removal torque study of screw-shaped titanium implants with three different surface topographies," Clin. Oral Implants Res., vol. 6, pp.24-30, 1996. |
| [6] | V. Borsari, G. Giavaresi, M. Fini, P. Torricelli, M. Tschon, R. Chiesa, et al.," Comparative in vitro study on ultra-high roughness and dense titanium coating,". Biomaterials, vol. 26, ppt. 4948–55, 2005. |
| [7] | E. Kitamura, R. Stegaroiu, S. Nomura and O. Miyakawa, " Biomechanical aspects of marginal bone resorption around osseointegrated implants: considerations based on a three-dimensional finite element analysis," Clin. Oral Implants Res. vol.15, pp.401–412, 2004. |
| [8] | M.A. Alkhodary, M.K. Marei, M.A. Awadalla, W. Soboyejo and Y.M. Kadah, " A study of the interface strength of dental implants nano-grooved by laser with and without Arginine-Glycine-Aspartic acid (RGD) coating," P.H.D thesis, faculty of Dentistry, Alexandria university, 2010. |
| [9] | S. Schlie, E. Fadeeva, A. Koroleva, A. Ovsianikov, J. Koch, A. Ngezahayo and B.N. Chichkov, " Laser-Based nano engineering of surface topographies for biomedical applications," Phot. Nano. Fund. Appl., vol. 9, pp. 159-62, 2010. |
| [10] | R. Branemark, L. Emanuelsson, A. Palmquist and P. Thomsen, "Bone response to laser-induced micro- and nano-size titanium surface features," Nanomed.: Nanotech. Biol. and Med., vol.; 7, pp. 220-227, 2011. |
| [11] | A.W. Gonçalves, R.B.V. Adelino, T.L. Fernando, G.E. Alves, D.J. Aparecida and S.P. Henrique, "Biomechanics Studies in Dentistry: Bioengineering Applied in Oral Implantology," J. Craniofac. Surg., vol. 20, pp. 1173-1177, July 2009. |
| [12] | G. Tepper, R. Haas, W. Zechner, W. Krach and G. Watzek, " Three dimensional finite element analysis of implant stability in the atrophic posterior maxilla: a mathematical study of the sinus floor augmentation," Clin. Oral Implants Res., vol. 13, pp. 657–65, 2002. |
| [13] | T. Baiamonte, M.F. Abbate, F. Pizzarello, J. Lozada and R. James, "The experimental verification of the efficacy of finite element modeling to dental implant system," J. Oral Implantol., vol. 22, pp. 104–110, 1996. |
| [14] | T.M. Nassef, N.H. Solouma, M. Alkhodary, M.K. Marei and Y.M. Kadah, "Extraction of human mandible bones from multi-slice computed tomographic data," 1st Middle East Conference on Biomedical Engineering (MECBME), pp. 260–263, 2011. |
| [15] | S. Lettry, B.B. Seedhom, E. Berry and M. Cupponea, "Quality assessment of the cortical bone of the human mandible. Bone," vol. 32, pp. 35–44, 2003. |
| [16] | A.M. O’Mahony, J.L. Williams, J.O. Katz and P. Spencer, "Anisotropic elastic properties of cancellous bone from a human edentulous mandible," Clin. Oral Implant Res., vol. 11, pp. 415–421, 2000. |
| [17] | S.A. Ahmed, T.M. Nassef, N.I. Ghali, G. Schaefer, and A. E. Hassanien, "Determining protrusion cephalometric readings from panoramic radiographic images," IEEE-EMBS International Conference onBiomedical and Health Informatics, BHI, in press. |
| [18] | H.M. Frost, "Wolff’s law and bone’s structural adaptations to mechanical usage: an overview for clinicians," Angle Orthod., vol. 64, pp. 175– 188, 1994. |
| [19] | C. BouSerhal, R. Jacobs, M. Quirynen and D. Steenberghe, "Imaging Technique Selection for the Preoperative Planning of Oral Implants: A Review of the Literature," Clin. Implant Dent. Relat. Res., vol.4, pp. 156- 172, 2002. |
| [20] | M.S. Reddy and I.C. Wang, "Radiographic determinants of implant performance," Adv. Dent. Res., vol.13, pp. 136-45, 1999. |
| [21] | C. BouSerhal, R. Jacobs, M. Quirynen, Daniel van Steenberghe, "Imaging Technique Selection for the Preoperative Planning of Oral Implants: A Review of the Literature", Clin. Implant Dent. Rel. Res., pp. 156–172, 2002. |
| [22] | K. Lal, G.S. White, D.N. Morea and R.F. Wright, "Use of stereolithographic templates for surgical and prosthodontic implant planning and placement. Part I. The concept," J. Prosthodont., vol. 15, pp. 51–58, 2006. |
| [23] | A. Ruprecht, " Oral and maxillofacial radiology. Then and now," J. Am. Dent. Assoc., vol. 139, pp. 5s-6s, 2008. |
| [24] | W.B. Howerton and Mora M.A, "Advancements in Digital Imaging What Is New and on the Horizon?" J Am. Den.t Assoc., vol. 139, pp. 20S-24S, 2008. |
| [25] | G.A. Zarb, C.L. Bolender, S.E. Eckert, F.R. Jacob, A.H. Frenton, and R. Mericke-Ster.[C.O. Boucher],prosthodontic treatment or edentulous patients: complete dentures and implant supported prosthesis, 12th ed.,Mosby 11830Westline, Industrial Drive St Louise, 2004. |