-
Paper Information
- Next Paper
- Previous Paper
- Paper Submission
-
Journal Information
- About This Journal
- Editorial Board
- Current Issue
- Archive
- Author Guidelines
- Contact Us
American Journal of Biomedical Engineering
p-ISSN: 2163-1050 e-ISSN: 2163-1077
2011; 1(2): 72-77
doi: 10.5923/j.ajbe.20110102.13
Modeling of the Flow within Scaffolds in Perfusion Bioreactors
 Abstract
 Reference
 Full-Text PDF
 Full-Text HTML
X. Yan , X. B. Chen , D. J. Bergstrom
Department of Mechanical Engineering, University of Saskatchewan, Saskatoon, S7N5A9, Canada
Correspondence to: X. B. Chen , Department of Mechanical Engineering, University of Saskatchewan, Saskatoon, S7N5A9, Canada.
| Email: |  |
Copyright © 2012 Scientific & Academic Publishing. All Rights Reserved.
Tissue engineering aims to produce artificial organs and tissues for transplant treatments, in which cultivating cells on scaffolds in bioreactors is of critical importance. To control the cultivating process, the knowledge of the fluid flow inside and around a scaffold in the bioreactor is essential. However, due to the complicated microstructure of a scaffold, it is difficult, or even impossible, to gain such knowledge experimentally. In contrast, numerical methods employing computational fluid dynamics (CFD) have proven promising to alleviate the problem. In this research the fluid flow in perfusion bioreactors is studied with numerical methods. The emphasis is on investigating the effect of the controllable parameters in both the scaffold fabrication (i.e., the diameter of scaffold strand and the distance between two strands) and cell culture process (i.e., the flow rate) on the distribution of shear stress within the scaffold in a perfusion bioreactor. The knowledge obtained in this study will allow for improved control strategies in scaffold fabrication and cell culturing experiments.
Keywords: Perfusion Bioreactor, CFD, Velocity, Wall Shear Stress
Cite this paper: X. Yan , X. B. Chen , D. J. Bergstrom , "Modeling of the Flow within Scaffolds in Perfusion Bioreactors", American Journal of Biomedical Engineering, Vol. 1 No. 2, 2011, pp. 72-77. doi: 10.5923/j.ajbe.20110102.13.
Article Outline
1. Introduction
- Tissue engineering is an emerging field with the aim of repairing or creating new tissues. It is evident that the scaffold plays a critical role in forming the required constructs in a bioreactor[1]. In bioreactors, biological and biochemical processes occur under closely monitored and tightly controlled environmental or operating conditions. As such, bioreactors play a significant role in the in vitro experiments of tissue engineering[2]. The perfusion bioreactor, in which the culture medium continuously flows through the pores of the scaffold, is superior compared to other bioreactors (e.g. the spinner flask bioreactor and the rotating wall vessel bioreactor) since mass transfer is enhanced within the scaffold. The scaffold in a perfusion bioreactor can have adequate nutrient supply, timely waste removal, and sufficient gaseous exchange, thus promoting cell growth and proliferation within the scaffold[3]. However, increased flow rates can create large shear stresses on the scaffold, which can in turn wash away the attached cells, adversely influence the cellular metabolism, and evendamage the cells. It is noted in the literature[4,5] that amoderate shear stress ishighly beneficial to the formation ofglycosaminoglycan (GAG) and thus cartilage tissues. Therefore, a compromise between the mass transfer and the shear stress must be made in the cell culture for a given application.Due to the lack of adequate sensors, it is difficult, even impossible, to measure the local shear stress distribution within a scaffold[6]. Computational fluid dynamics (CFD) shows promise in solving this problem. CFD has been widely used in various fields because it often requires less time and fewer resources than experiments. In tissue engineering, CFD has recently shown promise in visualizing the flow phenomena within bioreactors, thus providingthe detailed information and insight, which would be difficult to gain by experiments.The local volume average approach is one method to evaluate the average shear stress in a porous media, for which specific mathematical modelsarerequired[6]. The limitation of this method is that only the averaged shear stress, rather than its distribution, can be obtained. To overcome this limitation, various approaches have been developed and reported in the literature, though at their early stage.In the earliest studies, scaffolds were treated as impermeable constructs in the development of CFD models. Based on simulation results, improved designs for bioreactors and scaffold constructs were reported[7-10]. In the following studies, the scaffold structure was taken into consideration in the model development. For scaffolds with irregular structures such as those fabricated by means of conventional fabrication methods, micro-computed tomography (μCT) was used to create 3-dimensional (3D) geometric models[3, 11-13]. In addition to μCT, another method to deal with irregular geometry is to treat the inner structure as a repetitive pattern of units by means of computer-aided-design (CAD) methods. The shear stress distribution in such a unit has been studied with a focus on identifying the effect of pore size and porosity on it[6, 11, 14]. In these studies, the scaffolds with irregular internal structures were significantly simplified in the model development, thus causing to the errors in the following simulation. Currently,scaffolds manufactured by rapid prototyping (RP) techniques have shown promising in various tissue engineering applications due to their controllable microstructure[15, 16] For such scaffolds, the structure is regular and the geometry can be readily modelled by CAD methods. Singh et al.[17, 18] utilized commercial CFD software to create models of such scaffolds in bioreactorsand studied the influence of mechanical stimuli on the velocity and shear stress distribution. Unfortunately, their studies were limited to non-perfusion bioreactors.In this research, scaffolds with a regular structure, such as those fabricated through the RP technique, are modelled under both perfusion and non-perfusion situations. This studyaims to represent the flow field within the scaffold and to identify the influence on the wall shear stress distribution of the controllable parameters in scaffold fabrication and cell culture process.
2. Methodology
2.1. Bioreactor Configuration
- Both the perfusion and non-perfusion bioreactors considered in this study are shown schematically in Figure1, with thedifference in the inlet and outlet locations. A cell seeded tissue scaffold is placed between the two struts and the chamber allows for circulation of the fluid medium. A perfusion system occurs when the inlet flow comes directly through the channel inside the struts and enters the bottom surface of the scaffold (Figure 1(a)). A non-perfusion system occurs when the inlet is located at the wall of the chamber (Figure 1(b)). In the present study, the inlet diameter is 10mmand the height, length and width of the chamber are 140, 50 and 50 mm, respectively. Taking advantage of the symmetry of the chamber, only one-fourth of the bioreactor chamber is modelled to reduce the computation needed.
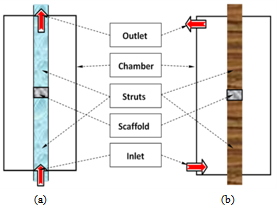 | Figure 1. Schematic of bioreactors: (a) perfusion bioreactorand (b) non-perfusion bioreactor |
2.2. Scaffold Used for Model Development
- The structure of the scaffolds for the model developmentis shown in Figure 2, in which the strand diameter (D) and the horizontal span(Y) can be controlled during the scaffold fabrication [16, 19]. Also shown in Figure2 are the distance between two adjacent horizontal (hxy) and vertical (hz) strands, which together represent the pore size. While both the vertical pore size (hz) and the horizontal distance (hxy) are associated with the strand diameter (D) and the horizontal span (Y), respectively, the vertical pore size (hz) is also affected by the scaffold material properties due to the fusion of the two strands. Based on the previous research in our group [16], the vertical pore size (hz) is determined by the diameter of the strand (D), the density of the scaffold material (ρ), the elastic limit stress (τe), the horizontal span (Y) and the angle between the two layers (θ) (Figure 2). The approximate relationship can be described as follows:
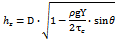 The values of the density (ρ) and elastic limit stress (τe) are different for different scaffold materials. In the present study, a chitosan solution with 40% hyroxylapatite (HA) gel is assumed to be used for the scaffold fabrication and its elastic limit stress (τe) is 11.0 Pa as identified in [16]. In the present study, the strand diameter D was varied from 0.2 to 0.4 mm, while the horizontal span Y was varied from 0.5 to 0.9 mm.The corresponding vertical pore sizes are given in Table 1. With this information, the geometric model was constructed in SOLIDWORKS. From the geometric model, the porosity, which is defined as the ratio of the void volume to the total volume, was calculated for each scaffold. The calculated porosity values are also listed in Table 1.
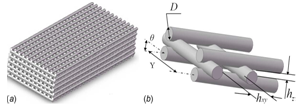 | Figure 2. Geometric parameters for tissue scaffold |
2.3. Computational Method
- When a tissue scaffold is submerged in the fluid environment within a perfusion reactor, the fluid not only flows around the outside of the scaffold but also within the scaffold itself. The fluid deformation then results in the development of fluid stresses: of specific interest in this study are the shear stresses exerted on the surface of the strands of the scaffold which can be considered as the shear stress on the attached cells. The model geometry created in SOLIDWORKS was imported into the commercial CFD package ANSYS-CFX, which was used to solve the Navier-Stokes equations to determine the velocity field and also the shear stress exerted on the scaffolds. In this case, the flow was treated as three-dimensional, incompressible flow of a Newtonian fluid.CFX-Mesh as used to create three unstructuredmeshes with 284681, 622261 and 1142781 elements, respectively. The difference in the calculated maximum wall shear stresses between the last two meshes was approximately 1.5%. Therefore, the mesh with 622261 elements, shown in Figure 3(b), was assumed to be fine enough to accurately determine the flow field. The simulation used a non-uniform unstructured mesh or grid in which the element size was varied for different parts of the bioreactor. Local grid refinement was used to resolve the tissue scaffold geometry, as shown in Figure 3(c). Near the scaffold surface, the grid size ranged from 0.1to 0.12mm, while the maximum grid length near the wall of the bioreactor chamber was 7 mm.
 | Figure 3. a)Geometric model, b) mesh, and c) refined mesh around tissue scaffold |
2.4. Boundary Conditions
- As show previously in Figure1(a), for a perfusion bioreactor, the fluid enters the scaffold through the bottom strut. A constant mass flow rate boundary condition was specified at an inlet section located upstream of the scaffold within the supporting strut. In this way, the flow can develop within the channel inside the channel to simulate the actual experimental condition. Note that the internal flow can connect with the fluid outside the scaffold through the open channels of the scaffold, and in this way, the internal fluid creates a small disturbance in the fluid contained in the bioreactor. The outlet was placed at an exit plane located within the channel inside the strut.In this case, the average pressure at the outlet was set to zero. The walls of the chamber, the struts and the scaffold were assumed to be no-slip, solid walls.The simulations were first performed for a scaffold with D = 0.3 mm and Y = 0.7 mm. To investigate the effect of flow rate, three different flow rates were considered: 0.05ml/min, 0.10ml/min and 0.15ml/min. In order to assess the effect of geometry, additional simulations explored scaffolds in which the strand diameter (D) and horizontal span (Y) were independently varied, as shown in Table 1.
3. Results and Discussion
3.1. Comparison of Flow Field for Perfusion and Non-perfusion Bioreactors
- Simulations were initially carried out for a tissue scaffold with a strand diameter of D = 0.3 mm and horizontal span of Y = 0.7mm, for the case of both perfusion and non-perfusion bioreactors. Figure4 shows the simulation results for the case of the perfusion bioreactor. In this figure, it is seen that the majority of the streamlines go through the tissue scaffold, implying that there is strong perfusion inside the scaffold. In contrast, Figure 4(a) shows that there is minimal fluid motion in other areas of the bioreactor. As a result, the strong perfusion produces relatively high shear stresses on the surfaces of the strands in some regions of the scaffold as shown in Figure4(c). The shear stress typically is larger near the outer edge of the scaffold. This suggests that when seeding cells, one strategy might be to seed more cells in the centre area of the scaffold to avoid the regions of highshear stress created by the perfusion flow.
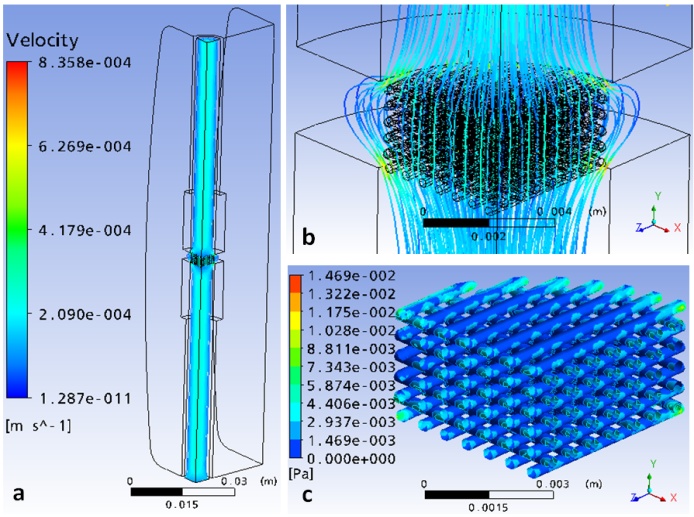 | Figure 4. Simulation results for the scaffold with D=0.3mm and Y=0.7mm in a perfusionbioreactor: a) velocity streamlines in bioreactor, b) velocity streamlines around the tissue scaffold, and c) surface shear stress distribution in the scaffold |
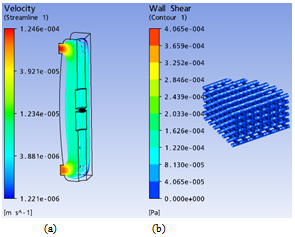 | Figure 5. Simulation results for the scaffold with D=0.3mm and Y=0.7mm in a non-perfusion bioreactor: a) velocity streamlines, and b) wall shear stress distribution in the tissue scaffold |
3.2. Flow Field within the Scaffold in the Perfusion Bioreactor
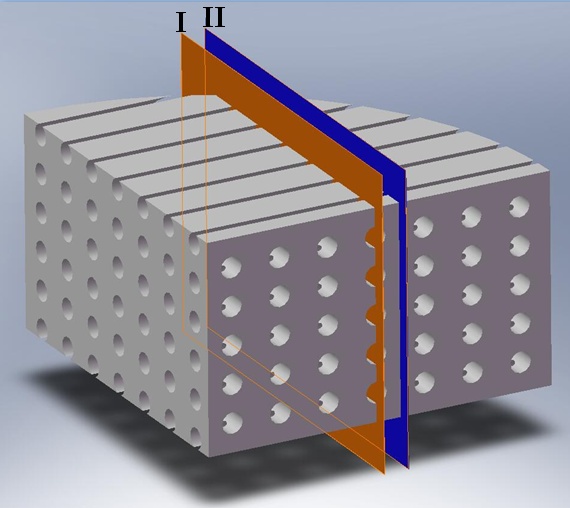 | Figure 6. The location of the two sections used to visualize the flow |
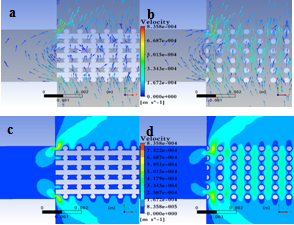 | Figure 7. Velocity distribution for two cross-sections at different locations within the scaffold: a) velocity vectors in section I, b) velocity vectors insection II, c) velocity magnitude in section I, and d) velocity magnitude in section II |
3.3. Wall Shear Stress within the Scaffold in the Perfusion Bioreactor
- The local wall shear stress within the scaffold can be affected by the scaffold geometric parameters including the strand diameterand the horizontal span as well as the flow rate of the circulated medium. Numerical simulations were performed for the cases presented in Table 1 and the results were compared to illustrate the effect of D and Y on the wall shear stress distributions. Figure 8 presents the discrete probability distribution for the magnitude of the wall shear stress for different values of D and Y. From the results, it is seen that the level of the wall shear stress values mostly appear in the bin centred on 1 mPa. With an increase in D (from top to bottom), the distribution tends to extend to higher pick values and the mean values also increases. Looking Figure.8 from left to right for a given value of D, with an increase in the value of Y, the wall shear stress has probability of appearing in the bin centred on 1 mPa. A similar conclusion can be drawn from Figure9, which shows the dependence of the average surface shear stress for scaffolds with different values of D and Y. This suggests that scaffolds with a smaller strand diameter can be used in cell culture in a perfusion bioreactor to limit the wall shear stress levels within the scaffold. Another summary conclusion is that so long as the mechanical strengthcriterion is satisfied, the horizontal span can be used to adjust the shear stress level within the scaffold. Specifically, for a given flow rate, a larger span will result in a reduction in the average shear stress level.
 | Figure 8. Distribution of surface shear stress for scaffold in perfusion bioreactor |
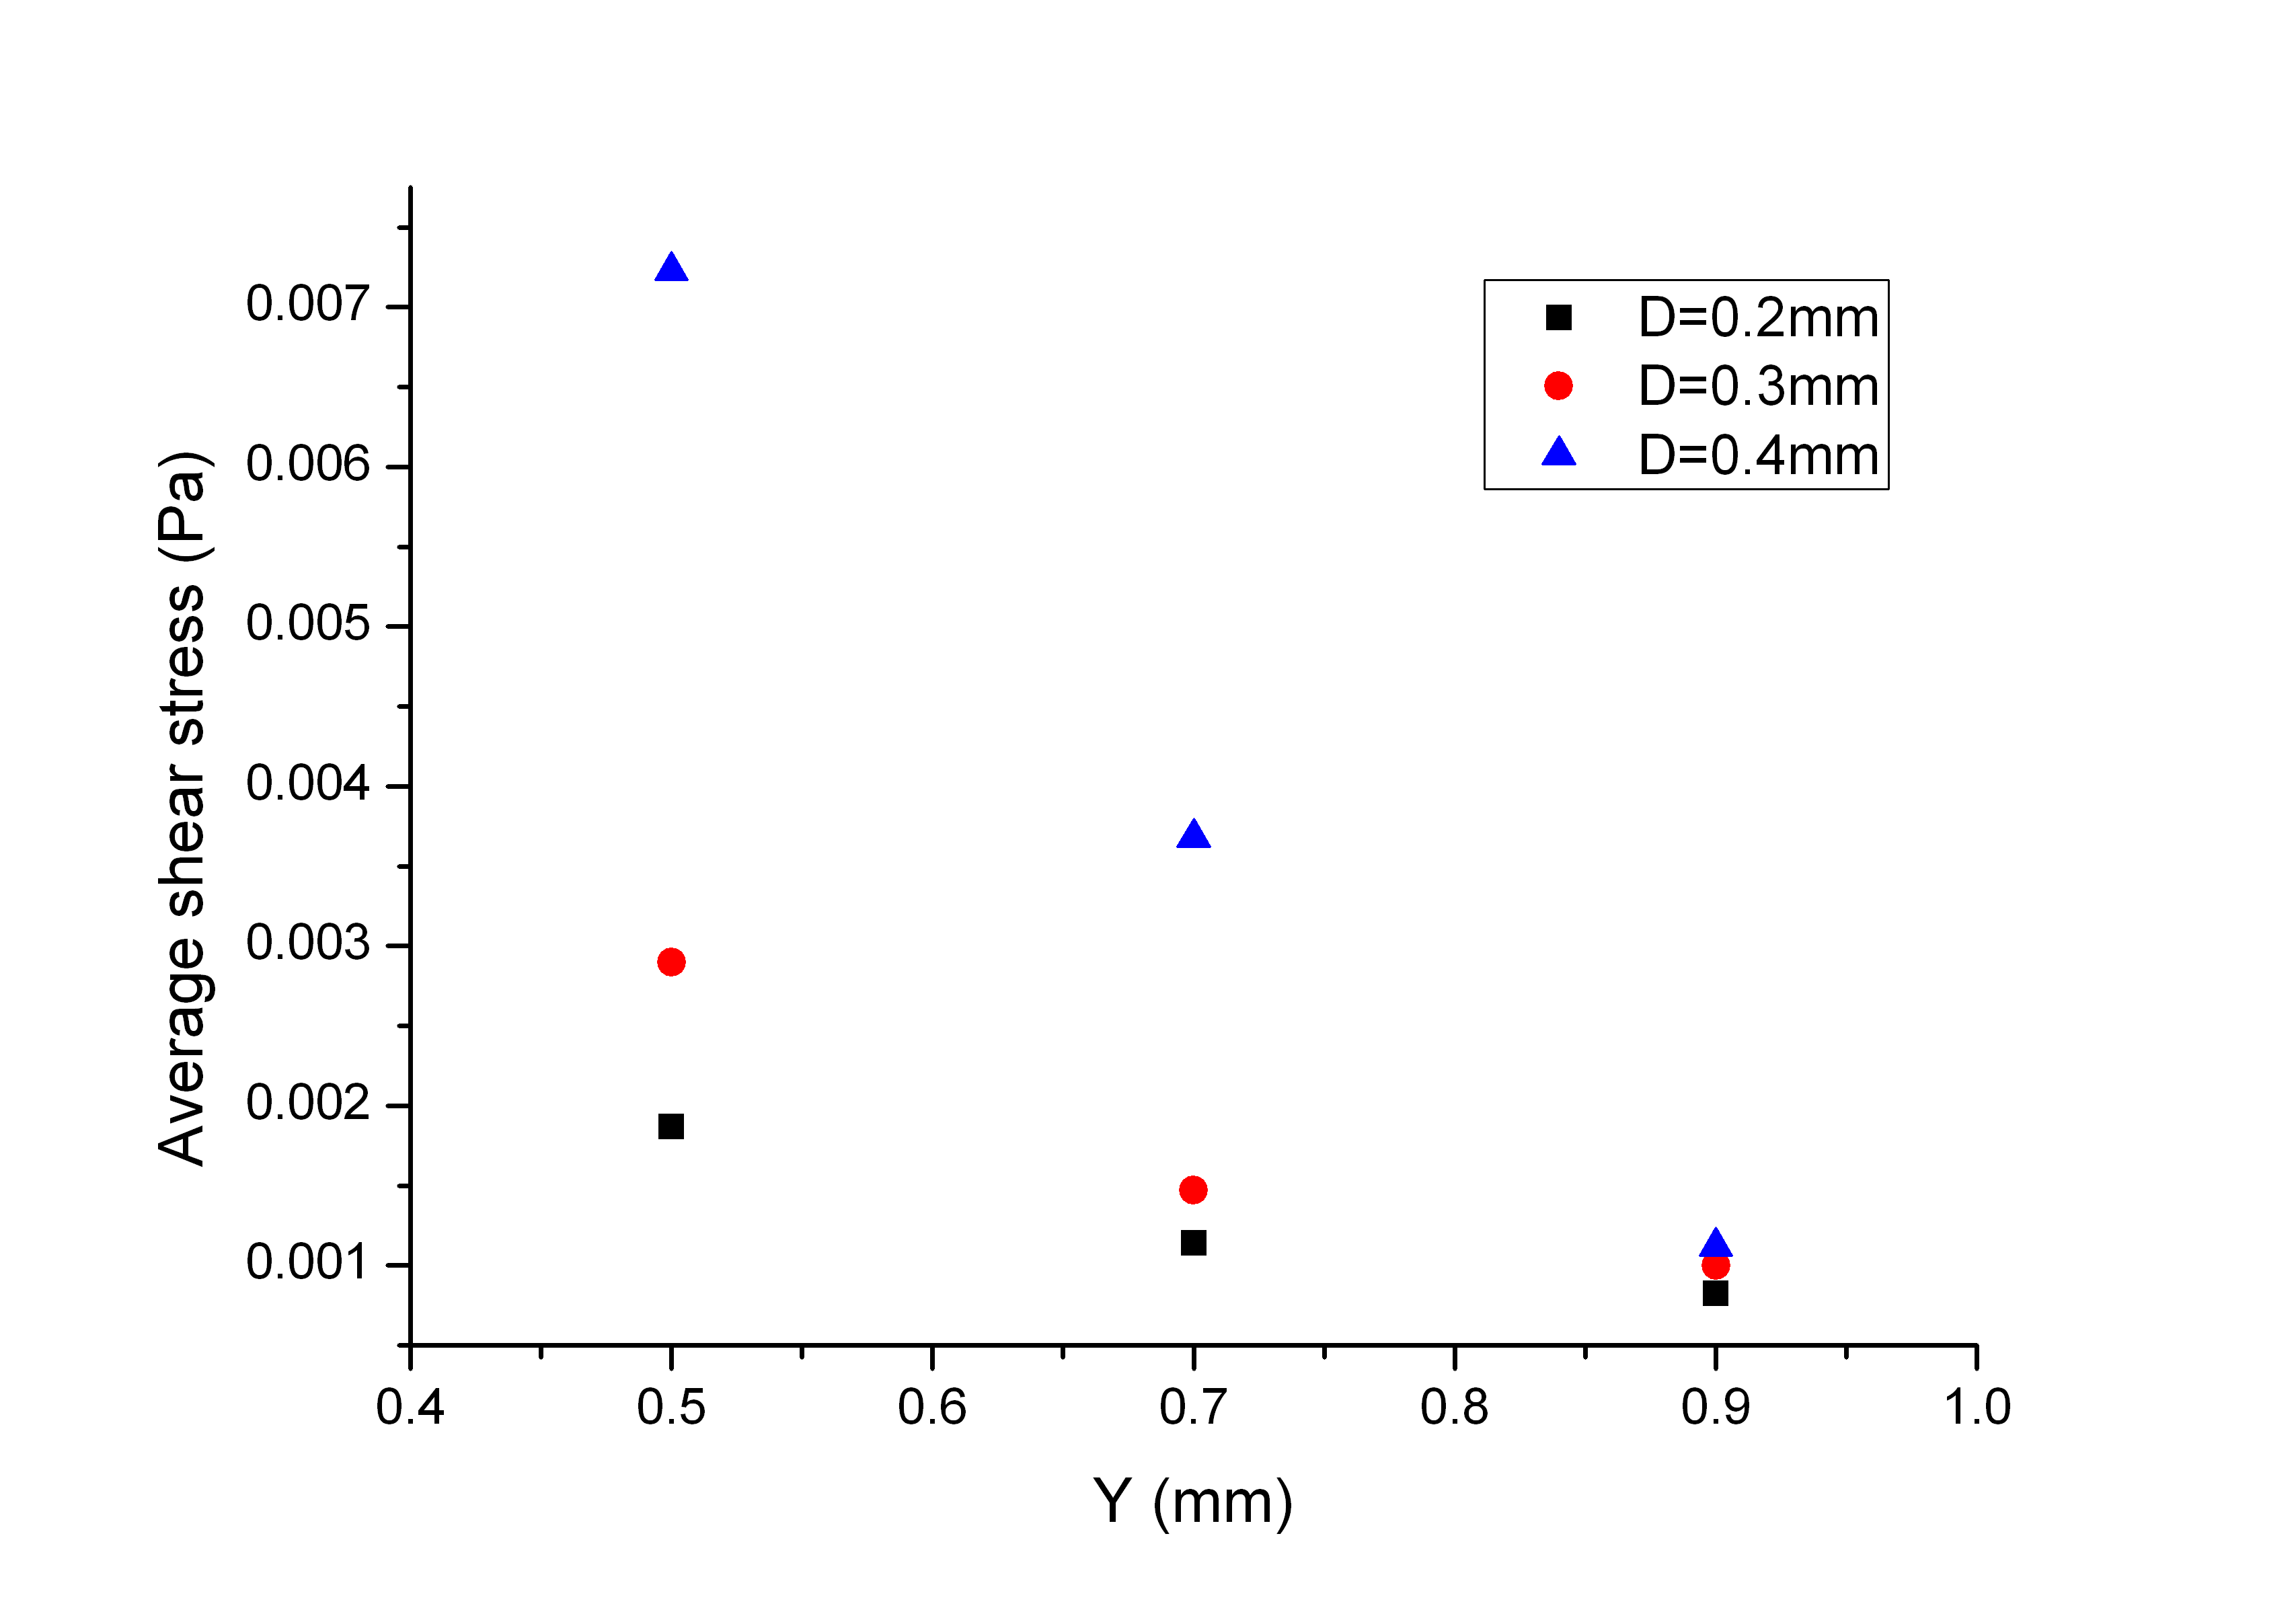 | Figure 9. Average shear stress distribution versus D and Y |
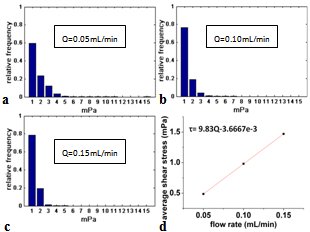 | Figure 10. Shear stress distribution within scaffold for different flow rates: a) Q=0.05 mL/min, b) Q=0.10 mL/min, c) Q= 0.15 mL/min, and d) average wall shear stress versus Q |
4. Conclusions
- The fluid flow inside and around a scaffold in a bioreactor is complex. This paper presents an investigation into such a flow within scaffolds cultured in both perfusion and non-fusion bioreactors, respectively. The simulation results demonstrate that the perfusion bioreactor provides a strong flow within the tissue scaffold, thus increasing the shear stress on the scaffold surface as compared to the non-perfusion bioreactor.The results also show that the value of the strand diameter and horizontal span can affect the shear stress generated on the scaffold. Generally, with an increase in the diameter, the shear stress level also increased; with an increase in the horizontal span, the shear stress decreased. The effect of flow rate, a controllable parameter in the cell culture process, was also investigated and it was found that the average shear stress level increased linearly with the flow rate.The knowledge obtained from this research provides a quantitative insight into the velocity fieldand the shear stresses distributionwithin the scaffoldcultured in bioreactors. The effects of the controllable factors identified by the present study can be used to guide future scaffold design as well asexperimental studies.
ACKNOWLEDGMENTS
- The authors would acknowledge the financial support from the Saskatchewan Health Research Foundation (SHRF) and the University of Saskatchewan (though a Graduate Scholarship to the first author) to the present study.
References
| [1] | I. Martin, D. Wendt and M.Heberer, "The role of bioreactors in tissue engineering," Trends Biotechnol, vol. 22, pp. 80-6, Feb 2004. |
| [2] | R. Portner, S. Nagel-Heyer, C. Goepfert, P.Adamietz and N.M. Meenen, "Bioreactor design for tissue engineering," Journal of Bioscience and Bioengineering, vol. 100, pp. 235-245, Sep 2005. |
| [3] | M. Cioffi, F. Boschetti, M.T. Raimondi, and G. Dubini, "Modeling evaluation of the fluid-dynamic microenvironment in tissue-engineered constructs: a micro-CT based model," Biotechnology and Bioengineering, vol. 93, pp. 500-510, Feb 20 2006. |
| [4] | I. Martin, B. Obradovic, L.E. Freed, and G. Vunjak-Novakovic, "Method for quantitative analysis of glycosaminoglycan distribution in cultured natural and engineered cartilage," Annals of Biomedical Engineering, vol. 27, pp. 656-662, Sep-Oct 1999. |
| [5] | G. Vunjak-Novakovic, I. Martin, B. Obradovic, S. Treppo, A.J. Grodzinsky, R. Langer, and L.E. Freed, "Bioreactor cultivation conditions modulate the composition and mechanical properties of tissue-engineered cartilage," Journal ofOrthopaedic Research, vol. 17, pp. 130-138, Jan 1999. |
| [6] | F. Boschetti, M.T. Raimondi, F. Migliavacca, and G. Dubini, "Prediction of the micro-fluid dynamic environment imposed to three-dimensional engineered cell systems in bioreactors," Journal ofBiomechnics, vol. 39, pp. 418-425, 2006. |
| [7] | E. M. Bueno, and Gilda A. Barabino., "Wavy-Walled Bioreactor Supports Increased Cell Proliferation and Matrix Deposition in Engineered Cartilage Constructs," tissue engineering, vol. 11, pp.1699-1709 Jan 2006. |
| [8] | B. Bilgen and G.A. Barabino, "Location of scaffolds in bioreactors modulates the hydrodynamic environment experienced by engineered tissues," Biotechnology and Bioengineering, vol. 98, pp. 282-294, Sep 1 2007. |
| [9] | P. Sucosky, D.F. Osorio, J.B. Brown and G.P. Netizel, "Fluid mechanics of a spinner-flask bioreactor," Biotechnology and Bioengineering, vol. 85, pp. 34-46, Jan 5 2004. |
| [10] | R.A. Gutierrez and E.T. Crumpler, "Potential effect of geometry on wall shear stress distribution across scaffold surfaces," Annals of Biomedical Engineering, vol. 36, pp. 77-85, Jan 2008. |
| [11] | M. T. Raimondi, F. Boschetti, L. Falcone, F. Migliavacca, A. Remuzzi and G. Dubini, "The effect of media perfusion on three-dimensional cultures of human chondrocytes: integration of experimental and computational approaches," Biorheology, vol. 41, pp. 401-410, Jul 2004. |
| [12] | F. Maes, P.V. Ransbeeck, H.V. Oosterwyck and P. Vendonck, "Modeling fluid flow through irregular scaffolds for perfusion bioreactors," Biotechnology and Bioengineering, vol. 103, pp. 621-630, Jun 15 2009. |
| [13] | B. Porter, R. Zauel, H. Stockman, R. Guldberg and D. Fyhrie, "3-D computational modeling of media flow through scaffolds in a perfusion bioreactor," Journal of Biomechanics, vol. 38, pp. 543-549, Mar 2005. |
| [14] | F. Galbusera, M. Cioffi, M.T. Raimondi, and R. Pietrabissa, "Computational modeling of combined cell population dynamics and oxygen transport in engineered tissue subject to interstitial perfusion," Computer Methods in Biomechanics and Biomedical Engineering, vol. 10, pp. 279-287, Aug 2007. |
| [15] | M.G. Li, X.Y. Tian and X.B. Chen, "A brief review of dispensing-based rapid prototyping techniques in tissue scaffold fabrication: role of modeling on scaffold properties prediction," Biofabrication, vol. 1, p. 032001, Sep 2009. |
| [16] | M.G. Li, X.Y. Tian and X.B. Chen, "Modeling of Flow Rate, Pore Size, and Porosity for the Dispensing-Based Tissue Scaffolds Fabrication," Journal of Manufacturing Science and Engineering, vol. 131, p.034501, Apr2009. |
| [17] | H. Singh, et al., "Flow modeling in a novel non-perfusion conical bioreactor," BiotechnolBioeng, vol. 97, pp. 1291-9, Aug 1 2007. |
| [18] | H. Singh, et al., "Flow modelling within a scaffold under the influence of uni-axial and bi-axial bioreactor rotation," J Biotechnol, vol. 119, pp. 181-96, Sep 23 2005. |
| [19] | X. B. Chen, M. G. Li, and H. Ke, "Modeling of the Flow Rate in the Dispensing-Based Process for Fabricating Tissue Scaffolds," Journal of Manufacturing Science and Engineering, vol. 130, 2008. |