-
Paper Information
- Next Paper
- Paper Submission
-
Journal Information
- About This Journal
- Editorial Board
- Current Issue
- Archive
- Author Guidelines
- Contact Us
American Journal of Biomedical Engineering
p-ISSN: 2163-1050 e-ISSN: 2163-1077
2011; 1(2): 62-67
doi: 10.5923/j.ajbe.20110102.11
A Preliminary Investigation into the Design of an Implantable Optical Blood Glucose Sensor
 Abstract
 Reference
 Full-Text PDF
 Full-Text HTML
A. Trabelsi 1, M. Boukadoum 1, M. Siaj 2
1Department of Computer Science, Université du Québec à Montréal, Montréal, H2X 3Y7, Canada
2Department of Chemistry, Université du Québec à Montréal, Montréal, H2X 3Y7, Canada
Correspondence to: A. Trabelsi , Department of Computer Science, Université du Québec à Montréal, Montréal, H2X 3Y7, Canada.
| Email: |  |
Copyright © 2012 Scientific & Academic Publishing. All Rights Reserved.
A preliminary investigation into the design of a near-infrared (NIR) optical bio-implant for accurate measurement of blood glucose level is reported. The use of an array of electrically pumped vertical-cavity surface-emitting laser (VCSEL) diodes at specific wavelengths for high-power narrow single-frequency emission leads to a high signal-to-noise ratio in the measured NIR absorption spectrum while maximizing the sensor’s sensitivity to small absorption changes. The emission wavelengths lie within the combination and first-overtone spectral bands known to be dominated by glucose absorption information. A Quantum well infrared (QWI) photodiode transducer senses the received optical power after passing through the blood sample, followed by an artificial neural network (ANN) for the measurement of glucose in a whole blood matrix. For an independent test set made with fresh bovine blood, the optimal ANN topology for processing the two selected spectral bands yielded a standard error of prediction of 0.42 mM (i.e., 7.56 mg/dl) over the glucose level range of 4−20 mM. The empirical results obtained with a prototype mounted on PCB for blood glucose monitoring are closely correlated with the absorption spectra collected on a Vertex 70 Bruker spectrometer.Development of semiconductor light-emitting devices is critical to optical blood glucose sensing using near-infrared absorption spectroscopy. Since glucose absorption spectrum has many features in the combination (2−2.5 µm) and first- overtone (1.54−1.82 µm) spectral bands, sample devices that could emit high-power narrow single-frequency light within these two wavelength ranges are required. Fortunately, InP-based VCSEL structures that could efficiently meet those requirements have recently been developed and shown to have stable emission spectra over a fairly broad wavelength range[5]. In our study, the VCSEL devices will be electrically pumped at wavelengths centered at 1.54, 1.67, 1.73, 2.10, 2.27 and 2.32 µm, respectively; where glucose has specific absorption features and water has relatively higher transmittance. The VCSEL devices are used in a round-robin sequence, from the one emitting at the shortest wavelength to the one emitting at the largest wavelength, until all devices are used.
Keywords: NIR Spectroscopy, Blood Glucose Level, VCSEL, Artificial Neural Network, Optical Bio-Implant
Cite this paper: A. Trabelsi , M. Boukadoum , M. Siaj , "A Preliminary Investigation into the Design of an Implantable Optical Blood Glucose Sensor", American Journal of Biomedical Engineering, Vol. 1 No. 2, 2011, pp. 62-67. doi: 10.5923/j.ajbe.20110102.11.
Article Outline
1. Introduction
- Diabetic patients need to monitor their blood glucose levels several times a day to prevent chronic complications related to the disease. Currently used methods for self- monitoring of blood glucose are invasive, uncomfortable, and usually require frequent finger pricking for withdrawing a drop of blood. Continuous blood glucose monitoring can lead to substantial improvements in blood glucose control. For this purpose, optical methods (i.e., NIR spectroscopy, polarimetry, Raman spectroscopy) for prediction of blood glucose levels may be an advantageous alternative to current biochemical-reaction and conductivity-based techniques. Their desirable features include a painless measurement process and the reduction of discomfort from repeated finger-stick readings.Over the last decade, extensive efforts have been made both in academia and industry to develop optical blood glucose sensors that can perform continuous blood glucose measurements. An implantable optical blood glucose sensor based on NIR absorption spectroscopy was presented in[1]. In this work, the collected absorption spectra were analysed using two multivariate techniques, namely, Partial Least Squares (PLS) and Multiple Linear Regression (MLR).In[2], the authors have proposed an optical sensing system based on a standard CMOS technology and absorption spectroscopy. In experiments using 430 nm and 650 nm light wavelengths, they showed that the detection limits of the suggested optical bio-sensor for glucose, H2O2, and histamine levels were at least one order of magnitude better that those of reported CMOS bio-sensors. In[3], a single 2.3 µm VCSEL structure was used to show the viability of glucose sensing in aqueous solutions, by using absorption spectroscopy and a PLS algorithm. A quantitative determination of glucose levels in whole blood samples using Fourier-transform infrared (FTIR) transmission spectroscopy was presented in[4]. The authors have found that the glucose level was proportional to the difference between the second derivative spectral values at two specific wave numbers (i.e., 1082 cm−1 and 1093 cm−1), suggesting that these two particular wavelengths can be used for direct determination of glucose levels in blood.This paper focuses on the preliminary design guidelines of a novel NIR optical bio-implant for accurate measurement of blood glucose level. To improve the accuracy of the blood glucose predictions, a high signal-to-noise ratio (SNR) in the measured NIR absorption spectrum is required. The use of a VCSEL structure that provides high-power narrow single-frequency emission can fully meet this requirement. To maximize the sensor’s sensitivity to small absorption changes, an array of electrically pumped VCSELs emitting light at specific wavelengths will be used. The emission wavelengths fall within the combination (5000−4000 cm−1) and first-overtone (6500−5500 cm−1) spectral bands known to enclose glucose-specific absorption features. A QWI photodiode transducer operating in the 1.2−2.5 μm range is required for optical power detection. A font-end transimpedance amplifier (TIA) is needed for the photodiode (PD) current. Readings will be transmitted via RF (radio- frequency) telemetry to an ANN-based model for the measurement of glucose level prior to be displayed on a display unit.The paper is structured as follows. The next section presents the preliminary design guidelines of the optical blood glucose sensor implant in a conceptual fashion, giving an overview of the major sensor processing functions. Section 3 discusses the development of the ANN-based glucose calibration model and provides the empirical results with a prototype mounted on PCB for blood glucose monitoring. Conclusions are given in Section 4.
2. Implantable Blood Glucose Sensor
- This section discusses preliminary design guidelines for an optical blood glucose sensor, giving an outline of the main anticipated sensor processing functions. Figure 1 illustrates the building block of the proposed implantable sensor. It consists of a pill-sized implant placed under the skin and an external RF reader and display module for the measured blood glucose level. The implant comprises an array of 6 VCSEL structures current-biased using a light-emitting diode (LED) drive controller, a QWI photodiode transducer, an analog front-end TIA for the PD current, and a CDMA (Code Division Multiple Access) subsystem for noise filtering. Digital-to-analog and analog-to-digital converters interface the CDMA subsystem to the LED drive controller and the TIA, respectively. An ANN-based model for blood glucose predictions is embedded within the RF reader.
2.1. Light Source
2.2. Front-end TIA
- Being the first active building block in the optical bio- sensor, the analog front-end TIA needed to resolve the value of the incoming signal from the sensor, has been a challenge to the sensor designer. Although a number of TIA’s topologies were reported in the literature[6-8], with varying degrees of success, the front-end still imposes unexpected constraints on photodiode use. For instance, the weak output current levels produced by the photodiode require large-area diodes and high-valued gain resistors. These requirements impose a trade-off between spectral response (gain and bandwidth), sensitivity (lower power level for a given signal-to-noise ratio), and overall temporal response (speed). As a result, successful compromises require careful design planning and impose variations on the basic PD front-end TIA[9].
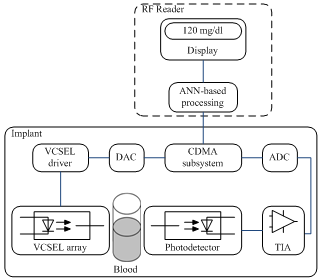 | Figure 1. Building block of the implantable optical blood glucose sensor |
2.3. CDMA Subsystem
- The CDMA subsystem is composed of a transmitter and receiver pair and used as an optical noise filter. This feature is original when considering that CDMA coding is mainly used as a communication channel access method. Moreover, it was shown by the authors in an earlier work[10] that using CDMA coding to drive the light source yields better noise immunity of the optoelectronic front-end than using the more common FDMA-oriented synchronous modulation approach. However, its bandwidth spreading mechanism and use of binary sequences to modulate the source signal complicate the design of the TIA. In this work, the CDMA transmitter will be used to modulate a constant bias signal by spreading its spectrum with 6 Gold pseudo-random sequences before applying it to the light emitting devices in a round-robin sequence, as described above. At the CDMA receiver, the opposite operations from the ones performed at the transmitter will take place.
2.4. Photodiode Transducer
- InGaAs quantum structures grown on InP substrate for near-infrared photodetection were extensively investigated and commercialized in the last decade. Quantum well infrared photodiodes with sensitive wavelength as long as 2.6 μm were manufactured by numerous companies[11]. The optical composite signals after passing through the blood sample are detected by the QWI photodiode transducer which acts as a receiver and converts each optical signal into electric current that is then converted to a voltage by the TIA. Each analog voltage signal is then converted to its digital equivalent by the analog-to-digital converter, and CDMA- demodulated prior to be processed by an ANN-based model for forecasting blood glucose level.
2.5. RF Reader
- The implant under the skin is powered by a current induced in a copper coil by a handheld antenna connected to an external RF reader. Being passive, the implant receives its energy from the outside and is only powered briefly during measurements taken over short intervals for minimum power consumption. When the voltage across a storage capacitor reaches the circuit operating voltage, the implant powers up and starts collecting data, which is stored and subsequently processed. Then, it sends the corresponding readings to the RF reader. The whole measurement/transmission process is expected to last 2 seconds at a time. The RF reader controls the acquisition and processing of telemetry data and feeds the measurement results to a display unit. The operational frequency of the RF reader should determine the optimal size, shape and geometry for the antenna and the coil[12].
2.6. ANN-based Model
- Due to the non-linear spectral relationship between the NIR blood absorbances and glucose levels, a nonlinear multivariate technique is required for quantitative analysis of blood. Numerous multivariate analysis techniques (i.e., PLS, PCR (Principal Component Regression), MLR, ANN) were suggested in the literature[13-15]. Among these approaches, ANN-based models, such as the multi-layer perceptron (MLP), were shown to produce better results, compared with linear regression methods (i.e., PLS), in terms of prediction capabilities of analyte concentrations. In our study, the development of the ANN-based glucose calibration model over the combination and first-overtone spectral bands is performed by generating a dataset from bovine blood samples as described in the following section.
3. Experimental Arrangement and Preliminary Results
3.1. Experimental Setup
- 40 ml of bovine blood were divided into eight aliquots, collected into 10 ml sodium heparin tubes to prevent coagulation and stored in a refrigerator at a 4℃ until needed. The bovine blood solutions were prepared in the following fashion. A 5-mL aliquot of blood was kept for 30 min at room temperature (23℃). Then, a small sample of this warmed blood was analysed to determine the base glucose level using a Nova Biomedical STP CCX analyzer. Base glucose values for the eight aliquots of blood were in the range of 4−5 mM. For each data acquisition experiment, a part of the remaining blood from each aliquot was flushed through the sample cell by using a syringe (1-mL). The sample cell was a demountable liquid transmission cell (model SL-3 cell, Cristal Laboratories) with CaF2 windows and a 400 µL sample volume. After each data acquisition experiment, the sample cell was cleaned with 50-mL of de-ionized water in the reverse direction. A Vertex 70 Bruker spectrometer was used for spectral sensing in the combination (5000−4000 cm−1) and first-overtone (6500− 5500 cm−1) spectral bands. The Bruker spectrometer was equipped with a KBr-broadband beam-splitter and a liquid nitrogen-cooled mercury-cadmium telluride (LN-MCT Narrow) detector.Blood glucose levels (BGLs) within the 4-20 mM range were targeted in this study. After the collection of twenty single-beam spectra from one of the unaltered aliquots of blood, a fixed amount of dried solid glucose was added to one of the remaining aliquots of blood to produce another sample. As this altered blood sample flushed through the sample cell, twenty new single-beam spectra were then taken. This procedure was repeated until seven successive glucose additions were completed and their corresponding spectra were acquired. For the 8 aliquots of blood, a total of 160 single-beam spectra were collected. For all FTIR spectra, Fourier processing with Blackman-Harris 3-Term apodization, Mertz phase correction, 4 cm−1 resolution, and a zero-filling factor of two was performed with the OPUS software available for the Bruker spectrometer.
3.2. Glucose Calibration Model
- Figure 2 presents a series of single-beam spectra collected from blood samples with different BGLs. It can be seen from this figure that step increase in glucose level gave rise to higher light absorption (i.e., lower transmission of light) through the blood. The FTIR spectra were analysed in terms of their correlation with their respective BGLs, using the feed-forward back-propagation neural network (FFBNN), from the Matlab neural network toolbox. The latter was trained using the Trainlm function that updates weight and bias values according to Levenberg-Marquardt optimization. The maximum number of epochs, the performance goal, the minimum performance gradient and the initial learning rate value were set to 102, 10-10, 10-10 and 10-3, respectively. The connection weights between neurons and layers were adjusted to minimize the mean squared error (MSE) between the computed and the desired output values (MSE = 0 if a true solution existed).
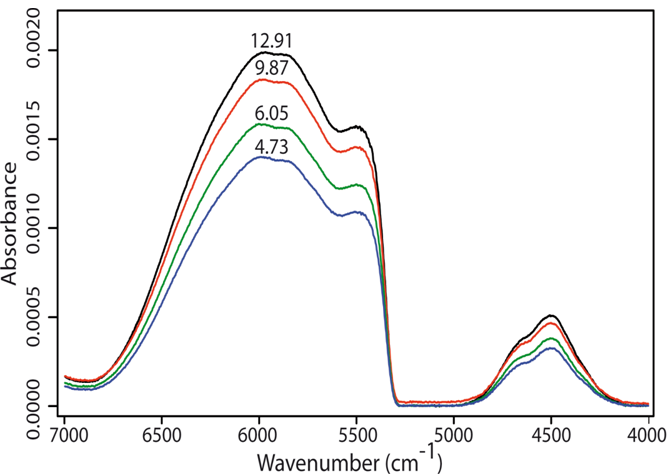 | Figure 2. Single-beam spectra from blood samples with different BGLs, from bottom to top: 4.73, 6.05, 9.87 and 12.91 mM, respectively, over the combination and the first overtone spectral bands |
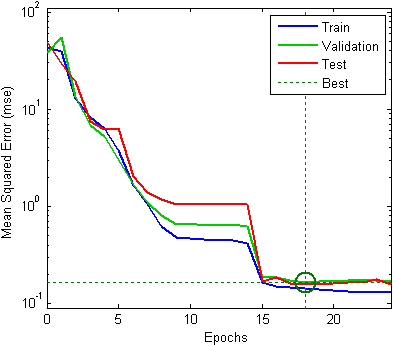 | Figure 3. Classification performance of the FFBNN |
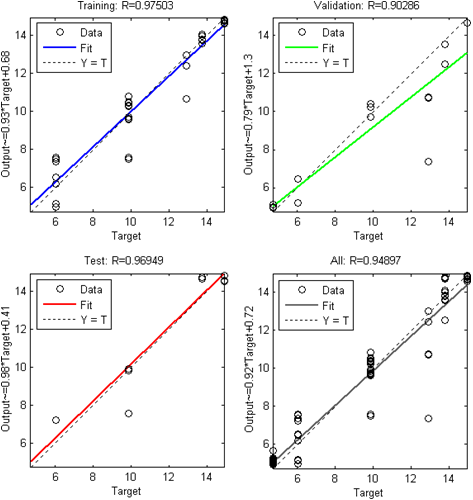 | Figure 4. Linear regression be.tween the FFBNN outputs and the corresponding targets for the Levenberg-Marquardt algorithm |
3.3. Prototype Test Results
- An experimental prototype, built from commercial off- the-shelf components and mounted on PCB, was used as a starting circuit in this work to evaluate the potential of the implantable sensor in capturing data before transmitting it to the monitoring site. It was made up of an array of 6 infrared diodes current-biased using a LED drive controller, a photodiode transducer, and an analog front-end TIA for the PD current. Its simplified schematic is depicted in Figure 5. The infrared diodes (from MicroSensor, ir.microsensortech.com) emitted light at wavelengths centered at 1.54, 1.67, 1.73, 2.10, 2.27 and 2.32 µm, respectively. The photodiode PD24- 05 from MicroSensor, with InGaAsSb/AlGaAsSb structures, was used to convert light into electric current. The basic shunt-feedback configuration was employed as an analog front-end TIA. It was made up of the OPA657U from Texas Instruments, in non-inverting mode with added voltage gain and PD bootstrapping to remove the signal swing from the PD. The component values used in the measurements are summarized in Table 2.
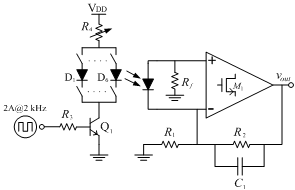 | Figure 5. Schematic of the experimental prototype mounted on PCB |
|
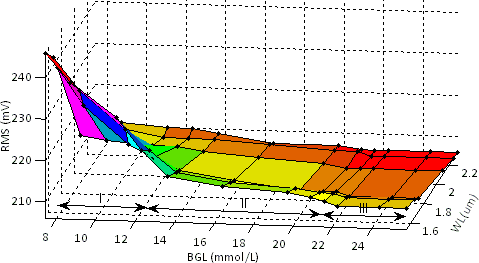 | Figure 6. RMS output voltage as a function of BGL for different wavelengths |
4. Conclusions
- Preliminary design guidelines into the design of a blood glucose optical bio-implant based on NIR absorption spectroscopy for accurate measurement of blood glucose level are presented. The two important tasks performed by our optical bio-sensor during this preliminary phase of the project, were the collection of blood absorption spectra and the development of the ANN-based glucose calibration model over the combination and first-overtone spectral bands. These tasks were accomplished by generating a dataset from bovine blood samples. Although the obtained results are promising, the network performance could most likely be improved if input data patterns could be extended to include measurements of the energy, the first and second derivatives of the collected spectra. This research issue is currently being explored by the authors. The empirical results obtained with a prototype mounted on PCB for blood glucose monitoring were thus consistent with these preliminary results.As was mentioned before, glucose exhibits several absorption bands in both the combination and the first-overtone spectral bands. Combination and overtone absorptions are mainly seen for C−H and O−H groups of glucose molecule [16]. In the NIR region, the absorption features of many blood components other than glucose (water, hemoglobin, proteins, etc.) are concentration dependent and are in similar or higher concentrations than glucose. For instance, the high concentration of water in blood with the relatively strong absorption of O−H groups result in large water absorbance bands. This gives rise to overlapping absorption features of glucose with those of other blood components. Therefore, measurement of blood glucose levels in several spectral bands rather than at one or few wavelengths is highly desired. One of the main challenges for implantable biomedical devices is to develop adequate energy sources of reasonable size and long life. This imposes rigorous power requirements on an implant with an inductive RF power link, due to the low power efficiency of 1% or less associated with the size constraints of the implant. Fortunately, technologies that convert the body's natural thermal energy and chemical gradients into electrical power are in development and would be a promising alternative to inductive power links for these devices[17]. Moreover, laying the ANN-based processing unit outside the patient’s body (i.e., on the RF Reader) will be expected to lead to lower power consumption. Finally, efforts are currently under way to explore the resources needed for successful implementation of the optical sensor on silicon. We also plan to investigate the possible benefits in terms of improved system performance of an increase in the number of VCSELs within the array.
ACKNOWLEDGEMENTS
- This work was financed by grants from FQRNT (Quebec), NSERC (Canada) and RESMIQ (Quebec). The authors wish to thank A. Mateescu (Université du Québec à Montréal) and C. Pellerin (Université de Montréal) for their contribution to this project and many fruitful discussions. We also thank J. F. Brodeur and M. Guay (Faculté de medicine vétérinaire de l’Université de Montréal) for assistance in bovine blood glucose sampling.
References
| [1] | Y. Yu et al., “Laser diode applications in a continuous blood glucose sensor,” Proceedings of the Society of Photo-optical Instrumentation Engineers (SPIE), vol. 4996, pp. 268–274, 2003 |
| [2] | Y.-W. Chang et al., “A high-sensitivity CMOS-compatible biosensing system based on absorption photometry,” IEEE Sensors Journal, vol. 9, no. 2, pp.120−127, 2009 |
| [3] | S. T. Fard et al., “Optical absorption glucose measurements using 2.3 μm vertical-cavity semiconductor lasers,” IEEE Photonics Technology Letters, vol. 20, no. 11, pp. 930−932, 2008 |
| [4] | Y. Shen et al., “Determination of glucose concentration in whole blood using Fourier-transform infrared spectroscopy,” Journal of Biological Physics, vol. 29, pp. 129–133, 2003 |
| [5] | G. Boehm et al., “Growth of InAscontaining quantum wells for InP-based VCSELs emitting at 2.3 µm,” J. Crystal Growth, pp. 301–302 and 941–944, 2007 |
| [6] | F. Yuan, “Low-voltage CMOS current-mode preamplifier: analysis and design," IEEE Trans. on Circuits and Systems I, vol. 53, no. 1, pp.26−39, 2006 |
| [7] | P. Wright et al., "Design of high-performance photodiode receivers for optical tomography," IEEE Sensors J., vol. 5, no. 2, pp.281−288, 2005 |
| [8] | D. W. Cooley and D. R. Andersen, “A low power 100MΩ CMOS front-end transimpedance amplifier for biosensing applications,” 53rd IEEE Int. Midwest. Symp. On Circuits and Systems (MWSCAS), pp.541−544, Aug. 2010 |
| [9] | Graeme, J., Photodiode amplifiers – op amp solutions, McGraw Hill, New York, 1995 |
| [10] | A. Trabelsi et al., “FPGA-based multispectral fluorometer using CMDA and embedded neural network,” Proc. 21th Int. Conf. on Microelectronics, Marrakech (), pp.199−202, Dec. 2009 |
| [11] | J. Wei et al., “Gas source molecular beam epitaxy grown InGaAs(P)N−InP long-wavelength (λ > 1.65 µm) photodetectors using a solid arsenic source,” IEEE Photonics Technology Letters, vol. 13, no. 4, pp. 352−354, 2001 |
| [12] | P. V. Nikitin and K. V. S. Rao, “Helical antenna for handheld UHF RFID reader,” IEEE Int. Conf. on RFID, Orlando (FL), pp. 166–173, 2010 |
| [13] | H. Yang et al., “Comparison of partial least squares regression and multi-layer neural networks for quantification of nonlinear systems and application to gas phase Fourier transform infrared spectra,” Anal. Chim. Acta, 489 (2), pp. 125–136, 2003 |
| [14] | P. Bhandare et al., “Multivariate determination of glucose in whole blood using partial least-squares and artificial neural networks based on mid-infrared spectroscopy,” Applied Spectroscopy, vol. 47, no. 8, pp. 1214–1221, 1993 |
| [15] | T. J. McAvoy et al., “A comparison of neural networks and partial least squares for deconvoluting fluorescence spectra,” Bioengineering and Biotechnology, vol. 40, pp. 53–62, 1992 |
| [16] | M. Golic et al., “Short-wavelength near-infrared spectra of sucrose, glucose, and fructose with respect to sugar concentration and temperature,” Applied Spectroscopy, vol. 57, no. 2, pp. 139–145, 2003 |
| [17] | J. A. Paradise and T. Starner, “Energy scavenging for mobile and wireless electronics,” IEEE Pervasive Computing Journal, vol. 4, no. 1, pp.18−27, 2005 |