-
Paper Information
- Paper Submission
-
Journal Information
- About This Journal
- Editorial Board
- Current Issue
- Archive
- Author Guidelines
- Contact Us
American Journal of Biochemistry
p-ISSN: 2163-3010 e-ISSN: 2163-3029
2026; 16(1): 1-5
doi:10.5923/j.ajb.20261601.01
Received: Jan. 4, 2026; Accepted: Jan. 23, 2026; Published: Jan. 28, 2026

Insulin Resistance Assessed by the HOMA-IR Index in Patients with Type 2 Diabetes
 Abstract
 Reference
 Full-Text PDF
 Full-text HTML
Niokhor Ndane Diouf1, Maimouna Touré2, Ousseynou Boye3, Moustapha Djité4, Najah Fatou Coly5, Soumah IY6, Samba A.6, Souleymane Thiam6, Arame Ndiaye6, Fatou Cissé6, Fatou Diallo6, Maguette Sylla-Niang3, Alassane Diatta1
1Department of Biology and Functional Explorations, Assane Seck University of Ziguinchor, Senegal
2Physiology Laboratory of the Cheikh Anta Diop University of Dakar, Senegal
3Medical Biology Laboratory Idrissa Pouye General Hospital of Dakar, Senegal
4Pharmaceutical Biochemistry Laboratory, Cheikh Anta Diop University of Dakar, Senegal
5Biochemistry Laboratory of Iba Der Thiam University of Thies, Senegal
6Medical Biochemistry Laboratory of Cheikh Anta Diop University Of Dakar, Senegal
Correspondence to: Niokhor Ndane Diouf, Department of Biology and Functional Explorations, Assane Seck University of Ziguinchor, Senegal.
| Email: |  |
Copyright © 2026 The Author(s). Published by Scientific & Academic Publishing.
This work is licensed under the Creative Commons Attribution International License (CC BY).
http://creativecommons.org/licenses/by/4.0/

Type 2 diabetes is a chronic metabolic disease characterized by hyperglycemia resulting from insulin resistance and/or impaired insulin secretion. Insulin resistance plays a central role in the pathophysiology of this disease and its cardiovascular and metabolic complications. The HOMA-IR index is a simple and widely used tool for assessing insulin resistance based on fasting glucose and insulin levels. This study aimed to evaluate insulin resistance in patients with type 2 diabetes in Senegal using the HOMA-IR index. A descriptive and analytical cross-sectional study was conducted at the Medical Biology Laboratory of Idrissa Pouye General Hospital in Dakar, including 95 adult patients with type 2 diabetes. Anthropometric parameters (BMI, waist-to-hip ratio) and biological parameters (fasting plasma glucose, HbA1c, insulin levels, lipid profile) were collected. HOMA-IR was calculated using the standard formula, with a cutoff for insulin resistance set at >2.5. Statistical analyses were performed using R version 4.3.1. The mean age was 54.9 ± 9.2 years, with a predominance of women (68%). The mean BMI was 26.8 ± 4.8 kg/m². The mean HOMA-IR value was 4.4 ± 5.1, with 68% of patients exhibiting insulin resistance. Insulin resistance was associated with higher fasting plasma glucose (1.92 ± 0.92 vs 1.28 ± 0.41 g/L; p < 0.001), higher HbA1c levels (9.1 ± 3.1 vs 7.0 ± 6.3%; p = 0.02), and hypertriglyceridemia (0.98 ± 0.48 vs 0.76 ± 0.35 g/L; p = 0.03). No significant association was found with BMI or waist-to-hip ratio. Insulin resistance is common in patients with type 2 diabetes and is closely associated with glycemic and lipid abnormalities. The HOMA-IR index is a simple and useful tool for metabolic risk stratification and optimization of therapeutic management, particularly in resource-limited settings.
Keywords: Type 2 diabetes, Insulin resistance, HOMA-IR index
Cite this paper: Niokhor Ndane Diouf, Maimouna Touré, Ousseynou Boye, Moustapha Djité, Najah Fatou Coly, Soumah IY, Samba A., Souleymane Thiam, Arame Ndiaye, Fatou Cissé, Fatou Diallo, Maguette Sylla-Niang, Alassane Diatta, Insulin Resistance Assessed by the HOMA-IR Index in Patients with Type 2 Diabetes, American Journal of Biochemistry, Vol. 16 No. 1, 2026, pp. 1-5. doi: 10.5923/j.ajb.20261601.01.
Article Outline
1. Introduction
- Type 2 diabetes is a chronic metabolic disease characterized by hyperglycemia resulting primarily from insulin resistance and/or impaired insulin secretion [1]. Insulin resistance plays a central role in the pathophysiology of this disease and its metabolic and cardiovascular complications [2]. The HOMA-IR index (Homeostasis Model Assessment of Insulin Resistance) is a simple, noninvasive, and widely used tool for estimating insulin resistance based on fasting serum glucose and insulin concentrations. Its use in patients with type 2 diabetes allows for a better understanding of the metabolic profile and may contribute to optimizing therapeutic management [3,4]. However, despite the high prevalence of type 2 diabetes, insulin resistance is not routinely assessed in clinical practice. In this context, the use of HOMA-IR could provide valuable information on the degree of insulin resistance and its association with clinical and biological parameters in patients with type 2 diabetes [5,6]. Therefore, the objective of the present study was to evaluate insulin resistance using the HOMA-IR index in patients with type 2 diabetes.
2. Materials and Methods
- A descriptive and analytical cross-sectional study was conducted over a six-month period at the Medical Biology Laboratory of Idrissa Pouye General Hospital in Dakar, Senegal. The study population consisted of 95 adult patients with type 2 diabetes. Patients aged 18 years or older, regularly followed at the laboratory, and who provided informed consent to participate in the study were included. Patients with type 1 diabetes, pregnant women, patients with type 2 diabetes receiving exogenous insulin therapy, and patients with conditions likely to affect insulin sensitivity were excluded.The selected patients were matched by age and sex, and the duration of diabetes was recorded. Anthropometric measurements (height and weight) were performed to calculate body mass index (BMI). Waist and hip circumferences were measured, and the waist-to-hip ratio was calculated. The biological parameters analyzed included fasting plasma glucose, glycated hemoglobin (HbA1c), fasting insulin levels, and lipid profile. Insulin resistance was assessed using the HOMA-IR index, calculated according to the following formula:HOMA-IR = (fasting insulin [µIU/mL] × fasting plasma glucose [g/L]) / 4.05 [7].A HOMA-IR value greater than 2.5 was considered indicative of insulin resistance.Data entry was performed using Microsoft Excel 2016, and statistical analysis was carried out using R software (version 4.3.1). Results were expressed as mean ± standard deviation. Comparisons between two means were performed using Student’s t test. Comparison of mean HOMA-IR values across different BMI categories was performed using one-way analysis of variance (ANOVA). A difference was considered statistically significant when p < 0.05.
3. Results
3.1. General Characteristics of the Study Population
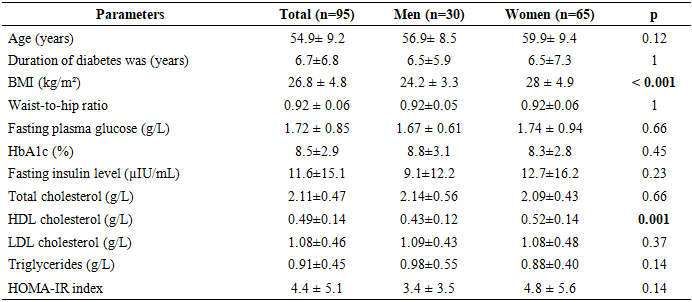
- A total of 95 patients with type 2 diabetes were included in the study. The mean age was 54.9 ± 9.2 years, with a predominance of women (65 women, representing 68.4%). The mean duration of diabetes was 6.7 ± 6.8 years. The mean body mass index (BMI) was 26.8 ± 4.8 kg/m² and was significantly higher in women than in men (28.0 ± 4.9 vs 24.2 ± 3.3 kg/m²; p < 0.001).Regarding the metabolic profile, the mean fasting plasma glucose was 1.72 ± 0.85 g/L and the mean HbA1c was 8.5 ± 2.9%. Women had significantly higher HDL cholesterol levels than men (0.52 ± 0.14 vs 0.43 ± 0.12 g/L; p = 0.001). No significant sex-related differences were observed for the other biological parameters or for the HOMA-IR index (Table 1).
|
3.2. Mean HOMA-IR Value and Prevalence of Insulin Resistance
- The mean HOMA-IR value in the overall study population was 4.4 ± 5.1.According to the HOMA-IR cutoff values, 65 patients (68%) exhibited insulin resistance, whereas 30 patients (32%) had normal insulin sensitivity (Figure 1).
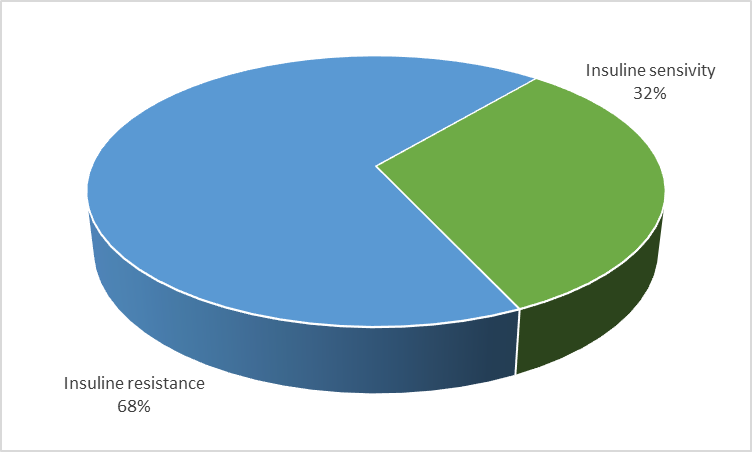 | Figure 1. Distribution of patients according to insulin sensitivity |
3.3. Association between HOMA-IR and Clinical Parameters
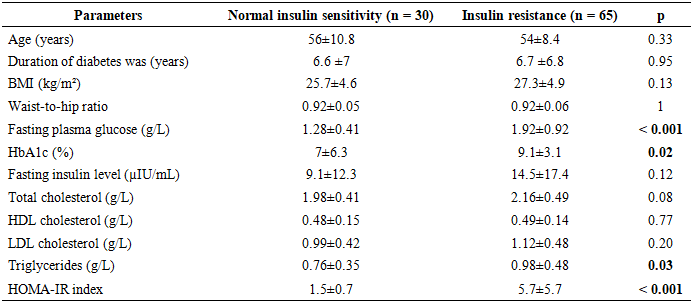
- Association between HOMA-IR and clinical parameters.The comparison of clinical characteristics according to insulin sensitivity status showed no significant differences in age, duration of diabetes, BMI, or waist-to-hip ratio (Table 2).
|
|
3.4. Relationship between HOMA-IR and Biological Parameters
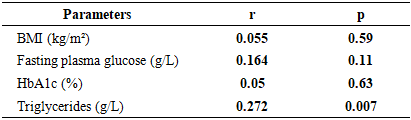
- Patients with insulin resistance had significantly higher fasting plasma glucose (1.92 ± 0.92 vs 1.28 ± 0.41 g/L; p < 0.001), HbA1c (9.1 ± 3.1 vs 7.0 ± 6.3%; p = 0.02), and triglyceride levels (0.98 ± 0.48 vs 0.76 ± 0.35 g/L; p = 0.03) compared to patients with normal insulin sensitivity (Table 2).Correlation analysis showed a positive and significant association between HOMA-IR and triglycerides (r = 0.27; p = 0.007). In contrast, no significant correlation was observed between HOMA-IR and fasting plasma glucose or HbA1c (Table 4).
|
4. Discussion
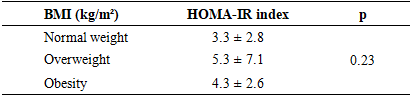
- The present study highlights a high prevalence of insulin resistance among patients with type 2 diabetes, assessed using the HOMA-IR index, with nearly 68% of subjects exhibiting values above the threshold of 2.5. This finding confirms the central role of insulin resistance in the pathophysiology of type 2 diabetes, as widely described in the literature [8,9]. The HOMA-IR index therefore appears to be a relevant and accessible tool for characterizing the metabolic profile of diabetic patients, even in resource-limited settings such as Senegal. The mean HOMA-IR value observed in our study (4.4 ± 5.1) is comparable to those reported in other African and international populations. Studies conducted in Morocco, Tunisia, and sub-Saharan Africa have reported mean HOMA-IR values ranging from 3.5 to 5.5 in insulin-naïve diabetic patients, reflecting marked insulin resistance in these populations [10,11]. Similarly, recent studies from Asia and Europe confirm that the majority of patients with type 2 diabetes exhibit significant insulin resistance, regardless of sex [12,13]. In our study, no significant difference in HOMA-IR values was observed between men and women, despite a significantly higher BMI among women. This finding is consistent with several recent studies suggesting that, in patients with type 2 diabetes, insulin resistance is more strongly influenced by metabolic, inflammatory, and epigenetic factors than by sex itself [14]. However, some studies have reported more pronounced insulin resistance in postmenopausal women, likely related to hormonal changes, redistribution of visceral fat mass, and mechanisms of cellular senescence [15,16].In this context, recent data highlight the role of so-called “anti-aging” genes and epigenetic regulators, particularly sirtuin 1 (SIRT1), in the regulation of insulin sensitivity, energy homeostasis, and cell survival. Reduced expression or activity of SIRT1 has been associated with impaired insulin signaling, increased chronic low-grade inflammation, as well as cellular senescence and apoptosis key mechanisms in the pathophysiology of type 2 diabetes and its complications [17,18,19]. These processes may partly explain the heterogeneity of results observed across different populations according to sex and age.The absence of a significant association between HOMA-IR and anthropometric parameters, particularly BMI and waist-to-hip ratio, represents a noteworthy finding of this study. Although obesity is classically associated with insulin resistance, several recent studies have shown that, in patients with type 2 diabetes, this relationship may be attenuated by disease duration, β-cell dysfunction, and metabolic adaptations secondary to chronic hyperglycemia [20,21]. Moreover, BMI does not distinguish between fat mass and lean mass, nor does it accurately assess visceral adiposity, which is more closely associated with insulin resistance. Metabolic alterations related to non-alcoholic fatty liver disease (NAFLD), frequently associated with type 2 diabetes, may also play a central role in this dissociation [22].In contrast, insulin-resistant patients exhibited significantly higher levels of fasting plasma glucose, HbA1c, and triglycerides. These findings are consistent with numerous studies demonstrating that insulin resistance directly contributes to poor glycemic control and lipid abnormalities observed in type 2 diabetes [23]. Elevated fasting plasma glucose reflects increased hepatic glucose production, a direct consequence of hepatic insulin resistance. The significant association between the HOMA-IR index and triglyceride levels observed in this study deserves particular attention. Hypertriglyceridemia is considered an indirect marker of insulin resistance, related to increased free fatty acid flux to the liver and impaired insulin action at both hepatic and muscular levels [24,25]. These metabolic disturbances are also influenced by epigenetic and nutritional mechanisms, further reinforcing the link between insulin resistance, dyslipidemia, and overall cardiometabolic risk [19,22].Finally, the lack of a significant correlation between HOMA-IR and HbA1c observed in this study has also been reported by other authors. HbA1c reflects long-term glycemic control, whereas HOMA-IR assesses insulin resistance at a specific point in time. In patients with long-standing type 2 diabetes, chronic hyperglycemia is more often related to impaired insulin secretion secondary to β-cell exhaustion and cellular senescence processes than to insulin resistance alone [26].
5. Conclusions
- The results of this study confirm the high prevalence of insulin resistance among patients with type 2 diabetes and its close association with glycemic and lipid parameters. This study provides original data in a poorly documented African context and highlights the value of HOMA-IR as a simple and accessible tool for assessing insulin resistance. Integrating HOMA-IR into clinical evaluation could contribute to improved metabolic risk stratification and optimization of therapeutic strategies, particularly in resource-limited countries.
ACKNOWLEDGEMENTS
- We thank all the staff of the medical biology laboratory of the Idrissa Pouye General Hospital and that of the bio-chemistry laboratory of the Aristide Ledantec Hospital for their material support. We also thank all patients who agreed to participate in the study.
CONFLICTS OF INTEREST
- The authors declare that they have no conflict of interest in relation to this article.