-
Paper Information
- Paper Submission
-
Journal Information
- About This Journal
- Editorial Board
- Current Issue
- Archive
- Author Guidelines
- Contact Us
American Journal of Biochemistry
p-ISSN: 2163-3010 e-ISSN: 2163-3029
2025; 15(1): 15-23
doi:10.5923/j.ajb.20251501.03
Received: Mar. 24, 2025; Accepted: Apr. 25, 2025; Published: May 8, 2025

pH and Electrolyte Impact on the Secondary Structure Conformations of Amyloid Beta42
 Abstract
 Reference
 Full-Text PDF
 Full-text HTML
Subhajit Dasgupta 1, 2, Mausumi Bandyopadhyay 1, 2, 3, 4, Kumar Sambamurti 5
1Regenerative Neuro Immune Research Institute of South Carolina, Charleston, South Carolina
2NeuroDrug Research LLC., Charleston, South Carolina
3Biology, Trident Technical College, Charleston, South Carolina
4Biology, College of Charleston, South Carolina
5Department of Neurosciences, Medical University of South Carolina, Charleston, SC
Correspondence to: Subhajit Dasgupta , Regenerative Neuro Immune Research Institute of South Carolina, Charleston, South Carolina.
| Email: |  |
Copyright © 2012 Scientific & Academic Publishing. All Rights Reserved.
This work is licensed under the Creative Commons Attribution International License (CC BY).
http://creativecommons.org/licenses/by/4.0/

Amyloid beta42 (Aβ42) is a 4.5 kDa truncated protein from its transmembrane precursor. It is not clear if changes of pH or altered potassium and sodium ions exert an impact on release of Aβ42 from plasma membrane and promote aggregation with altered structural conformation during Alzheimer’s Disease. The computer guided experiments by using Preddimer software demonstrate interaction between Aβ42 peptide at pH5, 7 and 8 generates different structural forms with variable dimer Packing value (DPV) and hydrophobicity. The Abeta42_1-21 generated stable dimeric structures with lower DPV and higher hydrophobicity. The Abeta42_22- 42 demonstrates maximum three compatible structures to generate stable dimeric forms with higher DPV and relatively lower hydrophobicity value. The aggregation kinetics demonstrate significant difference (2-folds increase) (p<0.05) in thioflavin (THT)-relative fluorescence unit (RFU) at pH5.5 than at pH7.4 (1.2- folds), pH8.5 (1.3-folds) as compared in between the pH groups and buffer control. The increasing potassium chloride (KCl) concentration from 5-100 mM shows moderate increase in THT-RFU (2.1-2.3 folds) with Aβ42 aggregation from 30 minutes till 2460 minutes at pH5.5. The presence of 0.1M NaCl in addition to 0.1M KCl in the reaction mixtures demonstrates an overall increase in Abeta42 aggregation (1.5- 2.1) (p<0.05). The circular dichroism (CD) polarimeter demonstrates 0.98% alpha helix, 46.3% beta strand and 53% random coil or irregular structures at 0 hour, pH5.5. More beta-strands and random coils are found with the CD results for 24-48 hours. The presence of KCl, NaCl in the reaction mixture demonstrates marginal increase in alpha helix conformation of Aβ42 aggregates at pH5.5 along with beta-strand structures.
Keywords: Amyloid beta42, Protein structure, Electrolyte, Aggregation
Cite this paper: Subhajit Dasgupta , Mausumi Bandyopadhyay , Kumar Sambamurti , pH and Electrolyte Impact on the Secondary Structure Conformations of Amyloid Beta42, American Journal of Biochemistry, Vol. 15 No. 1, 2025, pp. 15-23. doi: 10.5923/j.ajb.20251501.03.
Article Outline
1. Introduction
- Amyloid beta 42 (Aβ42) is a 4.5 kDa truncated peptide derived from its precursor protein by the aspartyl protease enzyme Gamma Secretase. The peptide is generated from the C-terminal site of amyloid precursor protein (APP) [1-3]. The amphiphilic Aβ42 peptide (42 amino acid residue) is embedded within plasma membrane of neurons in human brain. The deposition of Aβ42 in brain is critical pathology as it forms senile plaques and initiates cognitive impairment leading to dementia in long run. Not only, the amyloid inclusion bodies are found in Parkinson’s Disease (PD) and Kreutz-Feld Jacob Disease (KJD)- prion (PrPsc) brain [4-6]. Recent investigations also suggest the role of amyloid protein in aging process of non-Alzheimer’s normal brain [7-9]. The structural analysis of amyloids demonstrated formation of altered secondary structures either as soluble or plasma membrane bound forms including oligomers in AD brain [10-12]. The possibility is that the amyloid precursor protein (APP) is synthesized throughout life as monomer. However, release of the Aβ42 from membrane results in extracellular deposition as at least dimeric and later as polymeric structures. It is unclear yet if pH alteration or excess salts, potassium chloride and sodium chloride influence release of Aβ42 from membrane and facilitate aggregation to polymeric structures during AD.Shea et al. [13] demonstrated the presence of non-stranded alpha-sheet secondary conformation in soluble amyloid beta oligomer as toxic component at its early lag phase of aggregation than late beta sheet conformation. In presence of lipids, aggregation of amyloid beta (1-42) (in reaction mixture) to fibrils and oligomers has been found much faster at pH7.4 in vitro [14]. Different laboratories suggested that alteration of secondary conformations of amyloid beta at pH 5 are found causing fibrillation and tetramerization of hydrophobic fragments [15] [16] [17]. Wang et al. [18] demonstrated the presence of electrostatic as well as hydrophobic interactions within the self-assembled monolayers facilitate aggregation of amyloid beta on cell membrane. The impact of micelle formation at the monomer level has been reported to facilitate oligomerization and fibril formation with elongation of amyloid beta (Aβ42 and 40 including Aβ39-43 residue fragments) [19].The computer guided experiments on the ability between Aβ42 peptides for homodimers demonstrate overall low dimer packing quality (FSCOR ≤ 2.0) indicating the closest structures are packed together to the weak homodimer forms. The cell free reaction mixtures demonstrate an increase in relative fluorescence unit (RFU) of THT incorporation in Aβ42 with time corresponds to the increase in pH and salt concentration in the reaction mixture.We herein demonstrate that different pH ranges from acidic and alkaline conditions with presence of excess salts- sodium and potassium chloride, facilitate Amyloid beta42 aggregation in a time dependent manner and alter secondary structure conformation in cell free reaction mixture containing potassium phosphate buffer.
2. Materials and Methods
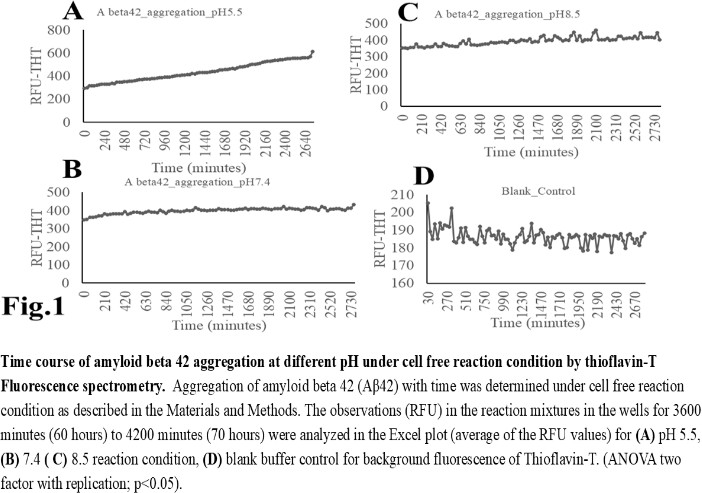
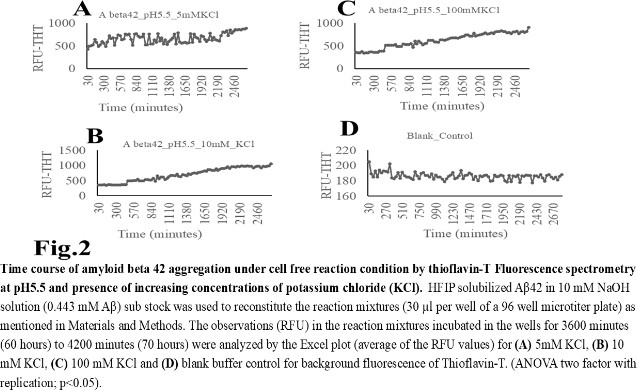
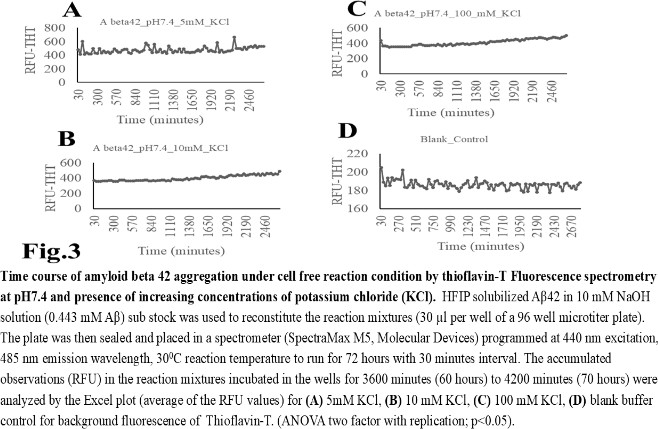
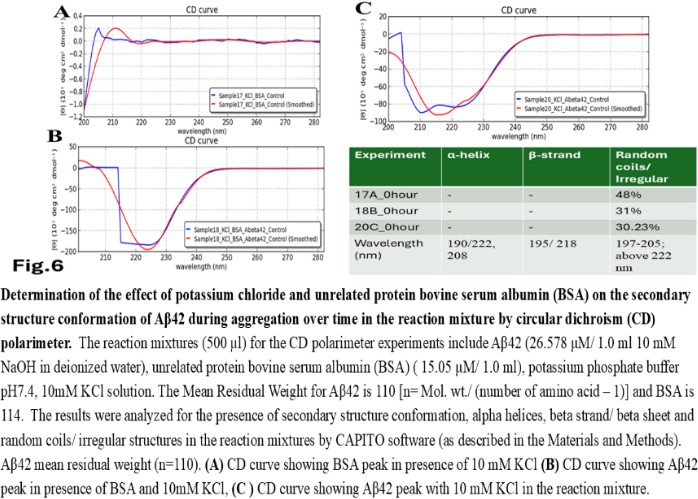
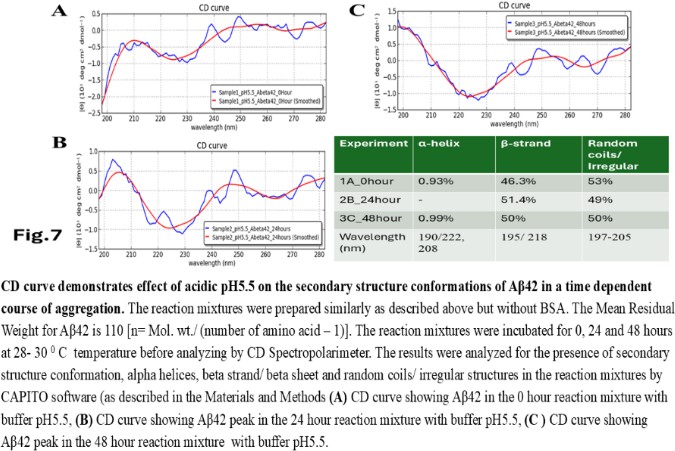
- Reagents. Amyloid beta (Aβ42 20 mg) was purchased from ERI Amyloid Laboratory LLC. (USA) (Dr. James I. Elliott, Ph.D and Margaret M. Elliott, M.S.). Potassium dihydrogen phosphate (KH2PO4) and dipotassium hydrogen phosphate (K2HPO4) were purchased from Fisher Scientific, (USA); Thioflavin-T was purchased from Merck (USA).Analysis of Amyloid beta42 (Aβ42) sequences to form dimeric complex by computer modeling. The ability of Amyloid beta42 amino acid sequences to form dimeric complex were examined by using Preddimer software [20] [21]. The Dimer Packing Quality values (index of stable dimeric structure of alpha helix conformation) (FSCOR) were determined from the amino acid sequences using the software automated calculation mode including angle of torsions and number of molecules to form stable dimers. The hydrophobicity (Kcal/mol) and isoelectric pH point (Ip) with net charges of the Amyloid beta amino acid sequences were determined by PepDraw peptide sequence analysis software.Amyloid beta42 (Aβ42) suspension. The Aβ42 peptide was dissolved (15 µl/vial) in Hexafluoro isopropanol (HFIP) (Sigma Aldrich, US), air dried and preserved in aliquots (2 mg/ vial) in low binding tubes at -20°C. The working samples were prepared following reconstitution of peptides in 1.0 ml 10 mM NaOH solution in deionized water at room temperature followed by brief sonication (10 minutes per sample on ice with 1 minute burst). The stock Aβ42 suspension (2mg/ml of 10mM NaOH 1.0 ml solution, 446.06 mM) was aliquoted (15 µl/ vial) in low binding tubes and stored at -20°C until use.Potassium phosphate buffer and salts, potassium, and sodium chloride stock solutions. The stock potassium phosphate buffer was prepared from 1M each of K2HPO4 and KH2PO4 buffer stock solutions in deionized water. The sub stock 0.1M buffer was prepared by proportionate mixing of 8.5 ml 1M K2HPO4 solution with 91.5 ml KH2PO4 solution for pH5.8; 80.2 ml K2HPO4 solution with 19.8 ml KH2PO4 solution for pH7.4; 94.0 ml K2HPO4 solution with 6.0 ml KH2PO4 solution for pH8.0. The 10M stock solutions of potassium chloride (KCl) and sodium chloride (NaCl) in deionized water were prepared as excess salt sources. The buffer and salt solutions were stored at room temperature, 25°C.Preparation of reaction mixture. The reaction mixtures were prepared separately by using 0.1 M potassium phosphate buffer (pH 5.8, 7.4, 8.0) and 1M sodium chloride (NaCl), 1M potassium chloride (KCl) working solutions. Aβ42 (60 µg/500 µl: 26.58 µM reaction mixture) were added to each tube to a final volume of 500 µl). The reaction mixtures were incubated for 0, 24 and 48 hours at 28-30°C. Following incubation, the reaction mixture samples were transferred in a 0.1cm quartz cuvette and analysed for polarization of far UV spectra in circular dichroism for characteristics of protein structures. The tubes containing buffer and salt solutions were used for blank control set up for CD Spectropolarimeter (Jasco J-810).Fluorescent spectrometry. The rate of increase in Thioflavin-T (THT-T) fluorophore absorbance value (Relative Fluorescence Unit, RFU) in the cell free reaction mixture containing Aβ42 is an index for aggregation. To assess, each well of a 96 well transparent flatbottom, low binding microtiter plate (Coaster3884, Corning) was filled up with reaction mixture containing Aβ42. The aggregation kinetics were determined by THT-fluorescent spectrophotometry (Instrument: SpectraMax M5, Molecular Devices, US) at wavelength range of 440nm (excitation), 485 nm (emission) with cutoff at 475 nm for 70-hour time with 30 minutes interval at 30°C. The reaction mixture (35 µl) contains 32 mM Abeta42 in 10X (0.1 M) KH2PO4/K2HPO4 buffer separate for each pH 5.5, 7.4, 8.5 solution. The salt KCl (5mM, 10 mM and 100 mM) were added separately to each reaction mixture with or without 15 mM NaCl and 5.0 µl deionized water to make up total volume. The fluorophore Thioflavin-T (THT-T) (5.0 mM) was added to each of the reaction mixtures to attain final concentration 100 µM per sample in each well. The reaction mixture was equally distributed (35 µl/well) in each well of the microtiter plate, sealed at the top by transparent sheet to avoid loss due to evaporation and placed in the spectrophotometer (Molecular Devices, USA) programmed with intermittent mixing at 30°C.Circular dichroism (CD). In a separate set of experiment, the reaction mixtures for CD experiments were prepared by adding 250 µl 10 mM KCl and 10 mM sodium chloride (NaCl) to the reaction mixtures (final concentrations was 5mM for each salt solution in deionized water) prior to Aβ42 in 500 µl buffer with and without unrelated protein bovine serum albumin (BSA; final concentration 1mg/ ml) and incubated for the time points 0, 24 and 48 hours. Following each incubation time point, the reaction was stopped by keeping the tubes at -20°C. The reaction mixtures (500 µl) containing amyloid beta42 suspension (in 10mM NaOH in potassium phosphate buffer) at different pH and 5mM NaCl, 5mM KCl salt solution were tested for alterations in secondary protein structures by Circular Dichroism (CD) machine (Jasco J-810; at a wavelength range of 190 - 300 nm) at room temperature using 0.1 cm quartz cuvette (Starna Cells Inc. USA). The samples were analysed for the presence of alpha helix (negative peak 222 and 208 nm; positive peak 190 nm); beta sheet (negative peak 218 nm; positive peak 195 nm) and random coil/ irregular conformations (negative peak 200 nm: 197-205 nm). The far UV spectrum was used in the CD experiment to identify the strong pi-electron shift at 190 nm and weaker broader peak at wavelength range 210-220 nm. The CD data (ellipticity in milli-degrees) versus absorbance (in nm) were collected by machine in five accumulations. The CD data (milli-degrees) were converted into mean residual ellipticity values (θ, in deg*cm2 / dmol) by using equation with respect to mean residual weight [n = (Molecular weight)/ (Number of amino acids) -1)] of the peptide. The results were analysed by using CAPITO software for CD data and plot [22]. The CD plots are defined as molar CD data (θ, degree-cm2 / dmol) versus wavelength (nm) [23], [24].
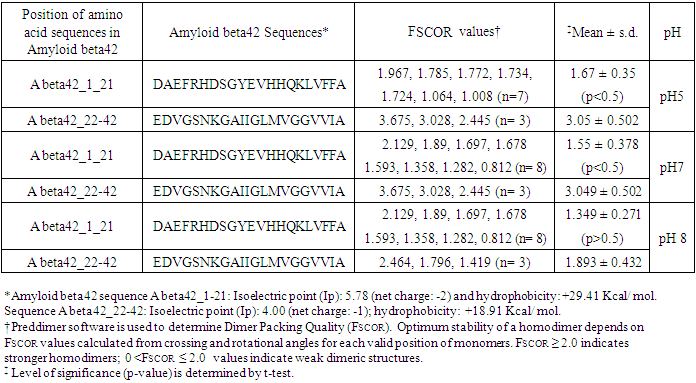
3. Results
- Determination of the ability of Amyloid beta42 peptide to form homodimer at different pH range in cell free digital mode of reaction conditions.The aggregation of Aβ42 in human brain is critical for onset of neurological disorders leading to dementia. To determine the ability of Aβ42 peptides to form homodimers, we performed computer guided experiment by using Preddimer software. The feasibility of formation of homodimer structures depends on the closest alignments of the peptide structures measured by increasing Dimer Packing Quality (FSCOR) values. Results presented in the Table 1 show differential binding abilities of Aβ42 peptides at different pH ranges. At pH5, the fragment of Aβ42 peptide: DAEFRHDSGYEVHHQKLVFFA shows low mean FSCOR value 1.67 ± 0.35 for seven different homodimer forms (n= 7). The FSCOR is 45.25% less (p< 0.5) than that of residual peptide sequence: EDVGSNKGAIIGLMVGGVVIA (FSCOR = 3.05 ± 0.502). The observations indicate overall presence of Aβ42 weak dimeric structures in the package of stable conformations formed by DAE---VFFA peptide as compared with relatively stronger dimeric structures formed by EDV---VIA peptide fragment. At pH7 reaction condition, DAE—VFFA peptide fragment of Aβ42 is shown to form weak dimeric structure as its mean FSCOR value (1.55± 0.378; n=8) is 49.16% less (p<0.5) than that of the peptide fragment EDV---VIA (FSCOR = 3.049 ± 0.502; n=3) of Aβ42. However, at pH8 reaction condition, the Aβ42 peptide fragment DAE VFFA has been demonstrated mean FSCOR value, 1.349 ± 0.271 (n=8).The value is 29% less than the residual peptide fragment EDV---VIA. Thus, the reaction mixture with pH8 buffer demonstrates relatively unfavourable condition for maintaining stable aggregated structure for Aβ42. The hydrophobicity value has been found higher for DAE--- VFFA peptide fragment of Aβ42 (A beta42_1_21: +29.41 kcal/ mol) than EDV---VIA peptide (A beta42_22_42: +18.91 Kcal/ mol) which explains the stable package with higher FSCOR value for EDV---VIA fragment of Aβ42 that contains a smaller number of hydrophobic amino acids (Table 1). As found, Amyloid Precursor Protein (APP) amino acid sequence 672-713 (truncated Aβ1-42 sequence) demonstrates hydrophobicity value +40.42 Kcal/ mol.
|
 | Figure 1 |
 | Figure 2 |
 | Figure 3 |
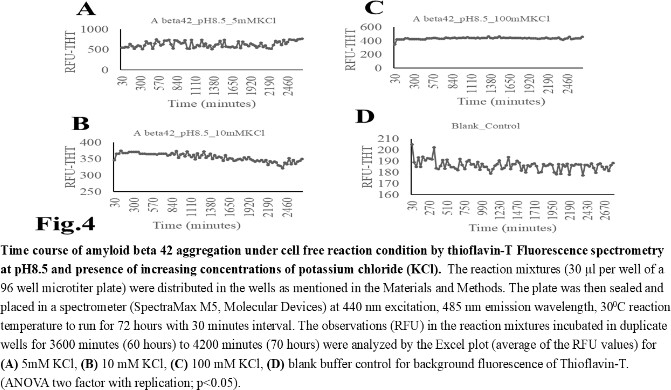 | Figure 4 |
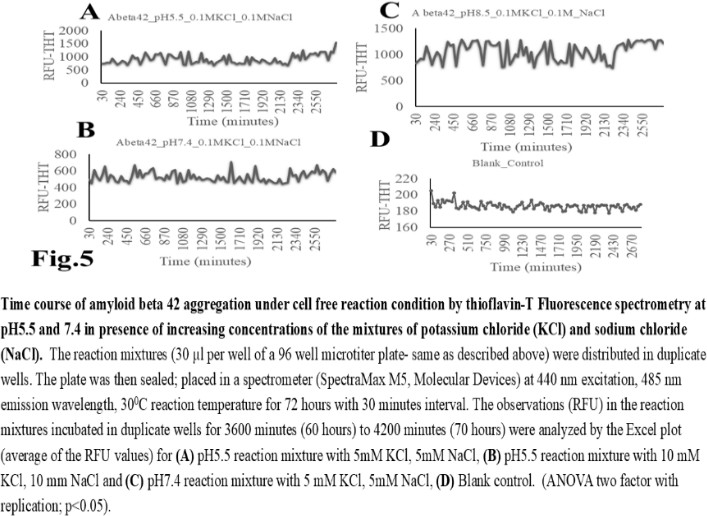 | Figure 5 |
 | Figure 6 |
 | Figure 7 |
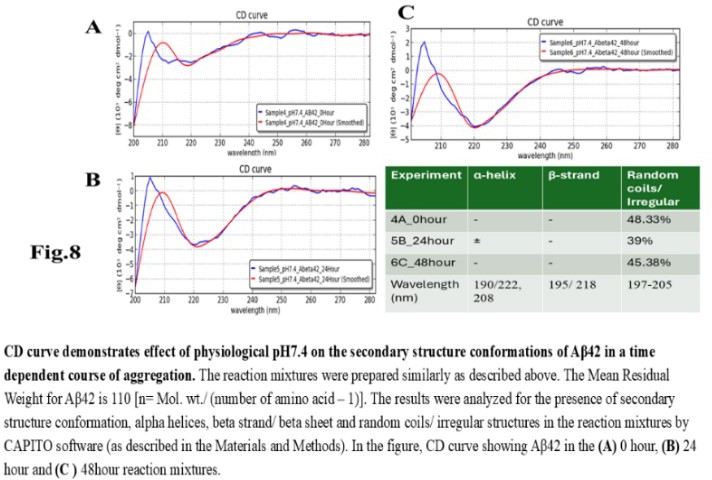 | Figure 8 |
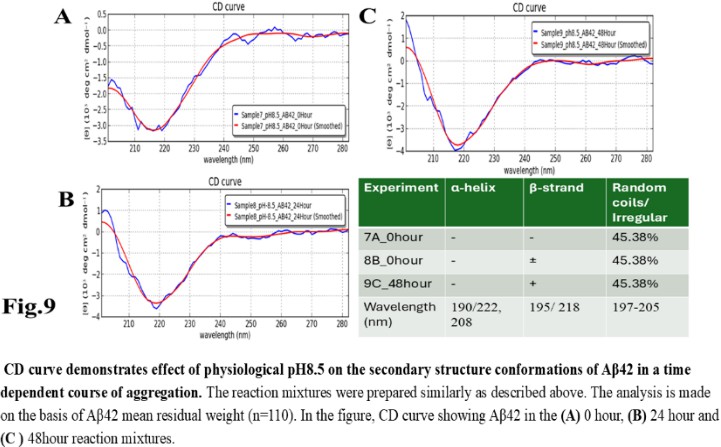 | Figure 9 |
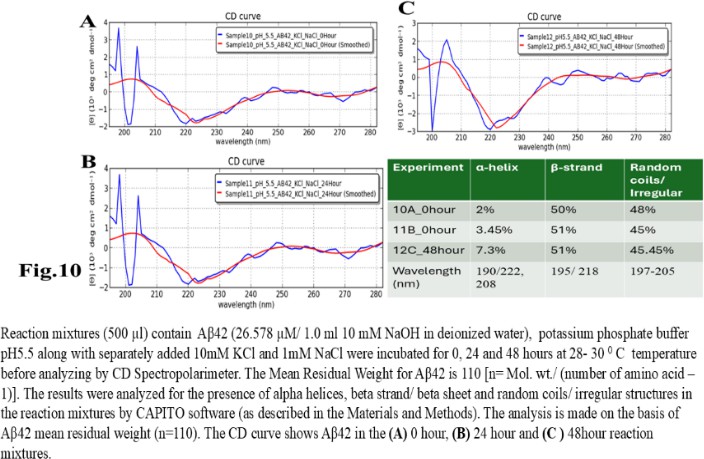 | Figure 10 |
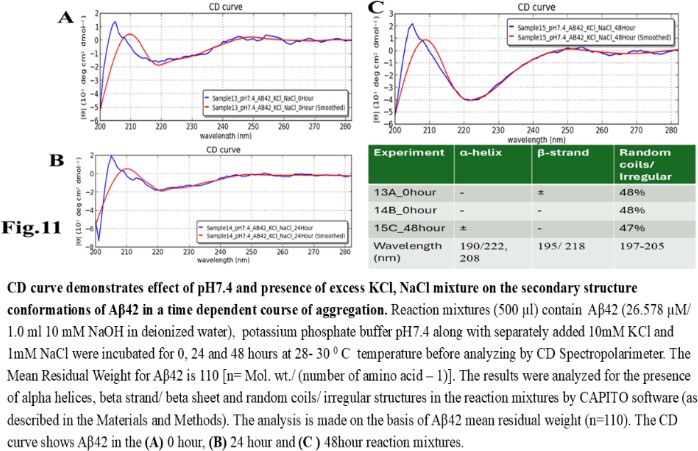 | Figure 11 |
4. Discussion
- The computer guided experiments on the ability to form Aβ42 homodimer structures demonstrate overall low Dimer Packing Quality (FSCOR < 2) value for Fragment1-21 as compared with Fragment22-42 at pH5 and pH7. However, at pH8, the FSCOR values for the Fragment22-42 is decreased and become comparable to that obtained from Fragment1-21. The observation suggests differential ability of the two fragments within Aβ42 (1-42 amino acid) peptide structure to form stable homodimer, as, Fragment22-42 can generate comparatively stable homodimer (FSCOR = 3) than Fragment1-21 (FSCOR = 1.6) at pH5, 7. At pH8, dimer formation ability is lower for both the fragments of Aβ42. The alterations in the physical properties (pKa, net charge of functional groups in amino acids present in Aβ42) and ability to form Hydrogen bonds are critical with change in pH thereby influence the formation of aggregated Aβ42 structures.We found that the reaction mixture at pH 7.4 demonstrated a decrease in Aβ42 aggregation. The presence of potassium chloride facilitates only marginal aggregation but moderate level of Aβ42 aggregation is observed when sodium chloride is added to the reaction mixture. On the other hand, the acidic pH range (pH 5.5) facilitates Aβ42 aggregation. The Aβ42 reaction mixture, in presence of excess KCl and/or NaCl, not only shows increase in RFU with time as higher rate of Aβ42 aggregation but alters secondary structure conformation predominantly to beta sheet/ beta strand from the transient intermediate random coil/ irregular structures. In contrast, the alkaline pH (pH8.5), in presence and absence of salts (10 mM KCl and 1mM NaCl mixture), influences only marginal aggregation and alterations of transiently generated random coils but does not alter secondary structure conformations.Altogether, the results from our cell free experiments demonstrate low to moderate increase in aggregation with respect to Thioflavin-T fluorescence within a time limit of 0-70 hours at 28-30°C. The reaction mixture with buffer pH5.5 demonstrated alterations in secondary structures of aggregated Aβ42 in 0, 24 and 48 hours preincubated samples. Though, random coils and/or irregular structures are present in the reaction mixtures with variable extent in all experimental conditions irrespective of the presence of KCl and NaCl. These random/ irregular coils are not considered as conventional secondary structures but transient structures with less stability on the defined wavelength as alpha helix is defined by positive peak at 190 nm, negative peak at 222, 208 nm wavelength. The β-sheet and β-strand secondary structures are defined by the wavelength at 195 nm for positive peak and 218 nm for negative peak. The random coils and irregular structures show negative peak at 200 nm.The findings are partially consistent with the observations reported by different laboratories on Stefin A and B (Cystatin) and other amyloidogenic proteins which, in acidic pH 3-4, switch to its fibrillar structures through change in secondary conformations [15,16,26]. The explanations remain in the amino acids within the fragments 12-24 and 37-42 of 1-42 Aβ42 peptide. Hilbich et al. [27] demonstrated the chemical nature of aggregated amyloid beta A4 peptides in human brain as hydrophobic, fibrillar structure due to presence of hydrophobic amino acids which form anti-parallel beta sheet structures in the fragment containing amino acid sequence 10-43 in contrast to the purified amyloid beta which is water soluble. Barrow et al. [28] demonstrated characteristics of amino acids in sequence beta 1-39 and beta 1-42 of A beta42 are critical for amyloid deposition. Alpha helices (monomeric structures) are unfolded with increasing temperature at acidic pH1-4 and neutral pH7-10. However, beta sheet (oligomeric) structure is not sensitive to temperature and stable at pH4-7.
5. Conclusions
- Overall, the results demonstrate weak to moderate increase in Aβ42 aggregation kinetics at acidic pH (pH5.5) as compared to that in pH7.4 and 8.5. Our observations also demonstrate an increase in beta-sheet/ beta strand secondary conformations with irregular/ random coil conformations of Aβ42 at pH5.5 and in presence of salts, KCl, NaCl as compared with the observations at pH7.4 and 8.5. The presence of increasing concentrations of potassium and sodium chloride together was also found to increase Aβ42 aggregation at pH5.5 than at pH7.4 and 8.5 in cell free reaction mixtures.
Conflict of Interest Statement
- Authors declare no conflict of interests.
ACKNOWLEDGEMENTS
- I (S.D.G) acknowledge Discover funding to Neuro Drug Research LLC.I (S.D.G) am thankful to Dr. Guzeliya Korneva, Ph.D (Web Lab, Clemson University, Department of Bioengineering, Clemson) for circular dichroism (CD).I (S.D.G) acknowledge the SC BioCRAFT facilities supported by the National Institute of General Medical Sciences (NIGMS) of the National Institutes of Health under award number P30GM131959 for acquisition of circular dichroism (CD) data.I (S.D.G) acknowledge Ms. Charity Ferreira, South Carolina Research Authority (SCRA), Charleston, SC for Lab Facility, and cooperation.I (S.D.G) am thankful to the collaborators Michael Nicholes, Ph.D (M.N.), University of Missouri- St. Louis, and Kumar Sambamurti, Ph.D (K.S.), Department of Neurosciences, Medical University of South Carolina, Charleston and Dr. Mausumi Bandyopadhyay, Ph.D (M.B.), Trident Technical College for sharing their expertise on brain neuroscience and amyloid beta biology. K.S. is an expert on amyloid beta research and contributed to lab work on fluorescent spectrometry; M.B contributed with her expertise in Human brain anatomy and physiology in the context of AD/ADRD research; M.N. provided suggestions relevant to the AD/ADRD drug discovery project.M.B. reviewed the manuscript and provided critical suggestions.