Naglaa A. Elgendy1, Rasha ELBialy2, Eman El Sayed Mohammed3
1Hepato- Gastroenterology and Infectious Diseases Department, Faculty of Medicine for Girls, Al-Azhar University, Cairo, Egypt
2Neurology Department, Faculty of Medicine for Girls, Al-Azhar University, Cairo, Egypt
3Clinical Pathology, Faculty of Medicine for Girls, Al-Azhar University, Cairo, Egypt
Correspondence to: Naglaa A. Elgendy, Hepato- Gastroenterology and Infectious Diseases Department, Faculty of Medicine for Girls, Al-Azhar University, Cairo, Egypt.
| Email: |  |
Copyright © 2019 The Author(s). Published by Scientific & Academic Publishing.
This work is licensed under the Creative Commons Attribution International License (CC BY).
http://creativecommons.org/licenses/by/4.0/

Abstract
Aim: Assess the serum levels of S100β in the diagnosis of hepatic encephalopathy and its sensitivity and specificity in the diagnosis of different types of hepatic encephalopathy. Also, compare these results with ammonia levels in the same groups of patients. Patients and Methods: It was a cross-sectional study carried out on 60 patients (36 males and 24 females) of hepatic cirrhosis post chronic hepatitis C viral infection along with 60 ages and sex-matched healthy subjects (34 males and 26 females). The patients group classified into; Compensated group, Decompensated with covert hepatic encephalopathy group, and Decompensated with grade I-II hepatic encephalopathy. The studied groups were subjected to thorough clinical history and examination, neuropsychological testing, plasma ammonia level, and serum S100β. Results: There was a significant increase of S100β throughout the studied groups (16.75, 38.15, 57.00, and 86.20 ng/ml), P-value <0.001. Also, there was a significant increase of ammonia throughout the studied groups (21.50, 81.00, 98.50, and 188.50 µg/dl), P-value <0.001. Serum S100β >77.5 ng/ml has a sensitivity of 80% and specificity of 85% for hepatic encephalopathy diagnosis while plasma ammonia >165 ug/dl sensitivity of 75% and specificity of 100%. S100β >42 ng/ml has a sensitivity of 90% and specificity of 65% for the diagnosis of covert hepatic encephalopathy while plasma ammonia >92 ug/dl with the sensitivity of 65% and specificity of 75%. Conclusion: S100β candidate to be diagnostic serum marker of minimal hepatic encephalopathy.
Keywords:
Minimal hepatic encephalopathy, S100β, Ammonia, Neuropsychological tests
Cite this paper: Naglaa A. Elgendy, Rasha ELBialy, Eman El Sayed Mohammed, Assessment of S100β in Patients with Minimal Hepatic Encephalopathy, American Journal of Biochemistry, Vol. 9 No. 2, 2019, pp. 45-55. doi: 10.5923/j.ajb.20190902.04.
1. Introduction
Minimal Hepatic Encephalopathy (MHE) is a frequent complication of liver disease and is considered as one of the worsts manifestations, severely affecting the life of patients and caregivers. Moreover, cognitive impairment results in the use of more healthcare resources than other liver diseases [1,2]. MHE incidence is ranging between 20% and 80% of patients with cirrhosis [3,4].Only 50% of clinicians had screened their patients for MHE, and 38% had never studied their patients with liver cirrhosis using psychometric assessment. MHE impairs patients’ quality of life (QoL), increases the occurrence of disability, and has a negative effect on their daily activities [5]. In the presence of MHE, QoL indicators, such as the capacity to drive a car, and the incidence of sleep disorders were impaired [6].S100β is a 10.4 kDa protein that is primarily synthesized in the brain by the end feet (EF) processes of the astrocytes, and it belongs to a superfamily of low molecular weight acidic calcium-binding proteins of the EF-hand type [7]. It was termed S100 because it is partially soluble in a 100% saturated solution of ammonium sulfate, and it’s protein consists of two subunits (α and β) [8]. This protein is primarily metabolized in the kidney, excreted in the urine, and it does not seem to show circadian variation [9]. S100β normally is low or undetectable in serum; however, elevated serum levels have been detected in a number of neuropathological conditions and suggest it is a candidate to become a diagnostic and prognostic parameter for various neurological disorders [10].Although S100β is not entirely specific for the central nervous system (CNS), it is present in the brain at much higher concentrations than in other tissues (80%-90% of the total pool is found within the brain), and so, this protein can be used as an early marker of brain damage [7].Astrocytes are keys in homeostasis regulation in the CNS, being activated after brain injury and releasing S100β [11]. Increased levels of S100β in patients with acute or chronic liver failure, and HE might reflect an early stage of intra-cerebral changes before the development of marked cerebral edema [12,13].Moreover, it has been proposed that increased serum concentrations of S100β could predict covert hepatic encephalopathy [14]. However, cutoff serum levels and their sensitivity and specificity in the diagnosis of different types of hepatic encephalopathy, especially low grade or minimal hepatic encephalopathy, are not identified. So; this study aimed to assess the serum levels of S100β in the diagnosis of hepatic encephalopathy and its sensitivity and specificity in the diagnosis of different types of hepatic encephalopathy. Also, compare these results with ammonia levels in the same groups of patients.
2. Patients and Methods
It was a cross-sectional study carried out on 60 healthy subjects (control), and 60 patients of hepatic cirrhosis post chronic hepatitis C viral infection attended to Hepatology, Gastroenterology, and Infectious Diseases Department, Al-Zahraa University Hospital, Al-Azhar University, in the period from November 2018 to August 2019. The patients were 36 males and 24 females their ages mean±SD 53.42 ± 6.17 years while the control group were 34 males and 26 females their ages mean±SD 51.90 ± 5.48 years.Inclusion Criteria: Adult patients diagnosed as hepatic cirrhosis post-chronic hepatitis C viral infection, proved by clinically, biochemistry and ultrasonography divided into 3 groups as regard clinical evaluation, liver function tests, and psychometric evaluation into; 20 patient as Compensated cirrhosis group, 20 patient as Decompensated cirrhosis with covert hepatic encephalopathy group and 20 patient as Decompensated cirrhosis with grade I-II hepatic encephalopathy group. Control group; includes 60 healthy subjects ages and sex-matched.Exclusion Criteria: High grade of encephalopathy, severe malnutrition, neurological diseases, use of psychoactive drugs, and presence of renal failure, respiratory failure, or cardiac failure diseases.Informed consent was taken from both patients and controls after explaining the purpose and implication of the study, which was approved by the local ethical committee.The studied population subjected to clinical history taking, thorough clinical examination, and the following neuropsychological testing; (is an established methodology for quantifying cognitive impairment due to various form of encephalopathy, including low –grade or minimal hepatic encephalopathy). These tests directly measure cognitive functions that are directly relevant to activities of daily living [15].We used the following tests:1-Mini Mental State Examination: It is the most commonly used test for screening cognitive function. It provides measures of orientation, registration, immediate memory, short –term memory, as well as language function [16].2.a: The line drawing test: For the assessment of the test result, the whole route is divided into small sections, and each touching or crossing the border in a section is counted. The number of mistakes and the time needed to go through the labyrinth; both are test results.2.b: The circle dotting test: is the simplest test of the battery. It is a test of pure motor speed, most prominent positive peaked. The subjects are asked to put a dot in each of the 100 circles given on the sheet after they have prepared by dotting the 20 circles at the top of the sheet first. Test result is the time needed.3-P300 wave measurement: it is defined as the difference in mili- seconds between the presentation of the infrequent target stimulus and the most prominent positive peak.Laboratory investigationsSeven ml of peripheral venous blood was withdrawn from each individual and divided into three aliquots; 2 ml of whole blood was collected in EDTA tube for measurement of ammonia, another 2 ml of whole blood was collected in sodium citrate tube for prothrombin time determination. The remaining part was collected in serum separator tube, centrifuged at 3500 rpm for 10 min serum was divided into two portions; first one for measurements of liver function tests [(alanine transaminases (ALT), aspartate transaminase (AST), albumin (Alb), total bilirubin (T. Bili), alkaline phosphatase (ALK)] and serum Creatinine, the second part of serum was stored at -20°C for S100β detection.Liver function tests and serum creatinine were done using Cobas C311 (Roche, Germany). Prothrombin time measurements were performed on a diagnostic full automated coagulation analyzer (Stago, France). Serum sodium was done by AVL automatic electrolyte analyzer (Roche).Plasma Ammonia was assayed with a Kinetic enzymatic method using the Ammonia kit (Cat. No. MG220 001, Lot: AMMS0108018) and was measured on 8897 photometer 5010; Germany.Serum S100β was assayed with human protein S100β kit using enzyme-linked immunosorbent assay (ELISA) (Bioassay Technology Laboratory, Cat. No E3669 Hu, Lot: 201907011, standard curve range: 0.5 ng/ml – 300 ng/ml, sensitivity: 0.22 ng/ml, intra-assay coefficient of variation percent (CV %), < 8% and inter-assay CV %, < 10%). with ELISA System AS 1851 Das; Italy (reader) and 16041412 Bio Tek; USA (washer).Statistical AnalysisWe calculate sample size according to Raosoft, and all statistical calculations were done using SPSS (statistical package for the social science version 26.00) statistical program, at 0.05, 0.01, and 0.001 level of probability [17]. Quantitative data with parametric distribution were done using Analysis of variance t-test to the comparison between two groups, and One Way ANOVA test followed by post hoc analysis using LSD to the comparison between three groups test, Quantitative data with non-parametric distribution were done using Analysis of variance Mann Whitney test to comparison between two groups, and Kruskal Wallis test used to the comparison between three groups test. Pearson linear correlation coefficient (r) was estimated to show the relationship between parameters, Receiver operating characteristic curve (ROC) was used to assess the best cut off point with its sensitivity, specificity, positive predictive value (PPV), negative predictive value (NPV) and area under the curve (AUC) done by using Medcalc (version 15.80). The confidence interval was set to 95%, and the margin of error accepted was set to 5%. The P-value was considered non- significant (NS) at the level of > 0.05, significant at the level of < 0.05, 0.01 and highly significant at the level of < 0.001 [18].
3. Results
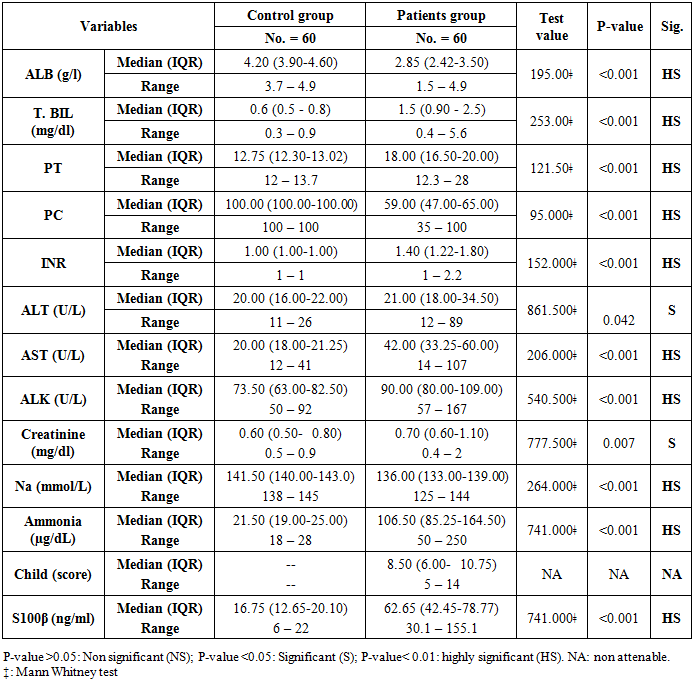
The main clinical characteristics of the studied patients and control group showed in the table (1), there were highly significant decrease in serum albumin levels, prothrombin concentrations and serum sodium levels in patients group in comparison to the healthy control group, while; there were a highly significant increase in serum bilirubin, prothrombin time, international normalization ratio (INR), AST, ALK, ammonia, and S100β in patients group in comparison to the healthy control group. Also, there were significant increases in ALT and creatinine levels in patients groups in comparison to the control group. Child scores ranged from 5 to 14 in the patients group, with a median of 8.5.Table 1. Laboratory and Clinical characteristics of the studied groups
 |
| |
|
There were highly significant decreases in T. Bili, PT, INR, and AST in the compensated group in comparison to decompensated and hepatic encephalopathy groups. Also, there were highly significant gradual decreases in albumin and sodium levels throughout all studied groups (Table 2). As regards S100β levels, there were highly significant gradual increases throughout the studied groups, reach the highest levels in hepatic encephalopathy patients (16.75, 38.15, 57.00, and 86.20 ng/ml), P-value <0.001. Also, there was a significant increase in ammonia levels throughout the studied groups (21.50, 81.00, 98.50, and 188.50 µg/dl), P-value <0.001 (Table 2). 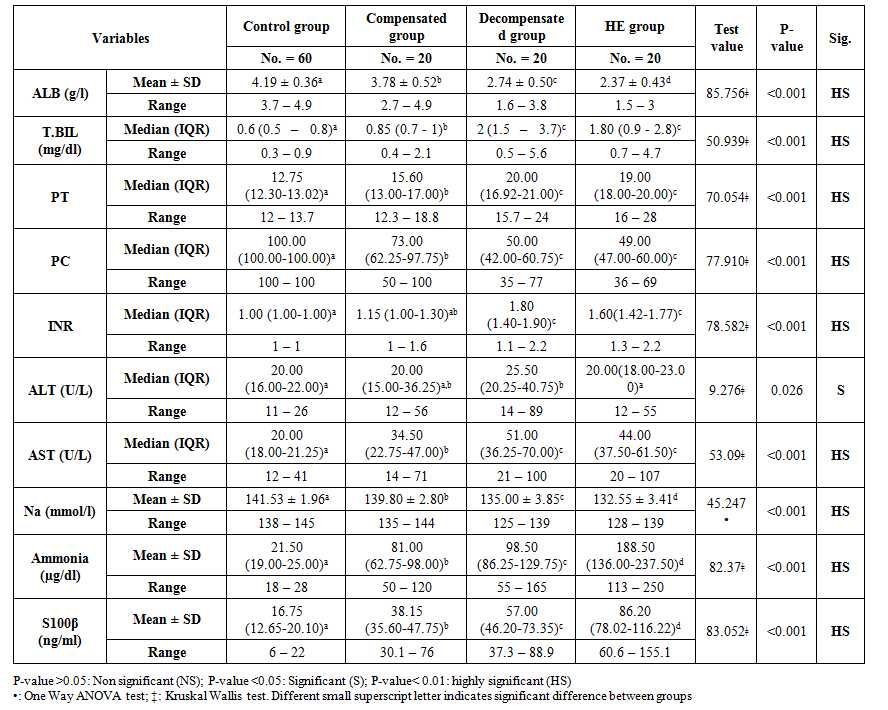 | Table 2. Comparison of the laboratory findings among the studied groups |
Also, there were significant increases in ALT levels in the decompensated group in comparison to compensated and hepatic encephalopathy groups. While, there were no significant differences in T. Bili, PT, PC, INR, and AST levels in comparison of decompensated group and hepatic encephalopathy group (Table 2).As regard neuropsychological evaluation of the studied groups, there was a gradual deterioration of the cognitive functions of the studied patients in comparison to healthy subjects and, in comparison, to each other, as shown in serial dotting test, line drawing test and MMES score. At the same time, there was significant prolongation in P300 wave measurement in comparison to the decompensated group without overt hepatic encephalopathy and hepatic encephalopathy group (327.25 ± 11.53 and 486.60 ± 12.60 wave/sec) respectively P-value = 0.000 (Table 3).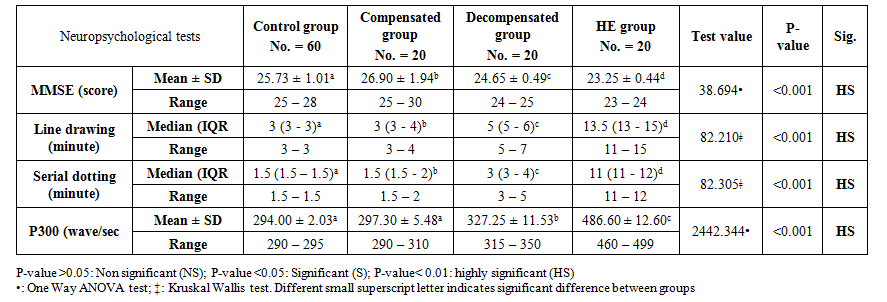 | Table 3. Neuropsychological tests result in the studied groups |
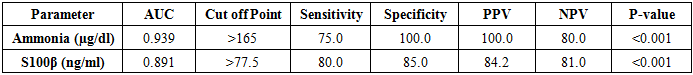
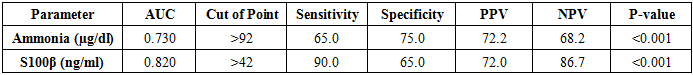
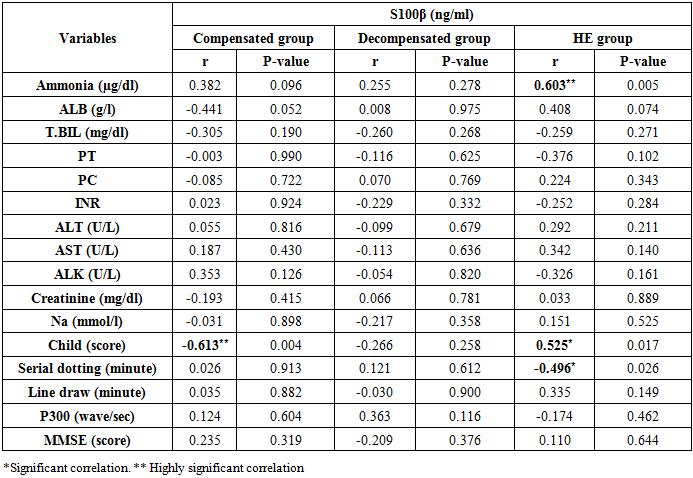
ROC curve analysis determines >77.5 ng/ml serum level of S100β, the best cut off for diagnosis of hepatic encephalopathy with the sensitivity of 80% and specificity of 85% (Table 4 and Figure 1). ROC curve analysis determines >42 ng/ml serum level of S100β, the best cut off for diagnosis of covert hepatic encephalopathy with the sensitivity of 90% and specificity of 65% (Table 5 and Figure 2). Table 4. Levels of ammonia and S100β sensitivity and specificity to diagnose overt HE
 |
| |
|
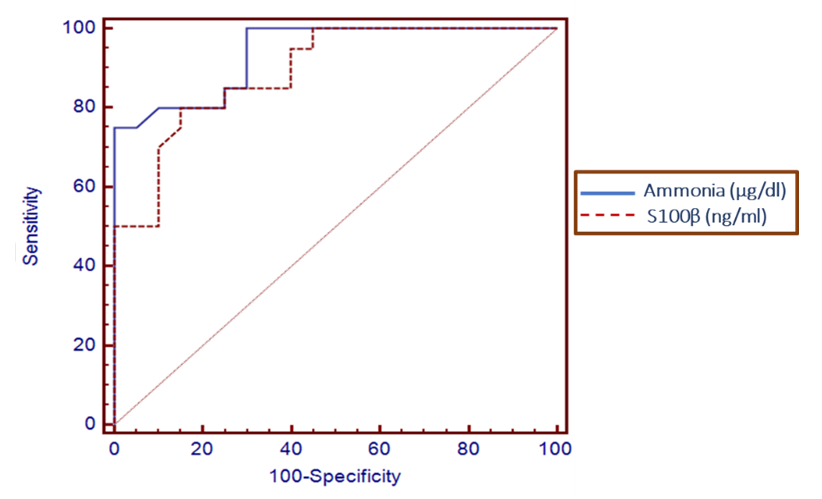 | Figure 1. Serum level S100β and ammonia can accurately diagnose overt hepatic encephalopathy. The AUC is shown for the performance of the serum S100β levels and ammonia for discriminating hepatic encephalopathy patients from the decompensated patients without encephalopathy. The vertical axis represents the sensitivity and the horizontal axis represents the 100-specificity |
ROC curve analysis determines >165 ug/dl serum level of ammonia, the best cut off for diagnosis of hepatic encephalopathy with the sensitivity of 75% and specificity of 100% (Table 4 and Figure 1). ROC curve analysis determines >92 ug/dl serum level of ammonia the best cut off for diagnosis of covert hepatic encephalopathy with the sensitivity of 65% and specificity of 75% (Table 5 and Figure 2).Table 5. Levels of ammonia and S100β sensitivity and specificity to diagnose covert HE
 |
| |
|
 | Figure 2. Serum level S100β can accurately diagnose covert hepatic encephalopathy. The AUC is shown for the performance of the serum S100β levels for discriminating decompensated patients without encephalopathy from the compensated patients. The vertical axis represents the sensitivity and the horizontal axis represents the 100-specificity |
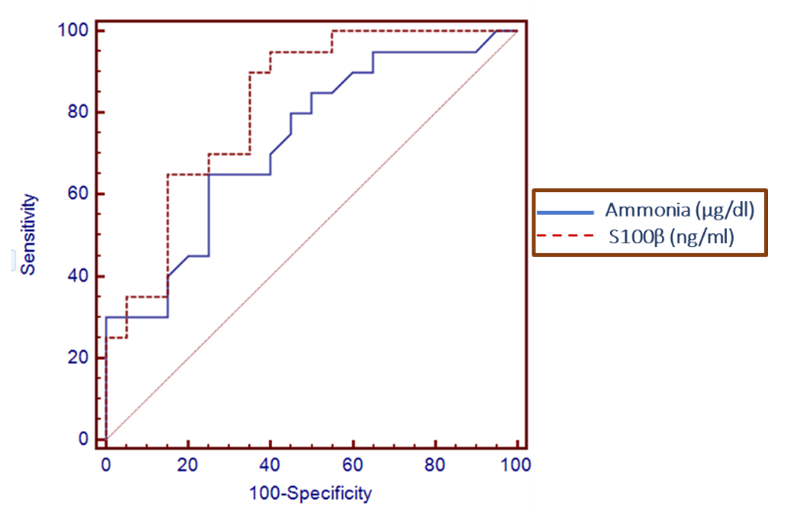
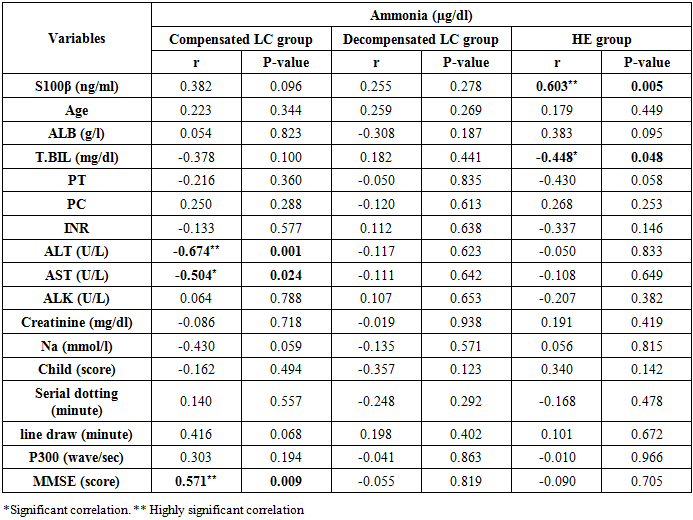
There was a highly significant positive correlation between S100β levels and ammonia levels in the hepatic encephalopathy group. Also, there were significant correlations between S100β levels, Child score (positive correlation), and serial dotting test (negative correlation) in the same group (Table 6 and Figures 3, 4 & 5).Table 6. Correlations between S100β and all the studied parameters among patients groups
 |
| |
|
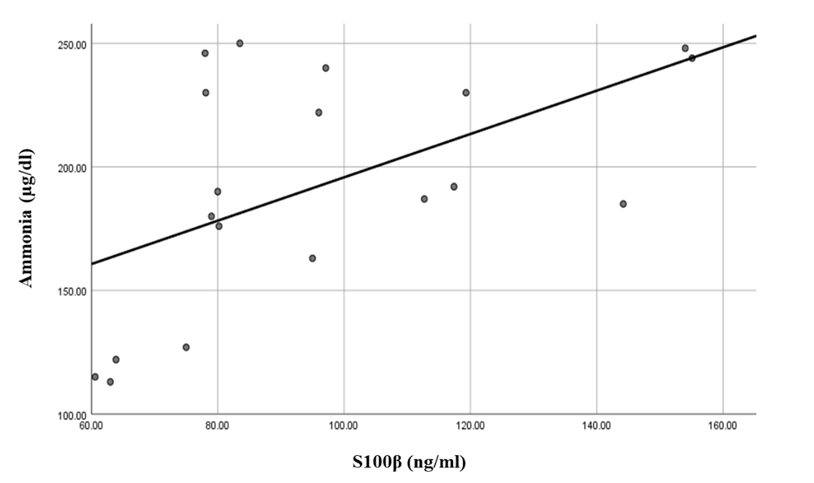 | Figure 3. Linear regression shows correlation between S100β and ammonia at Hepatic encephalopathy group |
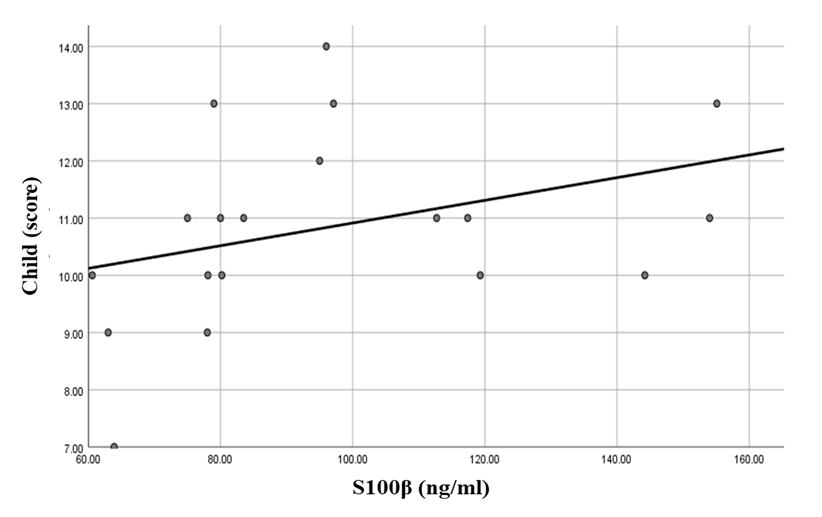 | Figure 4. Linear regression shows correlation between S100β and Child at HE group |
 | Figure 5. Linear regression shows correlation between S100β and serial dotting at HE group |
While there was a highly significant negative correlation between S100β levels and Child score in the compensated group (Table 6 and Figure 6). 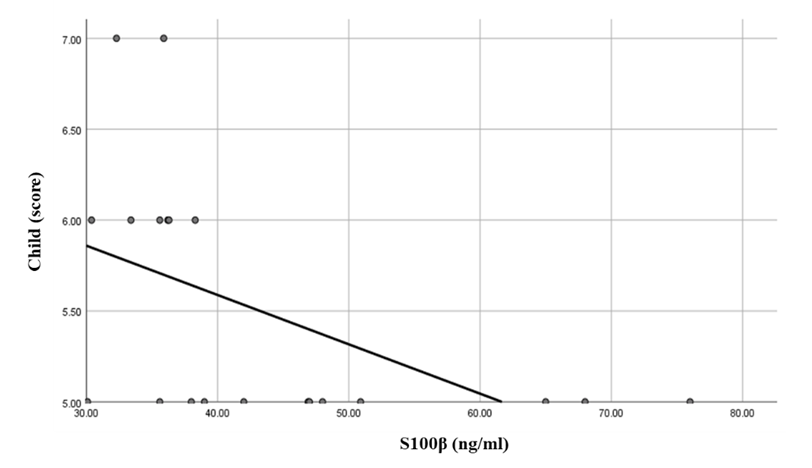 | Figure 6. Linear regression shows correlation between S100β and Child at Compensated group |
There was a highly significant positive correlation between ammonia levels and S100β levels in the hepatic encephalopathy group. While there was a significant negative correlation between ammonia level and total bilirubin in the same group (Table 7 and Figure 7). While there were highly significant negative correlations between ammonia levels and ALT and MMSE in the compensated group. Also, there was a significant negative correlation between ammonia levels and AST levels (Table 7 and Figures 8, 9 & 10).Table 7. Correlations between ammonia and all the studied parameters among patients groups
 |
| |
|
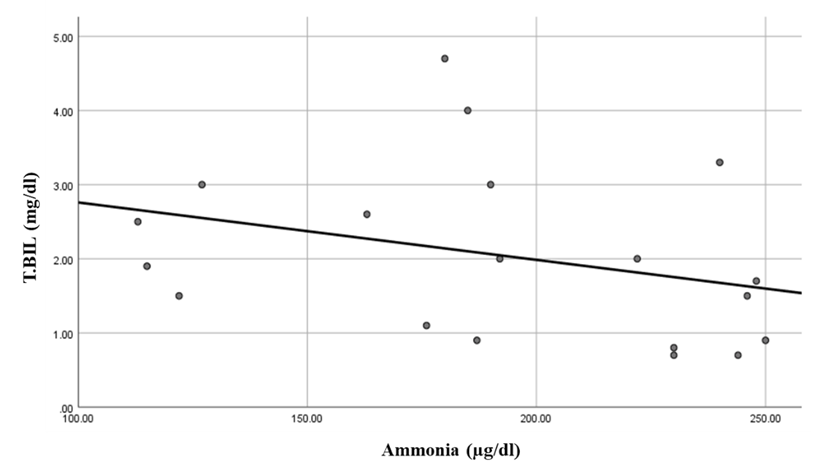 | Figure 7. Linear regression shows correlation between ammonia and T. BIL at HE group |
 | Figure 8. Linear regression shows correlation between ammonia and ALT at compensated group |
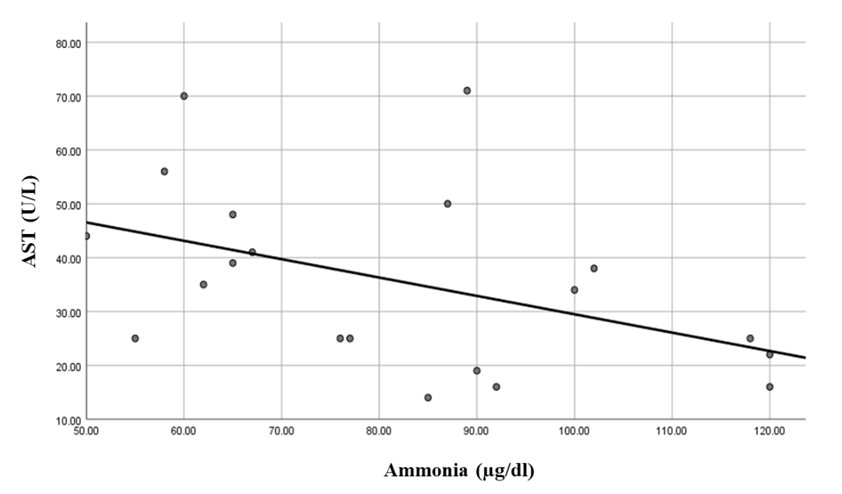 | Figure 9. Linear regression shows correlation between ammonia and AST at compensated group |
 | Figure 10. Linear regression shows correlation between ammonia and MMSE (score) at compensated group |
4. Discussion
Minimal hepatic encephalopathy (MHE) worsens the domains of activity, emotional function, and global scoring on the chronic liver disease questionnaire. MHE also alters appetite in cirrhosis and, consequently, the liver function impairment, a condition of malnutrition occurred adversely impacting the quality of life [19].Wiltfang et al. [14] and Saleh et al. [20] in their study conclude that serum S100β may be a useful surrogate marker to screen for patients with mild cognitive impairments due to portosystemic encephalopathy in cirrhotic patients before they progress to the more advanced stage of hepatic encephalopathy, and seems to be superior to the gold standard of arterial ammonia.In the present study, there were significant differences in S100β levels among all studied groups (healthy controls, cirrhotic patients without hepatic encephalopathy, decompensated cirrhotic patients with covert encephalopathy and decompensated cirrhotic patients with overt encephalopathy [14,20].These results were in consistent with Duarte-Rojo et al. [21] who found that S100β values were different among all groups, and differences remained significant between healthy controls and compensated cirrhotic patients with non-hepatic encephalopathy (P <0.001), and also between compensated cirrhotic patients with non-hepatic encephalopathy and cirrhotic patients with covert hepatic encephalopathy (P = 0.016), but not between covert and overt hepatic encephalopathy. However, they found that, cirrhotic patients with HE S100β was higher than in patients without HE [0.18 (0.14-0.28) ng/ml vs 0.11 (0.06-0.14) ng/ml, P < 0.001].This difference may be due to unequal small numbers of the studied groups in their study (healthy controls = 15 subjects, compensated cirrhosis = 22 patients, covert encephalopathy = 10 patients, and overt encephalopathy = 14 patients).Moreover, the results of the HE psychometric evaluation in Duarte-Rojo et al. [21] revealed that there was a clear deterioration in the performance of the critical flicker frequency and psychometric hepatic encephalopathy score tests in the group with cirrhosis and cirrhosis with covert hepatic encephalopathy or hepatic encephalopathy, as well as worsening in the individual psychometric hepatic encephalopathy score tests with a statistically significant difference.These results were consistent with the current study; there was a gradual deterioration of the cognitive functions of the studied patients in comparison to healthy subjects and, in comparison, to each other, as shown in MMES score, line drawing test, and serial dotting test. Patients with minimal hepatic encephalopathy had a significant impairment of daily functioning, such as social interaction, alertness, emotional behavior, sleep, work, home management, recreation, and pastimes compared with cirrhotic patients who did not have MHE [22].The current study showed that S100β serum levels have a sensitivity of 90% and specificity of 65% in the diagnosis of covert encephalopathy and have a sensitivity of 80% and specificity of 85% in the diagnosis of overt encephalopathy. These results were in comparable with Wiltfang et al. [14] as they reported sensitivity 56.5% and specificity 100% of elevated serum S100β to predict subclinical portosystemic encephalopathy, Saleh et al. [20] found that sensitivity and specificity of elevated serum S100β were 51.7% and 91.3% in the diagnosis of hepatic encephalopathy and also, Duarte-Rojo et al. [21] found that elevated serum levels of S100β have a sensitivity of 83.3% and specificity of 63.6% for the diagnosis of covert encephalopathy and hepatic encephalopathy.The present study showed there were significant elevations of plasma ammonia levels among compensated cirrhotic, decompensated with covert encephalopathy and overt encephalopathy patients in comparison to control group and to each other, with poor sensitivity (65%) and specificity (75%) of ammonia plasma levels in the diagnosis of covert hepatic encephalopathy in comparison to S100β.These results were in agreement with Saleh et al. [20] who found that plasma ammonia levels were significantly elevated in cirrhotic patients, hepatic encephalopathy grade I and hepatic encephalopathy grade II in comparison to control group with no significant increase in ammonia levels in hepatic encephalopathy grade I and grade II. Also, Wiltfang et al. [14] concluded that serum S100β serum levels were superior on plasma ammonia levels in screening cirrhotic patients with mild cognitive impairment.There was a highly significant positive correlation between S100β levels and ammonia levels in the hepatic encephalopathy group. While, there were significant correlations between S100β levels, Child score (positive correlation), and serial dotting test (negative correlation) in the same group. Also, in the total population in Duarte-Rojo et al. [21] study, S100β was found to have a moderate correlation both with PHES. In the subgroup of patients with cirrhosis, S100β showed moderate correlations with PHES as well as with Child score.Das et al. [23], studied the relationship of progression of MHE to overt HE in relation to the severity of liver dysfunction and found that the rate of progression to overt HE was much higher in patients with MHE and a CTP score >6 than in those with MHE and a CTP score< 6.
5. Conclusions
- S100β candidate to be diagnostic serum marker of minimal hepatic encephalopathy with good sensitivity and specificity.
6. Recommendations
- Use of S100β and neuropsychological tests in the screening of early cognitive impairments in patients with decompensated cirrhotic patients.
References
| [1] | Rakoski MO, McCammon RJ, Piette JD, Iwashyna TJ, Marrero JA, Lok AS, et al. (2012). Burden of cirrhosis on older Americans and their families: analysis of the health and retirement study. Hepatology, 55(1): 184-191. |
| [2] | Bajaj JS, Wade JB, Gibson DP, Heuman DM, Thacker LR, Sterling RK, et al. (2011). The multi-dimensional burden of cirrhosis and hepatic encephalopathy on patients and caregivers. Am J Gastroenterol, 106(9): 1646-1653. |
| [3] | Groeneweg M, Moerland W, Quero JC, Hop WC, Krabbe PF and Schalm SW (2000). Screening of subclinical hepatic encephalopathy. J Hepatol, 32(5): 748-753. |
| [4] | Romero-Gómez M, Córdoba J, Jover R, del Olmo JA, Ramírez M, Rey R, et al. (2007). Value of the critical flicker frequency in patients with minimal hepatic encephalopathy. Hepatology, 45(4): 879-885. |
| [5] | Arguedas MR, DeLawrence TG and McGuire BM (2003). Influence of hepatic encephalopathy on health-related quality of life in patients with cirrhosis. Dig Dis Sci, 48(8): 1622-1626. |
| [6] | Saab S, Ibrahim AB, Shpaner A, Younossi ZM, Lee C, Durazo F, et al. (2005). MELD fails to measure quality of life in liver transplant candidates. Liver Transpl, 11(2): 218-223. |
| [7] | Sen J and Belli A (2007). S100β in neuropathologic states: the CRP of the brain?. J Neurosci Res, 85(7): 1373-1380. |
| [8] | Rothermundt M, Peters M, Prehn JH and Arolt V (2003). S100β in brain damage and neurodegeneration. Microsc Res Tech, 60(6): 614-632. |
| [9] | Ikeda Y and Umemura K (2005). Analysis of reference values of serum S100β concentrations of Japanese adults. Rinsho Byori, 53(5): 395-399. |
| [10] | Foerch C, Singer OC, Neumann-Haefelin T, du Mesnil de Rochemont R, Steinmetz H and Sitzer M (2005). Evaluation of serum S100β as a surrogate marker for long-term outcome and infarct volume in acute middle cerebral artery infarction. Arch Neurol, 62(7): 1130-1134. |
| [11] | Petzold A, Keir G, Lim D, Smith M and Thompson EJ (2003). Cerebrospinal fluid (CSF) and serum S100B: release and wash-out pattern. Brain Res Bull, 61(3): 281-285. |
| [12] | Strauss GI, Christiansen M, Møller K, Clemmesen JO, Larsen FS and Knudsen GM (2001). S-100b and neuron-specific enolase in patients with fulminant hepatic failure. Liver Transpl, 7(11): 964-970. |
| [13] | Isobe-Harima Y, Terai S, Segawa M, Uchida K, Yamasaki T and Sakaida I (2008). Serum S100b (astrocyte-specific protein) is a useful marker of hepatic encephalopathy in patients with fulminant hepatitis. Liver Int, 28(1): 146-147. |
| [14] | Wiltfang J, Nolte W, Otto M, Wildberg J, Bahn E, Figulla HR, et al. (1999). Elevated serum levels of astroglial S100beta in patients with liver cirrhosis indicate early and subclinical portal-systemic encephalopathy. Metab Brain Dis, 14(4): 239-251. |
| [15] | Conn HO (1977). Trailmaking and number-connection tests in the assessment of mental state in portal systemic encephalopathy. Am J Dig Dis, 22(6): 541-550. |
| [16] | Folstein MF, Folstein SE and McHugh PR (1975). "Mini-mental state". A practical method for grading the cognitive state of patients for the clinician. J Psychiatr Res, 12(3): 189-198. |
| [17] | Snedecor GM and Cochran WG (1982). Statistical methods -7th edition lowa state Univ., Press, Ames. loww3a, USA. pp. 325-330. |
| [18] | Härdle W and Simar L (2007). Applied Multivariate Statistical Analysis. 2nd ed, Springer, 420 pp. |
| [19] | Mina A, Moran S, Ortiz-Olvera N, Mera R and Uribe M (2014). Prevalence of minimal hepatic encephalopathy and quality of life in patients with decompensated cirrhosis. Hepatol Res, 44(10): E92-E99. |
| [20] | Saleh A, Kamel L, Ghali A, Ismail A and El Khayat H (2007). Serum levels of astroglial S100-beta and neuron-specific enolase in hepatic encephalopathy patients. Eastern Mediterranean Health Journal, 13(5): 1114-1123. |
| [21] | Duarte-Rojo A, Ruiz-Margáin A, Macias-Rodriguez RU, Cubero FJ, Estradas-Trujillo J, Muñoz-Fuentes RM and Torre A (2016). Clinical scenarios for the use of S100β as a marker of hepatic encephalopathy. World J Gastroenterol, 22(17): 4397-4402. |
| [22] | Dhiman RK, Saraswat VA, Sharma BK, Sarin SK, Chawla YK, Butterworth R, et al. (2010). Minimal hepatic encephalopathy: consensus statement of a working party of the Indian National Association for Study of the Liver. J Gastroenterol Hepatol, 25(6): 1029-1041. |
| [23] | Das K, Singh P, Chawla Y, Duseja A, Dhiman RK and Suri S (2008). Magnetic resonance imaging of brain in patients with cirrhotic and non-cirrhotic portal hypertension. Dig Dis Sci, 53(10): 2793-2798. |

 Abstract
 Reference
 Full-Text PDF
 Full-text HTML