-
Paper Information
- Previous Paper
- Paper Submission
-
Journal Information
- About This Journal
- Editorial Board
- Current Issue
- Archive
- Author Guidelines
- Contact Us
American Journal of Biochemistry
p-ISSN: 2163-3010 e-ISSN: 2163-3029
2018; 8(5): 100-105
doi:10.5923/j.ajb.20180805.03

Spectrofluorimetric Determination of Bovine Serum Albumin Using Enoxacin-Aluminium (III) as a Fluorescence Probe
 Abstract
 Reference
 Full-Text PDF
 Full-text HTML
Nasiruddin1, Md. Kamruzzaman2, Md. Razu Ahmed1, Md. Anwaruzzaman2, Md. Lawshan Habib2, Md. Abdul Mannan3
1Department of Chemistry, Bangabandhu Sheikh Mujibur Rahman Science & Technology University, Bangladesh
2Department of Applied Chemistry & Chemical Engineering, Bangabandhu Sheikh Mujibur Rahman Science & Technology University, Bangladesh
3Department of Chemistry, University of Rajshahi, Rajshahi, Bangladesh
Correspondence to: Md. Abdul Mannan, Department of Chemistry, University of Rajshahi, Rajshahi, Bangladesh.
| Email: |  |
Copyright © 2018 The Author(s). Published by Scientific & Academic Publishing.
This work is licensed under the Creative Commons Attribution International License (CC BY).
http://creativecommons.org/licenses/by/4.0/

A simple, sensitive, and selective spectrofluorimetric method has been presented to determine bovine serum albumin (BSA) levels using enoxacin (ENX)-aluminium (Al3+) as a fluorescence probe. The fluorescence (FL) intensity of ENX was enhanced when Al3+ was added in to the ENX solution through charge transfer reaction and formed a binary ENX-Al3+ complex. The FL intensity of the ENX-Al3+ complex was further enhanced in the presence of BSA in Briton-Robinson buffer (pH=5.8). Under the optimum condition, the FL intensity was enhanced linearly by BSA concentrations in the range of 0.13 to 10.0 ng mL–1. The limit of detection was found to be 0.03 ng mL–1 with the relative standard deviation of 1.23% for 5 replicate determinations of 25 ng mL–1 of BSA. In comparison with most of the other reported methods, the proposed FL method provides high sensitivity, wide linear range with simple and less expensive instruments to determine BSA.
Keywords: Fluorescence probe, Enoxacin, Aluminium (III), Bovine serum albumin, Charges transfer reaction, High sensitivity
Cite this paper: Nasiruddin, Md. Kamruzzaman, Md. Razu Ahmed, Md. Anwaruzzaman, Md. Lawshan Habib, Md. Abdul Mannan, Spectrofluorimetric Determination of Bovine Serum Albumin Using Enoxacin-Aluminium (III) as a Fluorescence Probe, American Journal of Biochemistry, Vol. 8 No. 5, 2018, pp. 100-105. doi: 10.5923/j.ajb.20180805.03.
Article Outline
1. Introduction
- Bovine serum albumin (BSA) is a serum albumin protein which has abundant biological applications including ELISAs (Enzyme-Linked Immunosorbent Assay), immunoblots and immunohistochemistry. It is used as a nutrient in cell and microbial culture and to stabilize some enzymes during digestion of DNA and to prevent adhesion of the enzyme to reaction tubes and other vessels. BSA is also involved in the transport of a variety of endogenous and exogenous substances of the body that plays a vital role in the distribution and deposition of these substances [1]. The interaction between proteins and various kinds of drugs is very important for wide range of pharmacological, biological, and clinical applications. Because, when pharmaceutical compounds are absorbed, they enter into the circulatory system and widely and reversibly bind to serum albumin [2]. Therefore, it is becoming more and more important to analyze proteins qualitatively and quantitatively for the investigation of proteins and their interaction with drugs. The widely used chemical assays to determine protein levels are Lowry [2, 3], silver staining method [4], fluorescence resonance light scattering (RLS) [5-7], UV–vis absorption spectroscopy [8], Fourier transform infrared (FTIR) [9], circular dichroism spectroscopy (CD) [10,11], chemiluminescence [12, 13], electrochemistry [14, 15], and nuclear magnetic resonance (NMR) [16]. However, these methods have some limitations such as narrow linear range or slower reaction time, limited practical applications, complicated as multiple steps are involved and expensive instrumentation.In order to overcome the above limitations, ligand sensitized FL methods using covalent and non-covalent FL probes have been extensively examined to determine BSA because FL method provides high sensitivity and selectivity with simple and inexpensive instrumentation [17-22]. Covalent FL probes have many problems arising from inadequate chemistry, multiple derivatives and reaction conditions although they are suitable for labeling the N-terminus or other functional groups of the protein. In contrast, non-covalent FL probes are simple, fast, and less expensive which are frequently used to determine protein [23, 24]. In the presented FL method, enoxacin-Al3+ has been utilized as a FL probe for the investigation and detection of BSA levels. Enoxacin (ENX) is a fluoroquinolone antibacterial drug containing active group comprised of a –COOH, C=O, and a suitable ligand, and forms stable complexes with metal ions due to efficient energy transfer from the ligand to the metal. In this work, we selected ENX as a ligand for the Al3+ ion and investigated the enhancement of FL intensity by ENX and BSA. We found that the FL intensity of ENX was enhanced when Al3+ ion was added to ENX solution by charge transfer, and that this intensity was markedly enhanced when BSA was present in the ENX-Al3+ solution. Furthermore, FL intensities were enhanced by BSA over a wide concentration range in a linear manner with a limit of detection at the nanogram level. Based on the above, a novel FL method of high sensitivity and selectivity is proposed to determine BSA levels in human serum samples. In addition, interactions in the FL system are discussed.
2. Experimental
- Reagents and chemicals: All reagents were of analytical reagent grade and were used without further purification. Distilled deionised (DI) water (Millipore, Milli Q Water System, USA) was used throughout. BSA and ENX were purchased from Sigma-Aldrich (St. Louis, USA) and used without further purification. Stock standard solution of BSA (0.5 mM) was prepared by dissolving BSA in DI water and stored at 4°C. Stock solution of ENX (1 mM) was prepared in DI water and stored in refrigerator before use. A stock solution of AlCl3 (5 mM) purchased from Duksan Pure Chemical Co. Ltd. (South Korea) was prepared using DI water. Britton-Robinson buffer (0.1 M) solution of pH=5.8 was used throughout and working solutions were prepared by diluting the stock solutions appropriately immediately before use.Apparatus: All the fluorescence spectra were recorded using a spectrofluorimeter (Model F- 4500, Hitachi, Japan) equipped with a 450-W Xenon lamp (Model XBO 450 W/1, Osram, Germany) as excitation light source and a photomultiplier tube (Model R928, Hamamatsu, Japan) powered at 950V as the detector. The excitation and emission slits were set at 10 nm to measure all the FL spectra. pH values were adjusted using a pH meter (Model Orion, 520A, USA). All the UV-visible spectra were measured using a UV-visible spectrophotometer (UV-1800, Shimadzu, Japan). Experimental procedure: All FL measurements were made using the following procedure. To a 10 mL volumetric flask, 1 mL of Al3+ solution, 1 mL buffer (pH=5.8) solution, and 1 mL ENX solution were added and diluted with 5 mL of doubly distilled DI water. The solution was mixed thoroughly and allowed to stand for several minutes. Then, 1 mL of BSA was added to the solution and diluted to mark with distilled DI water. The mixture was then allowed to stand for about 20 minutes. The solution was then added to 1 cm quartz cells to measure FL spectra using an emission and excitation wavelengths of 409 nm and 274 nm, respectively. Excitation and emission slits were set at 5 nm and the photomultiplier tube voltage was set at 900 V.
3. Results and Discussion
- Fluorescence spectral characteristicsThe FL emission spectra of (a) Al3+, (b) BSA, (c) ENX, (d) ENX-Al3+, and (e) ENX-Al3+-BSA are shown in Figure 1. Al3+ had nearly no emission peak whereas ENX exhibited emission at ~409 nm [Figure 1, curve (a, c)]. When Al3+ was added to ENX solution, a charge transfer reaction occurred, which enhanced the FL intensity of ENX and red shifted to 428 nm [Figure 1, curve (d)]. These results suggest that ENX forms a binary complex with Al3+ and this complex enhances the FL intensity of ENX [25]. Furthermore, the FL intensity of the ENX-Al3+ system was further enhanced markedly with a slight red shift (431 nm) by the addition of BSA [Fig. 1, curve (e)], presumably due to an intramolecular energy transfer from BSA to ENX-Al3+ [25]. Thus, the results imply an interaction between BSA and ENX-Al3+ to form a stable ENX-Al3+-BSA complex.
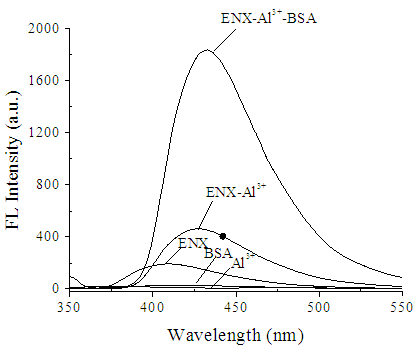 | Figure 1. Fluorescence emission spectra: a) Al3+; b) BSA; c) ENX; d) ENX-Al3+; e) ENX-Al3+-BSA. Conditions: [BSA] = 5 ng mL–1; [ENX] = 5 µM; [Al3+] = 0.06 mM; pH = 5.8; Briton-Robinson buffer=0.1 M; λex = 274 nm |
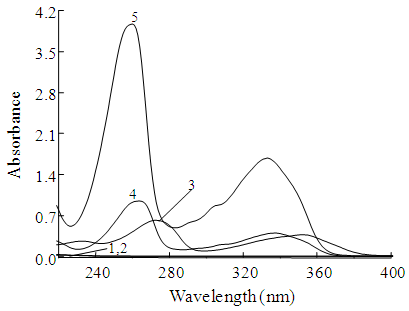 | Figure 2. Absorption of BSA in different system: 1) Al3+, 2) BSA, 3) ENX, 4) ENX-Al3+, 5) ENX-Al3+-BSA. Conditions: [BSA] = 25 ng mL–1; [ENX] = 5µM; [Al3+] = 0.06 mM; pH = 5.8; Briton-Robinson buffer = 0.1 M |
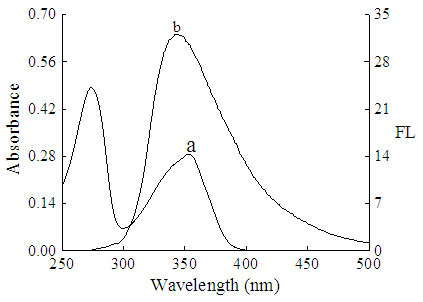 | Figure 3. The overlap of the fluorescence spectra of BSA (b) and absorption spectra of ENX (a) |
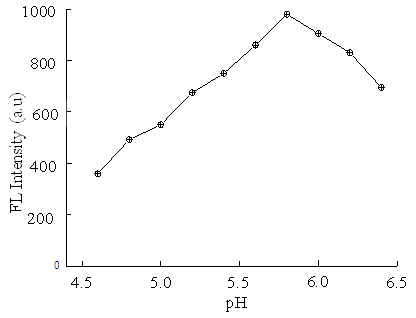 | Figure 4. Effect of pH on the FL intensity of ENX-Al3+-BSA system. Conditions: [BSA] = 5 ng mL–1; [ENX] = 5µM; [Al3+] = 0.06 mM; Briton-Robinson buffer = 0.1 M |
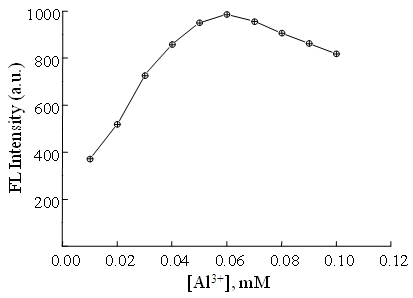 | Figure 5. Effect of Al3+ concentration on the FL intensity of ENX-Al3+-BSA system. Conditions: [BSA] = 5 ng mL–1; [ENX] = 5µM; pH = 5.8; Briton-Robinson buffer = 0.1 M |
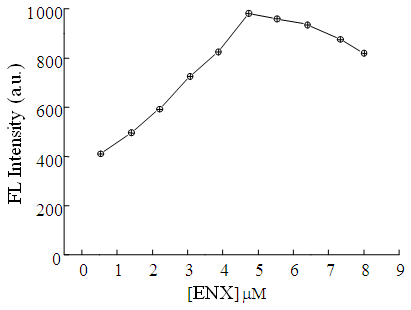 | Figure 6. Effect of ENX concentration on the FL intensity of ENX-Al3+-BSA system. Conditions: [BSA] = 5 ng mL–1; [Al3+] = 0.06 mM; pH = 5.8; Briton-Robinson buffer = 0.1 M |
|
4. Analytical Application
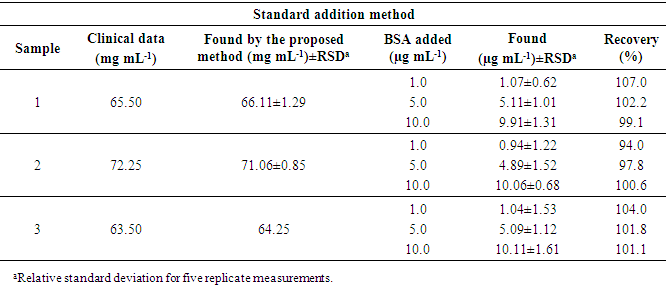
- Linear range and detection limit to determine BSAUsing the above-mentioned optimal conditions, a calibration curve of FL intensity vs. BSA concentration in the range of 0.13 to 10.0 ng mL–1 (the correlation coefficient (r) between the two variables was 0.9981) was plotted. The limit of detection (LOD) as defined as recommended by IUPAC, LOD=3Sb/m (where Sb is the standard deviation of blank signals and m is the slope of the calibration curve) was found to be 0.03 ng mL–1 for BSA. The standard deviation (RSD) of the proposed method was 1.15% for 5 measurements at a BSA concentration of 5.0 ng mL–1. Determination of BSA in serum sampleIn order to demonstrate the applicability of the proposed method, it was applied to determine BSA concentrations in serum sample. The results are listed in Table 2. Fresh serum samples were diluted appropriately (10 fold) to obtain a BSA concentration within the linear range. Aliquots (1.0 mL) of sample solutions were analyzed using the developed method according to the standard addition method. The results in Table 2 indicated that the developed method is reliable and suitable for practical applications with good precision and accuracy. Recoveries were found to be in the range 94.0–107.0% for BSA.
|
5. Conclusions
- A sensitive, straightforward, cost effective spectrofluorometric method was described based on the interaction between BSA and ENX-Al3+ complex for the determination of BSA levels in serum. It was found that ENX can form complexes with Al3+ and an energy transfer occurred from ENX to Al3+, which produced a strong FL signal. After the addition of BSA, it can combine with the Al3+-ENX binary complex and form the Al3+-ENX-BSA ternary complex. ENX can transfer the energy to BSA and the FL intensity of Al3+-ENX complex was markedly inhibited after the addition of BSA in a linear manner in the BSA concentration ranged from 0.13 to 10.0 ng mL–1. In particular, the proposed method offers a lower limit of detection (0.03 ng mL–1) than previously reported methods, and was successfully applied to the determination of BSA in serum samples revealing excellent reproducibility and accuracy. Furthermore, the described method offers the advantages of simplicity, rapidity, sensitivity, and selectivity for the determination of BSA.
ACKNOWLEDGEMENTS
- This research was supported by Bangabandhu Sheikh Mujibur Rahman Science & Technology University Research Fund.