-
Paper Information
- Paper Submission
-
Journal Information
- About This Journal
- Editorial Board
- Current Issue
- Archive
- Author Guidelines
- Contact Us
American Journal of Biochemistry
p-ISSN: 2163-3010 e-ISSN: 2163-3029
2018; 8(3): 45-55
doi:10.5923/j.ajb.20180803.01

Association of Adipokines with Metabolic Syndrome in North-West Rajasthan (India)
 Abstract
 Reference
 Full-Text PDF
 Full-text HTML
Ghanshyam Gahlot, Yogita Soni, Raj Kumar Vyas, Gajanand Joshi
Department Name of Biochemistry, Sardar Patel Medical College, Bikaner, Rajasthan, India (Rajasthan University of Health Sciences)
Correspondence to: Ghanshyam Gahlot, Department Name of Biochemistry, Sardar Patel Medical College, Bikaner, Rajasthan, India (Rajasthan University of Health Sciences).
| Email: |  |
Copyright © 2018 The Author(s). Published by Scientific & Academic Publishing.
This work is licensed under the Creative Commons Attribution International License (CC BY).
http://creativecommons.org/licenses/by/4.0/

Background: Metabolic syndrome is defined by a constellation of interconnected physiological, biochemical, clinical, and metabolic factors that directly increases the risk of cardiovascular disease, type 2 diabetes mellitus, and all cause mortality. Insulin resistance, visceral adiposity, atherogenic dyslipidemia, endothelial dysfunction, genetic susceptibility, elevated blood pressure, hypercoagulable state, and chronic stress are the several factors which constitute the syndrome. Adipokines may contribute to the development of obesity and insulin resistance and may be a causal link between Metabolic syndrome, diabetes and CVD. Hence, we studied the adipokines –adiponectin and leptin in subjects with Metabolic syndrome. Insulin resistance is a central abnormality of the metabolic syndrome, or syndrome X, originally hypothesized by Reaven Insulin resistance is more strongly linked to intra abdominal fat than to fat in other depots. Aim & Objective: The aim of the current study was to analyze the correlation of leptin, adiponectin and free fatty acids with obesity-related clinical, anthropometric, markers of insulin resistance and biochemical variables in adolescents from Indian origin. Materials and Methods: We studied 200 subjects, with Metabolic syndrome, diagnosed by International Diabetes Federation (IDF) criteria and 200 healthy control subjects, age between 25-65 years. Clinical evaluation included anthropometry, Waist circumference (WC), Body Mass Index (BMI) and waist-to-hip ratio (WHR) were calculated. The blood pressure (BP) - systolic (SBP) and diastolic (DBP), was also measured. Circulating levels of fasting glucose, total cholesterol (TC), high-density lipoproteins (HDL-C), adiponectin, leptin and free fatty acids were determined. Serum leptin, adiponectin and free fatty acids were estimated by sandwich ELISA method. Results: In our study, Subjects with the MetS had lower adiponectin and higher leptin levels (P<0.0001 for both variables) compared with individuals without the MetS. Adiponectin was significantly correlated with Age(r=0.917), BMI(r=0.835), WC(r=0.861), Waist-Hip ratio(r=0.872), Fasting blood sugar(r=0.844), Total Cholesterol(r=0.838), Triglycerides(r=0.907), High-density lipoprotein (HDL) cholesterol(r=0.935), Leptin(r=0.924), Free fatty acid (r=0.848) and also highly significant (P<0.0001) for all variables. In addition and Interestingly, Adiponectin & Leptin were significantly positively associated with increased MetS components (P-trend <0.0001). As well as free fatty acid levels were significantly higher in MetS subjects and women and correlate with all variables. Conclusion: Our results demonstrate a positive relationship between Adiponectin, Leptin levels, Free fatty acid and parameters of metabolic syndrome, including BP values in normotensive subjects with overweight/obesity. Serum concentrations of Leptin are associated with central body fat distribution. Insulin resistance and Adiponectin is associated with Dyslipidemia and these all disorders may ultimately lead to metabolic syndrome. Adiponectin, Leptin levels, Free fatty acid could be used as markers of metabolic syndrome development in adolescents. Obesity and related disturbances put these adults at a higher cardiovascular risk. Hence there is an urgent need for public health measures to prevent the ongoing epidemic of diabetes and CVD. Further research is encouraged to determine the efficacy of applying these biomarkers to diagnosis and treatment in a clinical setting.
Keywords: Adiponectin, Leptin levels, Free fatty acid, Insulin resistance, Diabetes Mellitus, Metabolic Syndrome
Cite this paper: Ghanshyam Gahlot, Yogita Soni, Raj Kumar Vyas, Gajanand Joshi, Association of Adipokines with Metabolic Syndrome in North-West Rajasthan (India), American Journal of Biochemistry, Vol. 8 No. 3, 2018, pp. 45-55. doi: 10.5923/j.ajb.20180803.01.
Article Outline
1. Introduction
- The prevalence of the metabolic syndrome is increasing in developed and developing Countries [1]. Metabolic syndrome (MetS) is a condition associated with an increase in various risk components [2] that predisposes an individual to both cardiovascular disease (CVD) and type 2 diabetes mellitus (T2DM) [3]. It is a complex condition, which has now become a worldwide epidemic. Metabolic syndrome is constellation of disturbances including glucose intolerance, central obesity / abdominal obesity, insulin resistance (IR), Dyslipidemia (increased triglycerides (TG), decreased high-density lipoprotein cholesterol (HDL-c), and increased low density lipoproteins cholesterol (LDL-c) and hypertension elevated blood pressure (BP) [4]. MetS is associated with an up to five-times increased risk of T2DM and an approximately two-fold increased risk of CVD [5]. This is due to clustering of various risk factors in patients with MetS. Population-based cohort studies on subjects with and without CVD and diabetes mellitus (DM) at presentation have demonstrated that the mortality rates due to these conditions were greater in those with MetS [6]. It is well accepted that the metabolic syndrome increases the risk for the development of cardiovascular disease, type 2 diabetes, stroke and cancer [1].Epidemiology of Metabolic Syndrome and Definition Criteria The prevalence of the metabolic syndrome has been increasing and continues to increase in most developed and developing countries [1-3]. The World Health Organization (WHO) estimates that more than 1 billion people are overweight globally, and if the current trend continues, that number will increase to 1.5 billion by 2015 [7]. Metabolic Syndrome is a chronic health problem affecting increasing number of people worldwide and is now recognized as a global epidemic. In India, metabolic syndrome is emerging as an important health problem particularly in urban areas, paradoxically co-existing with under nutrition. Almost 30-65% of adult urban Indians are either overweight or obese or have abdominal obesity [8]. The rising prevalence overweight and obesity in India has a direct correlation with the increasing prevalence of obesity-related co-morbidities; hypertension, the metabolic syndrome, dyslipidemia, type 2 diabetes mellitus (T2DM), and cardiovascular disease (CVD) [9, 10].
1.1. Definition
- According to the encyclopaedic dictionary of the Romanian language the term “syndrome” = group of signs and symptoms that appear together during a pathological process, giving it the characteristic note. Metabolic syndrome is a disorder of energy utilization and storage, diagnosed by a co-occurrence of at least three of five of the following medical conditions: abdominal (central) obesity, elevated blood pressure, elevated fasting plasma glucose, high serum triglycerides, and low high density lipoprotein (HDL) levels [11].
1.2. Pathophysiology
- Adipose tissue biology plays an important role in defining the mechanisms related to the pathophysiology of metabolic diseases, such as obesity, hypertension, metabolic syndrome, and type 2 diabetes [12, 13]. White adipose tissue synthesizes and releases various anti-inflammatory and pro-inflammatory cytokines known as adipokines [14, 15]. Adiponectin and leptin are two important adipokines in the regulation of energy homeostasis. Adiponectin is the most abundant adipokine and is recognized as a key regulator of insulin sensitivity, tissue inflammation, and endothelial function [16, 17]. Previous studies have reported that low serum levels of adiponectin are associated with risk of obesity, type 2 diabetes, and metabolic syndrome [18, 19]. Leptin is another key regulator of food intake and energy expenditure [20]. High levels of circulatory leptin are known to be associated with insulin resistance, obesity, and metabolic syndrome [21, 22].
1.3. Abdominal Obesity
- Adipose tissue is primarily composed of adipocytes (fat cells) whose main function is to store excess calories as triglycerides and release FFAs in response to the body’s energy needs [23]. Subcutaneous adipose tissue is situated just under the skin and is generally where the vast majority of body fat is stored. Visceral adipose tissue (intra-abdominal fat) is found primarily in the omentum and mesentery [24, 63].
1.4. Adipose Tissue as an Endocrine Gland
- In addition to its role in energy storage, it is now thought that adipose tissue acts as an endocrine gland and secretes numerous bioactive mediators which are collectively referred to as adipokines (adipocytokines) [25]. Adipokines are thought to be involved in the regulation of metabolism, lipid uptake, immune response and inflammatory processes [25]. Excess visceral adipose tissue is associated with [25]: 1) Increased levels of inflammatory cytokines, including TNF-alpha (TNF-α), interleukin-6 (IL-6); 2) Altered secretion of metabolic regulators, including increased leptin production, and a decrease in adiponectin (which is thought to have a protective effect against CVD and T2DM). As a result of these changes, metabolic disturbances occur, leading to dyslipidaemia, reduced glucose metabolism, decreased insulin sensitivity, increased inflammation and accelerated atherosclerosis [1].
2. Material and Methods
2.1. Design of Study
- A Case-control analytic cross-sectional study.
2.2. Setting
- This study was carried out at Department of Biochemistry, Department of Biochemistry in collaboration with the Department of General Medicine at S.P. Medical College and Associated group of P.B.M. Hospitals, Bikaner. All participants completed a medical history form and provided informed consent.
2.3. Study Population
- Study was included 400 subjects. These subjects were divided into two groups. Group I/ involved as the prevalence of Metabolic syndrome in an adult population, consist of 200 subjects, male 126 (63%) and female 74 (37%) with MS diagnosed by International Diabetes Federation (IDF) [26]. criteria and 200 healthy, male 114 (57%) and female 86 (43%) and age between 25-65 years control subjects.
2.4. Study Period & Study Approval
- Present study was done from June 2015 to June 2018.The Institutional Ethical Committee at the Sardar Patel Medical College and Associated Group of P.B.M. Hospitals, Bikaner, Rajasthan, India, approved the study.The Developmental Research Committee at the Rajasthan University of Health Sciences, Jaipur, India, was also approved the study.
2.5. Study Protocol
- The following criteria are undertaken for the selection of the patients in the study:- Inclusion Criteria:International Diabetes Federation (IDF) 2005 [26] criteria for Metabolic Syndrome as follows: Exclusion Criteria: Serious ill/moribund patient, Severe hepatic or renal disease, Cancer, Severe psychiatric disorder (e.g. schizophrenia), Stroke, Pregnant women, Autoimmune diseases, Familial hyperlipidemia and patients taking lipid lowering medication and with a history of abdominal surgery, which could have an impact on abdominal fat distribution, were excluded from the study.
2.6. Anthropometric and Biochemical Analysis
- Procedural stepsAt the time of presentation demographic details were recorded and complete history was obtained regarding the presence of Metabolic Syndrome with Coronary Heart Disease & Type 2 Diabetes, hypertension, any inflammatory disease, joint pains, infections, hyperlipidemias, endocrine disorders, allergies, and smoking habits. Drug history was also obtained. The details noted on a questionnaire and the patients consent were also taken an account before initialization of the study.- Detailed clinical history- General physical examinationMeasurements of adiposityBody Mass Index (BMI) computed as the ratio of weight (kg) to the square of height (m) (kg/m2). Waist Circumference defined as the average of two measurements taken after subject inspiration and after expiration (mean difference between the two measurements, ≅1.5 cm) at the midpoint between the lowest rib and the iliac crest. Waist-hip ratio defined as the ratio of waist girth to the circumference of the hips measured at the trochanter major.Blood Pressure:Study subjects blood pressure was measured with a random zero mercury Sphygmomanometer. The measurement protocol included, after a supine rest of 5 minutes, three measurements in the supine position, one in the standing position, and two in the sitting position at 5-minute intervals. The mean of all six measurements was used as the systolic and diastolic blood pressures.Biochemical determinations:Subjects were asked to fast for 12 hours before blood sampling. They were also asked to refrain from smoking for 12 hours and from consuming alcohol for 3 days before blood draws.Blood Sample collection:-Venous blood samples were collected in test tube with aseptic precautions. After 2 hours of collections sample was centrifuged at 3000 rpm for 5minutes. Serum was separated and collected in polythene tube with cork. The sera with no sign of hemolysis used for the analysis of all biochemical parameters.Investigations1) Markers of Insulin Resistance:Fasting blood glucose (FBS), Post Parandial blood glucose (PPBS) were measured after overnight fasting by Glucose Oxidase-Peroxidase (GOD-POD) Method using BECKMAN COULTER AU680 Chemistry Analyzer.2) Lipid ParametersTotal Cholesterol (TC) was measured by the enzymatic colorimetric cholesterol oxidase-peroxidase method, High Density Lipoprotein-Cholesterol (HDL-C) was estimated by the cholesterol esterase-peroxidase precipitation method, and Triglycerides (TG) was estimated by the GPO-PAP-enzymatic colorimetric method. All these parameters absorbance were done on BECKMAN COULTER AU680 Chemistry Analyzer. Low Density Lipoprotein Cholesterol (LDL-C) levels were calculated with the Friedwald equation. 3) Adiponectin EstimationSerum Adiponectin concentration was measured using ALPCO, USA, High Molecular Weight (HMW) & Total Adiponectin ELISA kit for research use only.4) Leptin EstimationSerum Leptin concentration was estimated using Diagnostic Automation, Inc., USA, Microwell ELISA kit for research use only.5) Free Fatty AcidSerum Free Fatty Acid concentration was estimated using SIGMA ALDRICH, USA, Free Fatty Acid Quantitation kit, ELISA kit for research use only.Statistical AnalysisNumerical variables were reported in terms of mean and standard deviation. Statistical analysis of results was done by normal distribution ‘Z’ test. In this analysis, variables showing p value less than 0.05 and 0.001 were considered to be statistically significant and highly significant respectively. Correlation coefficient (r) was calculated for finding correlation between two biochemical parameters by using Pearson two-tailed analysis.
3. Results
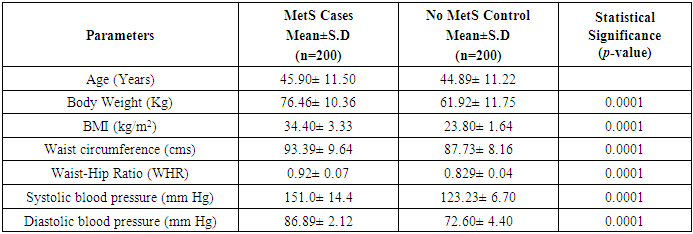
- Table 1 shows the anthropometric measurements of the subjects of both metabolic syndrome (n=200) and non-metabolic syndrome (n=200). As expected, mean levels of BMI, Waist Circumference (WC), Hip Circumference (HC), Waist to Hip Ratio (Wc/Hc), Systolic blood pressure (SBP), Diastolic blood pressure (DBP) showed marked difference and were statistically significantly increased (P<0.0001) in both the groups.
|
|
3.1. Comparison of Clinical, Metabolic and Anthro Pometric Characteristics, Results According to the MetS (Table 3)
- This study included a total of 400 subjects (126 males and 74 female with MetS), (114 males and 86 female with Non-MetS) aged between 25 to 65 years. Table 3 shows the anthropometric, lipid profile and clinical characteristics of the study population. Among normal-weight Control group, means of SBP(P=0.068), DBP(P=0.66), FBS(P=0.29), PPBS(P=0.583), TC(P=0.43), TG(P=0.172), HDL(P=0.02), LDL(P=0.379), VLDL(P=0.169) and FFA(P=0.937) were significantly higher in males than females.
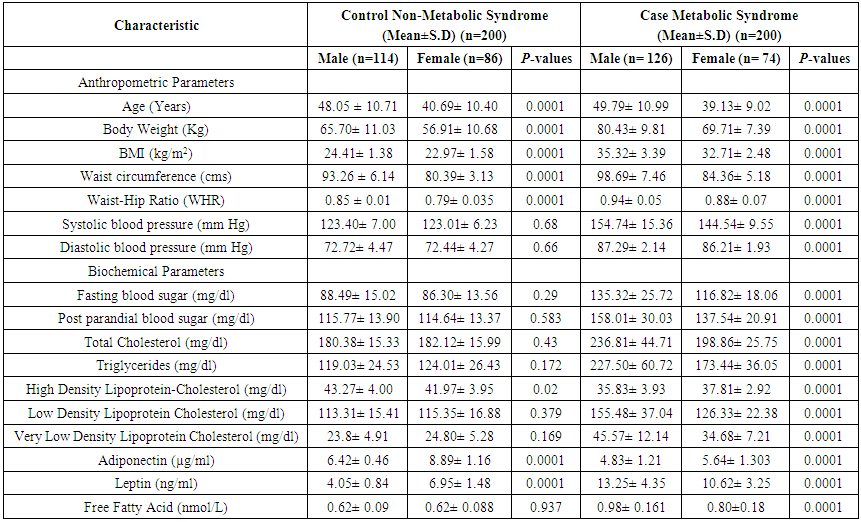 | Table 3. Clinical, metabolic and anthropometric characteristics, adjusted for age and sex, in healthy lean control subjects with metabolic syndrome |
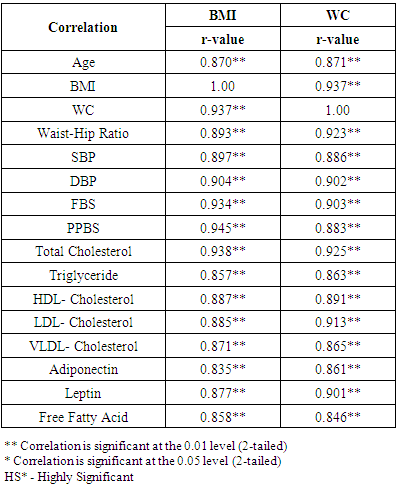
3.2. Correlation Coefficient between Variables with Anthropometric Indices Markers of Insulin Resistance and Lipid Profile with Metabolic Syndrome Cases (Table 4)
- BMI and WC were significantly correlated with Age (r=0.870; r=0.871), BMI (r=1.00; r=0.937), WC (r=0.937; r=1.00), Waist-Hip ratio (r=0.893; r=0.923), Systolic blood pressure (r=0.897; r=0.886), Diastolic blood pressure (r=0.904; r=0.902), Fasting blood sugar (r=0.934; r=0.903), Post Parandial blood sugar (r=0.945; r=0.883), Total Cholesterol (r=0.938; r=0.925), Triglycerides (r=0.857; r=0.863), High-density lipoprotein (HDL) cholesterol (r=0.887; r=0.891), Low-density lipoprotein (LDL) cholesterol (r=0.885; r=0.913), Very Low-density lipoprotein (VLDL) cholesterol (r=0.871; r=0.865).Adiponectin (r=0.835; r=0.861), Leptin (r=0.877; r=0.901) and Free fatty acid (r=0.858; r=0.846) respectively (BMI; WC) all correlation were found to be statistically significant at the 0.01 level (2-tailed).
|
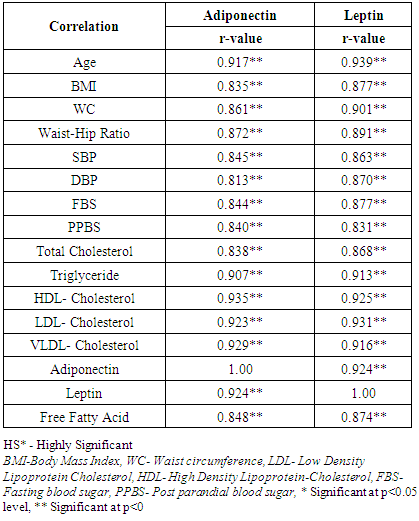
3.3. Correlation of Adiponectin, Leptin with Anthropometric Indices Markers of Insulin Resistance and Lipid Profile with Metabolic Syndrome Cases (Table 5)
- Table 5 depicts the correlation coefficient analysis between variables of Adiponectin and Leptin in subjects with Metabolic syndrome group. In the whole group, Adiponectin was correlated positively with leptin (r=0.924; P<0.001).
|
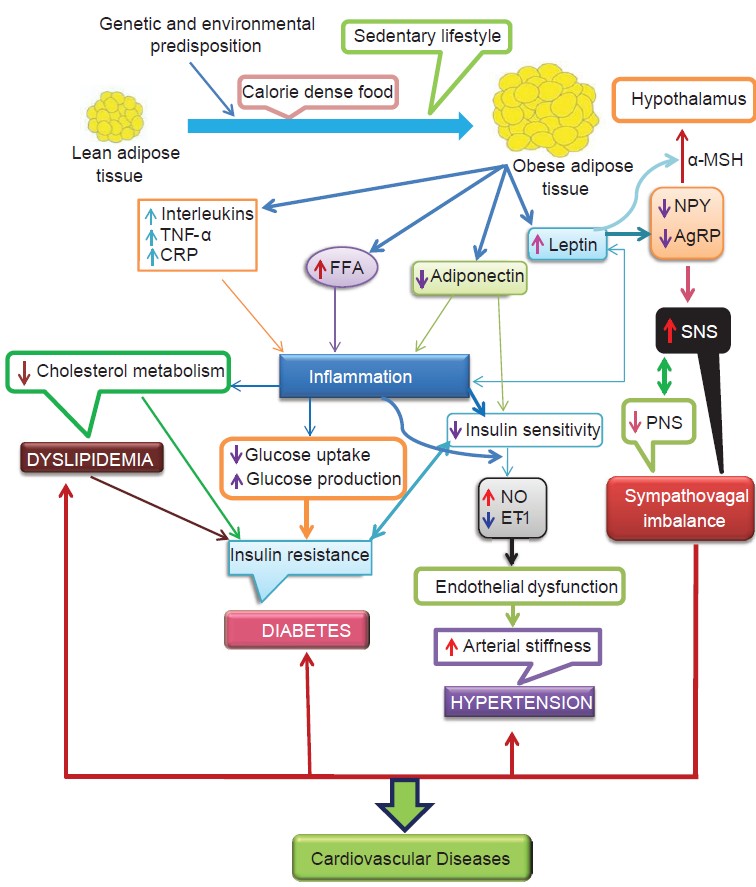 | Figure 1. (Adapted from Potenza et al; Am J Physiol Heart Circ; 2005.) [63] |
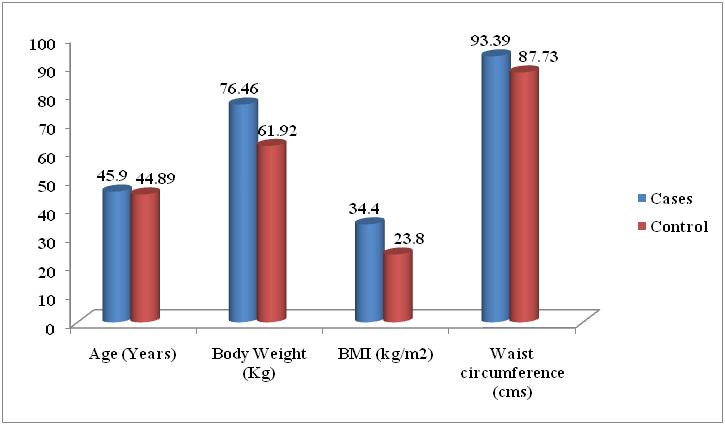 | Figure 2. Comparison of Mean of Anthropometric Parameters of the Metabolic Syndrome and without Metabolic Syndrome Control Subjects |
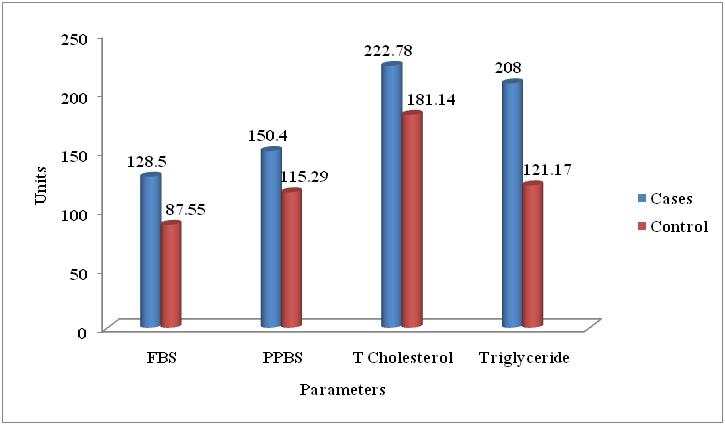 | Figure 3. Comparison of Mean of Biochemical Parameters of the Metabolic Syndrome and without Metabolic Syndrome Control Subjects |
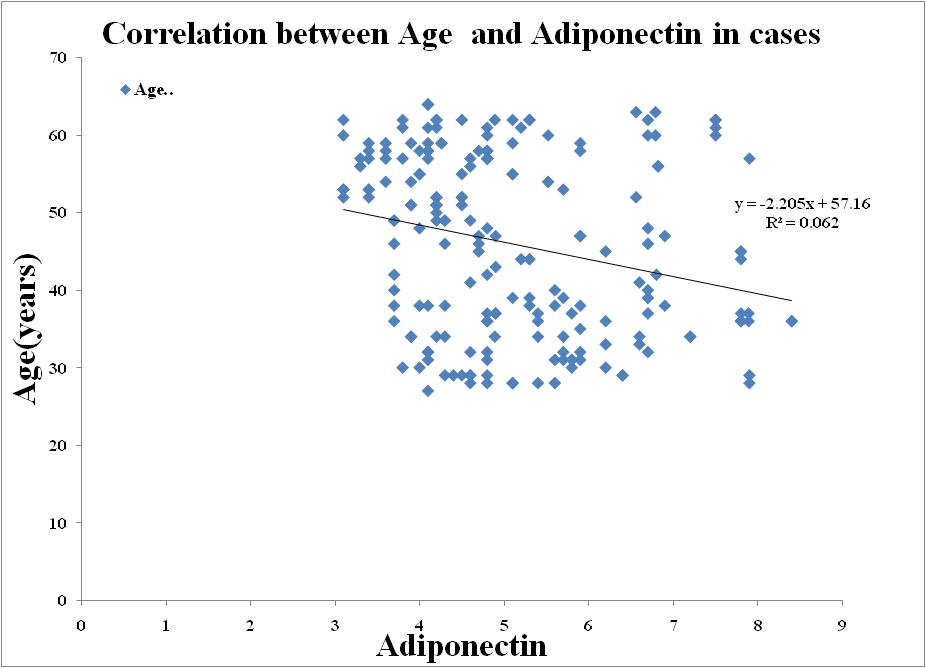 | Figure 4. Correlation between Adiponectin and Age in Metabolic Syndrome |
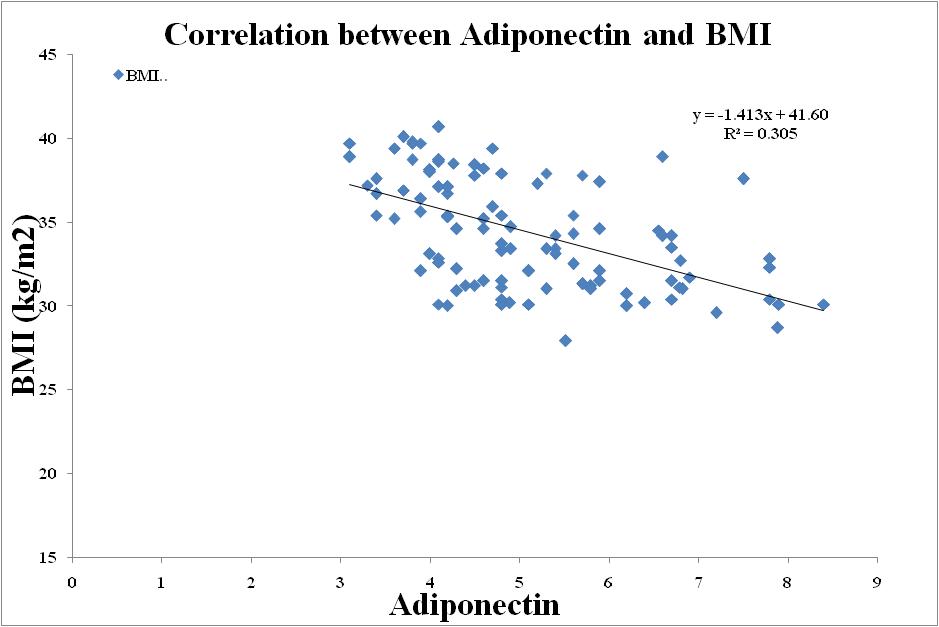 | Figure 5. Correlation between Adiponectin and BMI in Metabolic Syndrome |
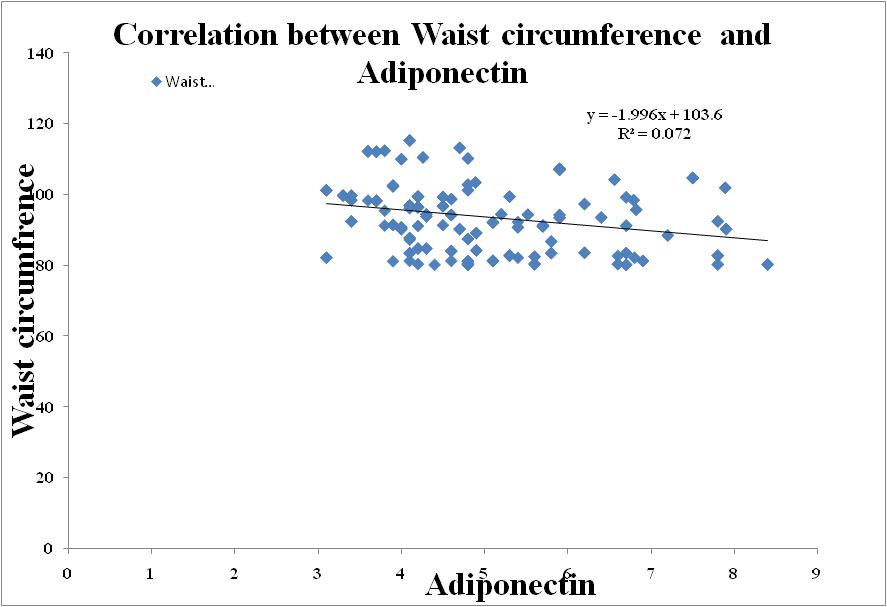 | Figure 6. Correlation between Adiponectin and Waist circumference in Metabolic Syndrome |
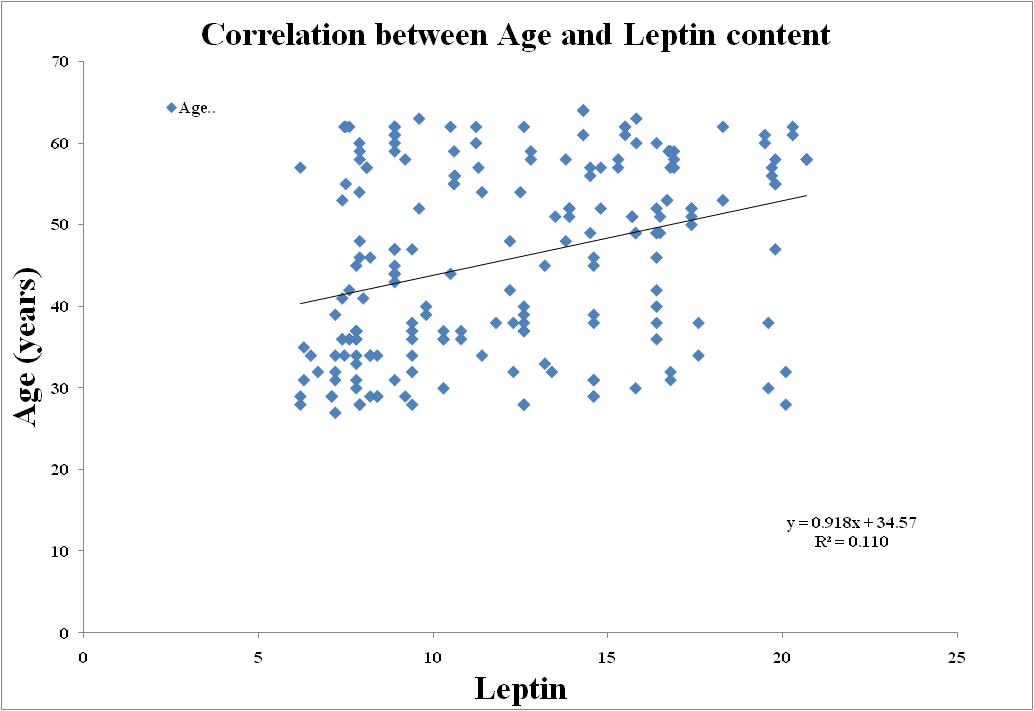 | Figure 7. Correlation between Leptin and Age in Metabolic Syndrome |
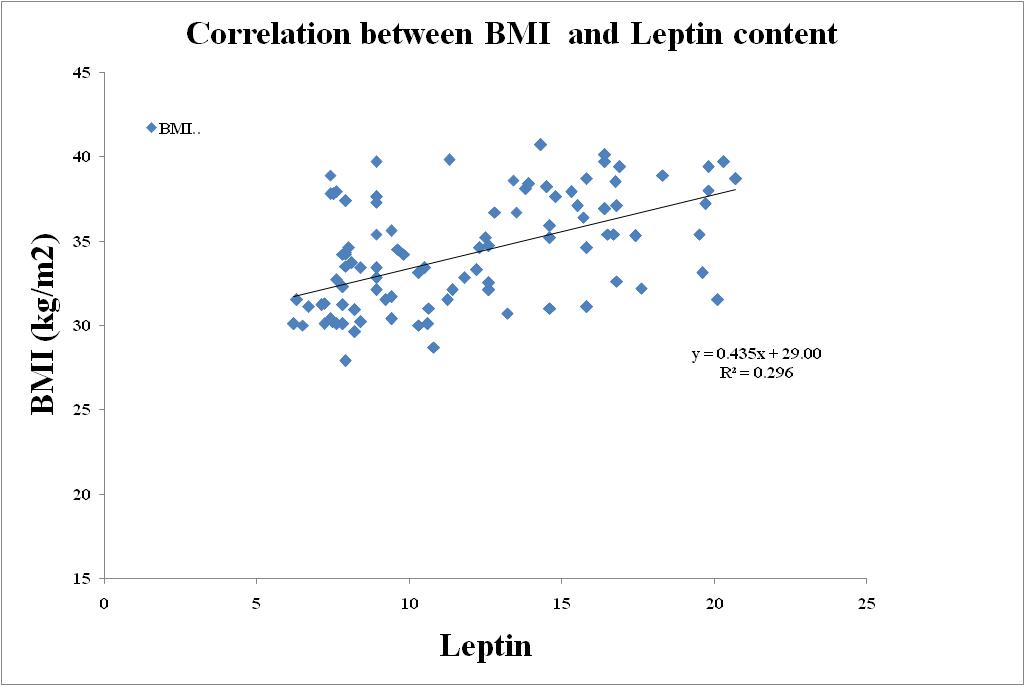 | Figure 8. Correlation between Leptin and BMI in Metabolic Syndrome |
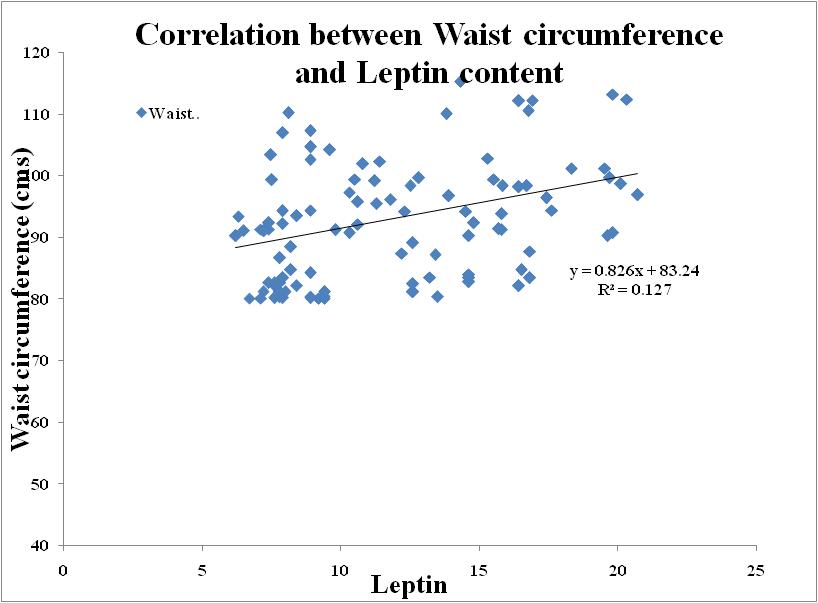 | Figure 9. Correlation between Leptin and Waist circumference in Metabolic Syndrome |
4. Discussion
- MetS is known to strongly predict long term risk of diabetes and CVD, and has also been reported to be associated with increased morbidity and mortality. [27] It is becoming increasingly common in the United States and worldwide, and is emerging as the dominant risk factor for CVD in Asia. [28-30]. The MS represents a combination of risk determinants, which include atherogenic dyslipidemia, elevated blood pressure, elevated glucose, aprothrombotic state, and a proinflammatory state. [27] In obese persons, adipose tissue products are reported to affect systemic metabolism; among these are adiponectin, leptin, free fatty acid inflammatory cytokines, PAI1, resistin, and angiotensinogen. [31] In this study, we evaluated 200 subjects with MS (126 males and 74 females) and 200 controls (114 males and 86 females). Different definitions have been proposed for MS. [32] We have used here IDF criteria as it provides ethnic specific criteria for central obesity. All cases had significantly higher WHR, BMI¸ BFM and PBF than controls in both the sexes, which is similar to Asian Indian obesity phenotype. [32]Subjects with MS had significantly lower adiponectin levels than controls. Low adiponectin levels have been reported in most of the studies on MS among people of various age groups, ethnicity and gender [33-41]. However, one study reported higher adiponectin levels in MS [42] and another found low adiponectin level which was statistically not significant [43]. Similar observations have been reported by other studies. [37, 41, 44] There was no difference in adiponectin levels between sexes. However, others [34, 44, 45] have reported higher adiponectin levels in females. Adiponectin was negatively related with age, BMI, BFM and PBF, WHR, FPG, hypertension, TG, TC, hsCRP, fibrinogen, HOMAIR and PAI1, and positively related with BMR, HDL and HOMAS in the present study. Similar associations have been reported in the literature [40, 46-51].Adipose tissue has been postulated to play a prominent role in both insulin resistance and the clinical expression of the metabolic syndrome, most likely mediated by increased release and peripheral tissue action of NEFA and by dysregulated production of adipocyte-secreted proteins, including leptin, adiponectin, resistin, TNF-_, and IL-6 [52-55]. Of these proteins, adiponectin has recently been proposed as an important mediator of insulin action and glucose metabolism [56]. Adiponectin has been reported to be decreased in obesity and type 2 diabetes and to be inversely correlated with insulin and TG levels and positively correlated with HDL-C levels [57, 58]. The present study confirms and extends these associations by demonstrating that plasma adiponectin levels are significantly lower in obese individuals with the metabolic syndrome when compared with obese individuals, matched for age and BMI, who do not have the metabolic syndrome. Furthermore, stepwise decreases in adiponectin were observed with increasing numbers of metabolic syndrome components. The predictive ability of adiponectin to distinguish the MS_ from the MS_ obese subjects remained significant after adjusting for both weight and BMI, suggesting that adiponectin may contribute to the expression of the metabolic syndrome phenotype independent of total adiposity. When each component of the metabolic syndrome was introduced separately as a covariate, the predictive ability of adiponectin to distinguish the MS_ from the MS_ obese subjects did not change substantially after adjusting for each variable but became non-significant after adjusting for HDL-C, suggesting an important role of adiponectin in modulating HDL metabolism.Another aim of the investigation was to evaluate the relationship between leptin levels in obesity associated or not with MS. In total population, leptin levels were positively correlated to BMI, WC, HC and SBP. These results clarified the association of leptin with obesity, confirming earlier findings [59, 60]. Furthermore, plasma leptin concentrations were higher in obese subjects with and without MS, with a minor decrease in the last one. According to the study of Paz-Filho et al. [61], the production of leptin by the adipose tissue is reduced in obese subjects meeting three or more criteria of MS, which explain the slight decrease in leptin levels observed in the Ob-MS group compared to the Ob group.The mechanism by which leptin levels decrease in presence of MS is still unclear, this finding suggest a state of relative leptin deficiency in obesity associated with more advanced stages of MS. Additional studies are needed to verify this hypothesis and if it proves in the future to be true, leptin can be useful in selected obese patients to prevent or to ameliorate some components of MS.Within the total population there was a positive correlation of leptin with Wc and Hc but waist and hip circumference ratio has not shown such correlation. This is probably due to the association of Wc/ Hc ratio with elevated levels of abdominal fat easily mobilized during android obesity, like in obese adolescent [62]. Or, probabely, another explanation is that it lies in a small sample from the general population and some associations may be not detected because we lack some statistical power.Non-Esterified Fatty Acids (NEFA) play a complex role in glucidic homeostasis. This role led us to investigate their quantification in obese patients with and without metabolic syndrome. We found that plasma NEFA levels are elevated in obesity, mainly when it is associated with MS. Our results are consistent with earlier research. Thus, in all major insulin target organs (skeletal muscle, liver, endothelial cells), NEFA cause insulin resistance and have emerged as a major link between obesity, the development of MS, and atherosclerotic vascular diseases [63].
5. Conclusions
- In conclusion, circulating total adiponectin and HMW adiponectin levels were decreased and leptin levels were increased in subjects with metabolic syndrome and type 2 diabetes. In our results demonstrate a positive relationship between Adiponectin, Leptin levels, Free fatty acid and parameters of metabolic syndrome, including BP values in normotensive subjects with overweight/obesity. Serum concentrations of Leptin are associated with central body fat distribution. Insulin resistance and Adiponectin are associated with Dyslipidemia and these all disorders may ultimately lead to metabolic syndrome. Adiponectin, Leptin levels, Free fatty acid could be used as markers of metabolic syndrome development in adolescents. Obesity and related disturbances put these adults at a higher cardiovascular risk. Hence there is an urgent need for public health measures to prevent the ongoing epidemic of diabetes and CVD. Further research is encouraged to determine the efficacy of applying these biomarkers to diagnosis and treatment in a clinical setting.
ACKNOWLEDGEMENTS
- This work was supported by Dr. R.P. Agarwal, Principal, Sardar Patel Medical College, Bikaner.Dr. R.K. Vyas, Sr. Professor & Head, is the guarantor of this work and, as such, had full access to all the data in the study and takes responsibility for the integrity of the data and the accuracy of the data analysis.Dr. Yogita Soni, Professor, Guide & the study principal investigator. The authors are grateful to Professor for her helps in scientific discussion and English revision.
Abbreviations
- MetS: Metabolic syndrome; BMI: Body mass index; WC- Waist circumference, LDL- Low Density Lipoprotein Cholesterol, HDL- High Density Lipoprotein-Cholesterol, FBS- Fasting blood sugar, PPBS- Post parandial blood sugar; CVD: Cardiovascular disease; HDL: High density lipoprotein; hs-CRP: High sensitivity C-reactive protein; LDL: Low density lipoprotein; MS: Metabolic syndrome; T2DM: Type 2 diabetes mellitus; NEFA: Non-Esterified Fatty Acids.