-
Paper Information
- Previous Paper
- Paper Submission
-
Journal Information
- About This Journal
- Editorial Board
- Current Issue
- Archive
- Author Guidelines
- Contact Us
American Journal of Biochemistry
p-ISSN: 2163-3010 e-ISSN: 2163-3029
2017; 7(5): 91-99
doi:10.5923/j.ajb.20170705.02

The Plasma Level of miRNA-133a as a Novel Biomarker for Prediction of Left Ventricular Hypertrophy and Dysfunction in Hemodialysis Patients
 Abstract
 Reference
 Full-Text PDF
 Full-text HTML
Asmaa A. Elmadbouly 1, Rehab M. Hamdy 2, Amany M. Elsaeed 1, Maha A. Hassan 3, Nadia A. Agiba 2, Hayam H. Mansour 3, Abeer M. Shawky 2
1Department of Clinical Pathology, Faculty of Medicine (for girls), Al-Azhar University, Cairo
2Department of Cardiology, Faculty of Medicine (for girls), Al-Azhar University, Cairo
3Department of Internal Medicine, Faculty of Medicine (for girls), Al-Azhar University, Cairo
Correspondence to: Asmaa A. Elmadbouly , Department of Clinical Pathology, Faculty of Medicine (for girls), Al-Azhar University, Cairo.
| Email: |  |
Copyright © 2017 Scientific & Academic Publishing. All Rights Reserved.
This work is licensed under the Creative Commons Attribution International License (CC BY).
http://creativecommons.org/licenses/by/4.0/

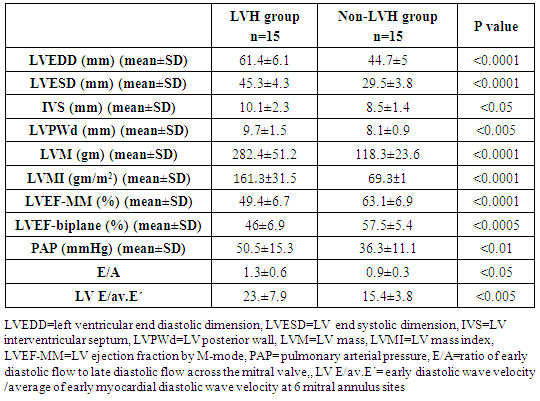
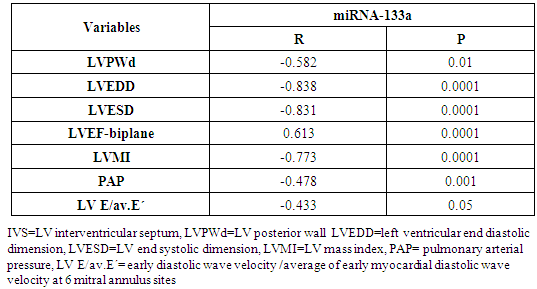
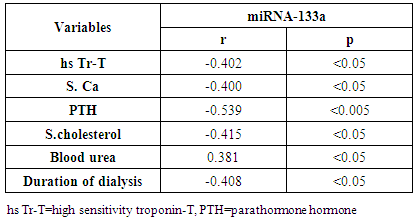
Background: Patients with end stage renal disease (ESRD) exhibit high cardiovascular risk related to high incidence of cardiac hypertrophy, cardiomyopathy, heart failure, and coronary artery disease. Early identification of ESRD patients with heightened cardiovascular risk is crucial for further prognosis and tailored therapy. MicroRNAs (miRNAs) have emerged as new biomarkers for additional clinical assessment and to increase the ability for classification of vulnerable ESRD patients with cardiovascular risk. Aim of this work was to measure the circulating levels of miRNA-133a in ESRD patients on regular hemodialysis (HD) compared to healthy persons and to detect the correlation between miRNA-133a levels with left ventricular mass and function. Patients and methods: The present study included 30- ESRD patients on regular HD who were allocated from the nephrology unit, internal medicine department, Alzahraa university hospital. They were compared to 15 age matched apparently healthy volunteers as a control group. Comprehensive conventional echo Doppler and tissue Doppler imaging were performed for both control group and patients immediately after dialysis including assessment of left ventricular (LV) function, LV mass and LV mass index (LVMI) to detect left ventricular hypertrophy (LVH). Patients were classified according to Echo into group I: patients with LVH, group II: patients without LVH. Serum level of high sensitive troponin-T (hs Tr-T) measured by electrochemiluminescence assay and plasma miRNA-133a levels were measured by real time PCR for all patients and control group. Results: The average levels of plasma miRNA-133a were significantly decreased in LVH- HD group compared to non-LVH HD group and healthy controls. The plasma levels of miRNA-133a were negatively correlated with LVMI (r=-0.773, p<0.0001) and LV diastolic function (r=-0.433, p<0.05). A positive correlation was found between miRNA-133a and LVEF-biplane (r=0.613, p<0.0001). We found positive correlation between hsTr-T with LVMI (r=0.574, p<0.0001) while hs Tr-T was negatively correlated with LVEF-biplane (r=-0.434, p<0.05). Conclusion: The levels of miRNA-133a are markedly decreased in HD patients with LVH compared to those without LVH and to control group. The down-regulation of miRNA-133a was associated with more prominent cardiac hypertrophy and more sever LV diastolic dysfunction and significant impairment of LV systolic function. We hypothesize that plasma level of miRNA-133a can be used as a novel biomarker for predicting cardiac hypertrophy and left ventricular dysfunction in HD patients.
Keywords: ESRD, Hemodialysis, LVH, LVMI, miRNA-133a, hs Tr-T
Cite this paper: Asmaa A. Elmadbouly , Rehab M. Hamdy , Amany M. Elsaeed , Maha A. Hassan , Nadia A. Agiba , Hayam H. Mansour , Abeer M. Shawky , The Plasma Level of miRNA-133a as a Novel Biomarker for Prediction of Left Ventricular Hypertrophy and Dysfunction in Hemodialysis Patients, American Journal of Biochemistry, Vol. 7 No. 5, 2017, pp. 91-99. doi: 10.5923/j.ajb.20170705.02.
Article Outline
1. Introduction
- Cardiovascular disease (CVD) is the leading cause of death in end stage renal disease (ESRD) patients, accounting for 50% of all deaths. In ESRD patients, the more frequent and major pathological finding is left ventricular hypertrophy (LVH) [1]. Moreover, LVH is well known to be an important independent predictor of cardiovascular mortality among ESRD patients [2].Several imaging modalities such as echocardiography, magnetic resonance imaging and computerized tomography have been performed to measure LVH [3]. Echocardiography is widely available, noninvasive, and with a reasonable accuracy in the assessment of LVH. In addition, several studies used serum biomarkers to predict LVH [2]. Identifying serum biomarkers that are useful in screening and profiling cardiovascular risk of LVH is an important goal in the treatment of hemodialysis patients [4].MicroRNAs (miRNAs) are endogenous small non-coding RNA molecules that post-transcriptionally regulate gene expression. Expression of miRNA in vivo has revealed its important role in controlling heart function and structure. In fact, abnormal expression of miRNAs may initiate and contribute to the progress of heart disease [5]. MiRNAs are prerequisite for various cardiovascular (CV) conditions such as hypertrophy, heart failure (HF), and acute coronary syndromes. It is postulated that miRNAs is circulating freely in the bloodstream with marked bio-stability, and can be detected with high sensitivity and specificity in human plasma and serum [6]. Previous studies have found that miRNA-133a level was decreased in hypertrophic heart [6]. We aimed to measure the changes of circulating level of miRNA-133a in patients with ESRD patients on regular HD compared to healthy volunteers and to determine the correlation between dysregulated miRNAs with LV mass and function.
2. Patients and Methods
2.1. Patients
- This cross sectional observational study was conducted on 30 ESRD patients on regular HD through arteriovenous fistula (AVF) and 15- age matched healthy subjects. Patients were allocated from the nephrology unit of internal medicine department Alzahraa university hospital, in the period from January 2016 to June 2016. Written informed consents were taken from all patients. They were receiving bicarbonate base dialysate using low flux dialyzer with an average blood flow 300-350 ml/min, 3 times/week each session for 4 hours duration. All studied patients aged were over 18 years of age.We excluded patients with acute coronary syndrome, valvular heart disease, congenital heart disease, pregnancy, liver failure, chronic systemic inflammatory conditions, and known malignancies.
2.2. Methods
- All patients and control groups were subjected to:1. History and Examination:• Medical history was taking including causes of CKD, history of chronic disease, chest pain, symptoms suggestive heart failure or liver cell failure, and duration of dialysis. • Thorough clinical examination including blood pressure, general examination and cardiac examination of all patients and control groups. 2. Evaluation of LV functions and hypertrophy using transthoracic echocardiography:Both patients and control persons were evaluated with transthoracic echocardiography (TTE). TTE was done immediately after the dialysis session.TTE examination was performed using Vivid E9 GE, Vingmed ultrasound AS Strandpromenaden, Horten Norway echo machine with (M5Sc) matrix probe (1.5-3.6 MHz). Comprehensive trans-thoracic M-mode, 2Dimensional (2D), and Doppler were done in standard views (parasternal long axis, parasternal short axis, apical four and two chamber views).All cardiac chamber measurements were made as suggested by the American Society of Echocardiography, including LV end-diastolic diameter (LVEDD), LV end-systolic diameter (LVESD), end-diastolic interventricular septum thickness (IVS), end-diastolic LV posterior wall thickness (LVPWd) were measured using two-dimensional (2D), or M-mode images taken from parasternal long axis views of the LV. [7].From 2D images of the LV obtained from apical four and two-chamber views, LVEF (%) was calculated using biplane disk summation [8].LV mass was calculated using the Devereux formulaLV mass (g) = 1.04 x [(LVEDD + IVS + LVPWd)3 - (LVEDD)]3 - 13.6, where 1.04 (g/cm2) is the specific gravity of the myocardium. LV mass index (LVMI, gm/m2) was defined as LV mass divided by body surface area (m2). Reference upper limits of normal LVMI by linear measurements are 95 gm/m2 in women and 115 gm/m2 in men [8].Pulmonary artery systolic pressure (PAP) was estimated by multiplying the square of the peak tricuspid regurgitant flow velocity by four (modified Bernoulli equation) and adding the right atrial pressure as estimated from the change in inferior vena caval diameter with inspiration.The mitral annular early diastolic velocity (LV E') by pulsed wave tissue Doppler was obtained in 6 mitral annular sites (lateral, septal, inferio, anterior, posterior and antroseptal) then averaged to calculate av.E'. LV diastolic function was evaluated by obtaining the ratio of LV E/av.E´= early diastolic wave velocity of the mitral valve flow /average of early myocardial diastolic wave velocity at 6 mitral annulus sites.3. Laboratory investigations: Seven ml of venous blood were collected under complete aseptic conditions from each subject, an hour before the dialysis cession, divided in three vacutainer tubes. Each of the first and second tubes contained 2 ml anticoagulated blood with disodium EDTA. One for CBC which was done on sysmex Kx-21 N, Japan, the other one was centrifuged at 3000 rpm for 20 minutes and the plasma was stored at -20°C until extraction of miRNA, reverse transcription and real time polymerase chain reaction were accomplished. The remaining 3 ml of venous blood were collected in serum separator tube, allowed to stand at room temperature for 30 minutes and then centrifuged at 3000 rpm for 20 minutes; serum was removed and divided into two portions, the first portion used for measurement of urea, creatinine, cholesterol, triglycerides, calcium, phosphorus and high sensitive troponin T levels which were done on Cobas c 311 Autoanalyzer (Roche – Germany) and the second portion for measurement of parathormone hormone (PTH), which was measured on Cobas e 411 auto-analyzer, (Roche, Germany) by electrochemiluminescence assay. Plasma miRNA 133a measurement:1- RNA extraction:-Total RNA was extracted from plasma samples using the miRNeasy Mini Kit (Qiagen, USA, cat.no. 217004) according to the manufacturer's instruction. Briefly 200 μL of plasma was mixed with 1000 μL (5 volumes) Qiazol lysis reagent and incubated for 5 minutes at room temperature. Then 200 μL (1 volume) of chloroform was added and the tube was vortexed vigorously for 15 seconds. After 3 min incubation at room temperature, the tube was centrifuged at 12,000 xg for 15 min, in which the sample was separated into 3 phases; an upper colorless aqueous phase containing RNA, a white interphase and a lower red organic phase. 600 μL of the upper aqueous phase was transferred into a 2 ml sample tube and placed in Qiacube (Qiagen, USA.cat N: 9001292) for automated extraction of miRNA using RNeasy Mini Spin column according to manufacturer's instruction.The RNA purity and concentration in the extract was assessed by the Nano Drop ND-1000 (Nano drop, United States).2- Reverse transcription:-Extracted RNA was reverse-transcribed into cloned DNA using the miScript II RT Kit (Cat. No 218161) according to the manufacturer’s instruction. Briefly, 2 μL of miScript reverse transcriptase Mix, 2 μL of 10 x miScript Nucleics Mix, 4 μL of 5 x miScript Hispec buffer, 10 μL RNase-free water and 2 μL 10 x miScript primer Assay which contains miRNA-specific primer are placed in each PCR tube and the template RNA was added to each tube with a total volume is 20 μL/reaction. After gentle mix and brief centrifugation, the tubes are placed in Rotor gene cycler and the run conditions were adjusted as follows: incubation for 60 min at 37°C, then incubation for 5 min at 95°C to inactivate miScript reverse transcriptase mix.3- RNA quantification:PCR quantification was performed with real time PCR using the SYBR Green PCR Master Mix (Qiagen, USA, catalogue number 218073) according to the manufacturer’s protocol. The primers for miRNA-133a and pooled equal volumes of let 7dgi as the endogenous control were supplied by Qiagen, USA, Cat N 218300. The primer sequence of miRNA-133a was UUGGUCCCCUUCAACCAGCUGU. The PCR reaction was done on rotor gene Q 5 plex (Qiagen, USA) with the following cycling conditions (initial activation step at 95 C for 15 min followed by 40 cycles of denaturation at 94 C for 15 s., annealing at 55 C for 30 s., and extension at 70 C for 30 s.). Fluorescence measurements were made in every cycle. Melting curve analysis was performed after the thermal profile to ensure specificity in the amplification. Temperature increased very slowly (from 65°C to 95°C) with monitoring of fluorescence signal. Calculation of PCR results: The ΔCt was calculated by subtracting the Ct values of miRNA let 7dgi from the Ct values of the target miRNA133a. As there is an inverse correlation between ΔCt and miRNA expression level, lower ΔCt values were associated with increased miRNA. The resulting normalized ΔCt values were used in calculating relative expression values of individual miRNAs by using 2-ΔΔ(Ct) method these values are directly related to the miRNA expression levels. Patients were classified according to the presence and absence of LVH defined by echocardiography into 3 groups:Group I: including patients with LVHGroup II: including patients with non LVHGroup III: apparently healthy persons as controlStatistical analysisResults were analysed using the SPSS software (version 16.0; SPSS Inc., Chicago, IL, USA). Descriptive statistics were presented as percentages, means and standard deviations (SD). The parameters with normal distribution were expressed as the mean 1 SD. Univariate analysis for group comparisons were performed using the Student’s t-test and one-way ANOVA. The associations between variables were assessed by Pearson, Spearman’s r correlation analysis and liner regression analysis. P < 0.05 was accepted as statistically significant.
3. Results
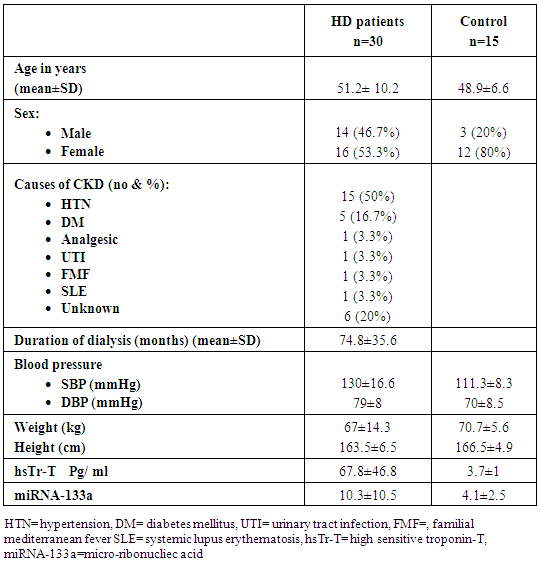
- Thirty patients with ESRD on regular HD were studied, out of them 14 (46.7%) were males and 16 (53.3%) were females, their mean age was 51.2 ±10.2 years and mean duration of dialysis 74.8 ±35.6 months.The most common causes of ESRD was hypertension (HTN) which was found in 15 (50%) patients followed by diabetes mellitus found in five (16.7%) patients (Table 1).
|
|
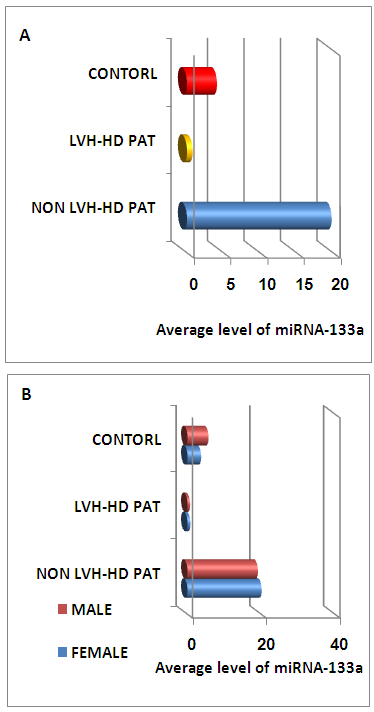 | Figure (1). The average level of miRNA-133a in all studied groups (A) and level of miRNA-133a with among male and female in all studied groups (B). LVH=left ventricular, HD=hemodialysis |
|
|
|
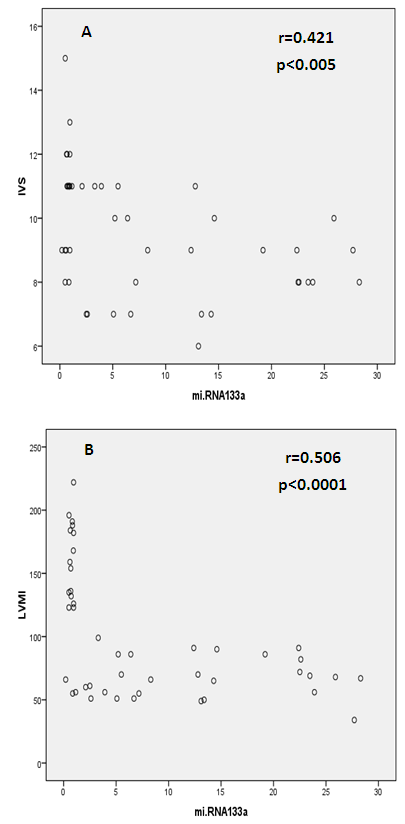 | Figure (2). Correlation between the plasma level of miRNA-133a and both IVS and LVMI in HD patients. Liner regression analysis showed that miRNA-133a levels were negatively correlated with (A) IVS and (B) LVMI, the correlation coefficient was 0.421 and 0.502 respectively. LVMI=left ventricular mass index, IVS=interventricular septum |
|
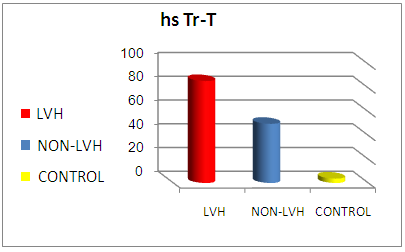 | Figure (3). Comparison of mean hsTr-T level between all studied groups (LVH group, non- LVH group and control group) |
|
4. Discussion
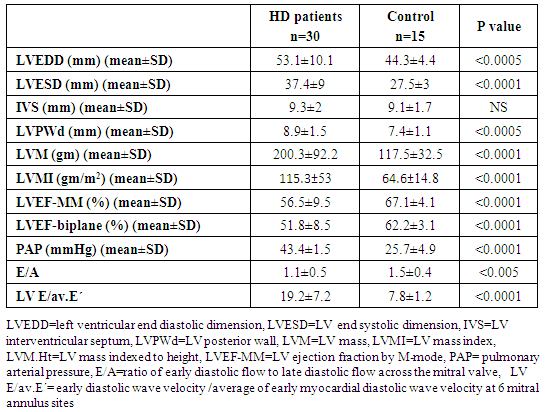
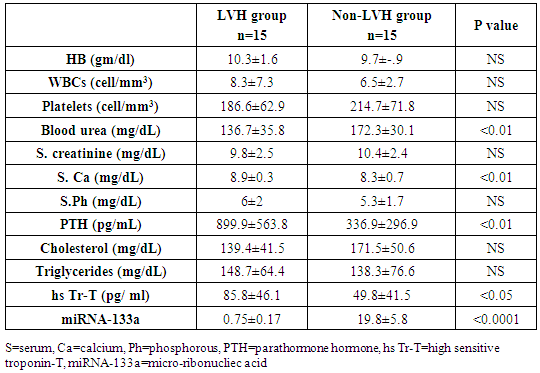
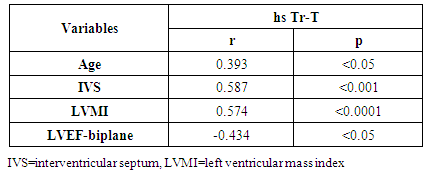
- Cardiac hypertrophy is an important compensatory mechanism of the heart in response to diverse pathophysiological stimuli. Initially, the response aims to normalize wall stress and preserve contractile performance but chronically it produces hypertrophy and may eventually lead to heart failure [5]. Cardiac abnormalities may result from a variety of causes in hemodialysis patients including uremia, fluid retention, chronic volume overload, pressure overload, anemia, high-flow arteriovenous shunting, and hyperparathyroidism [9].Patients with ESRD on HD experience a variety of hemodynamic and metabolic abnormalities that predispose to alterations in LV systolic and diastolic function. Increasing myocardial calcium level, lipid peroxides level, oxidative stress and decreasing antioxidants may affect LV myocardial functions and loading conditions may affect the evaluation of LV functions by echocardiography [10].The coexistence of hypervolemia, hypercirculation, LV hypertrophy, and interstitial fibrosis may predispose to LV diastolic dysfunction [11].Although various pathways provide coordinated control of the hypertrophic process, little is known about their underlying molecular mechanisms. Exposure of the heart to some stressors may lead to cardiac remodeling with a change in the gene expression profile and a detrimental outcome. The involvement of miRNAs in this pathological process is recognized and increasing evidence shows that miRNAs are key modulators of cardiovascular development and function and the process of cardiac hypertrophy [5]. We aimed to study miRNA-133a as cardiac biomarker in the ESRD population for prediction of myocardial hypertrophy and LV dysfunction. This biomarker could play complementary role to echocardiography in evaluating the cardiovascular risk profile of ESRD patients.In the current study, the circulating levels of miRNA-133a were increased in HD patients compared to controls while with further subclassification; we demonstrated that the miRNA-133a level was downregulated in HD patients with LVH in comparison to both non-LVH- patients and healthy controls. During CKD progression, the number of functional nephrons decreases, resulting in accumulation of uraemic toxins that are poorly removed by dialysis [12] and are associated with cardiovascular morbidity and mortality [13, 14]. The accumulation of uremic toxins in CKD induces oxidative stress and endothelial dysfunction. These uremic toxins can dysregulate specific miRNA in endothelial cells, which impairs endothelial cell function and predisposes patients to CVD [13, 14].miRNA-133 has a critical role in determining cardiomyocyte hypertrophy; its over-expression inhibits hypertrophy whereas its suppression induces hypertrophy both in vitro and in vivo [15]. Reciprocal repression between miRNA-133 and calcineurin signaling has been shown to regulate cardiac hypertrophy. Cardiac hypertrophy in vivo and in vitro induced by transverse aortic constriction and phenylephrine (PE) treatment involves increased activity and expression of calcineurin and decreased miRNA-133 expression. Treatment of neonatal rat cardiomyocytes or mice with cyclosporin A, an inhibitor of calcineurin, prevents the down-regulation of miRNA-133. Consistently, antisense oligonucleotides against the catalytic subunit of calcineurin A and nuclear factor of activated T-cells (NFAT)-specific decoy oligonucleotides could increase miRNA-133 expression in cultured primary cardiomyocytes. Gain-of-function approaches also show that miRNA-133 decreases NFAT miRNA levels as well as the hypertrophic response to PE-mediated stimulation in primary cardiomyocytes, and miRNA-133 loss-of-function leads to increased NFAT expression and a spontaneous hypertrophic response [16].Alessandra et al. reported that miRNA-133 is down-regulated in both LVH animal models and patient samples [15]. Later studies demonstrated that silencing of miRNA-133 promotes LVH, while overexpressing them attenuates agonist-induced hypertrophy [16].In consistent to our results, Wen and his colleagues [17] evaluated the circulating miRNA-133a levels in ESRD patients on regular HD and healthy controls and demonstrated that miRNA-133a concentrations were decreased in HD patients with LVH.However, van Rooij and co-workers [18] found that miRNA-133a did not produce any of the morphological changes in cardiomyocytes associated with hypertrophic growth. Overexpression in cardiomyocytes of the miRNAs that were down-regulated during hypertrophy caused an apparent reduction in cell size, an effect opposite that evoked by the up-regulated miRNAs. One interpretation of these results is that these miRNAs normally function to suppress growth and are therefore down-regulated to enhance hypertrophy. Among the miRNAs that were down-regulated during cardiac hypertrophy, miRNA-133 has been reported to repress serum response factor (SRF) [19], a positive regulator of cardiac growth and heart failure [20]. Thus, down-regulation of miR-133 during cardiac hypertrophy would be predicted to result in an increase in SRF expression, which could contribute to the adverse remodeling response [18]. The main findings of our study showed that dysregulated miRNA-133a was negatively correlated with echocardiographically determined LVMI, which is known to be associated with prognosis in patients with ESRD on hemodialysis. Among 30-HD patients included in the study, 63.3% had hypertension of whom 33.3% had LVH and 30% had no LVH. However, miRNA-133a was only down regulated in LVH patients.Parallel to our findings, Wen and his colleagues [17] found that the miRNA-133a level was negatively associated with LVMI, an indicator LVH, in HD patients. Sixty four patients were enrolled in their study, 89.4% had hypertension and about half underwent hypertension more than 5 years, but not all of them had decreased miRNA-133a levels. The significant association between miRNA-133a level and LVMI indicated that circulating miRNA-133a may play an important role in the process of LVH and could be a biomarker of LVH regardless of presence or absence of hypertension.In the present study, miRNA-133a was positively correlated with LV ejection fraction and negatively correlated with LV diastolic function evaluated with E/av.E'. Duisters and his colleagues [21] showed that both miRNA-133a and miRNA-30 directly down-regulate connective tissue growth factor which is associated with fibrosis, and thereby are important in the control of structural changes in the extracellular matrix of the human myocardium.It is important to note that reports about the cardiac effects of specific miRNAs in HD patients are still limited. Troponin T is a strong predictor of adverse outcomes in myocardial infarction and unstable angina [22]. In patients with ESRD, Tr-T is frequently elevated. They stated that cTnT is not only associated to all-cause and cardiovascular mortality but also strongly correlated to LV mass. So, it is suggested to have a role for risk stratification in patients with chronic renal failure [22].We demonstrated that hs Tr-T was highly elevated in HD patients compared to healthy controls especially in those patients with LVH compared to non-LVH. The circulating levels of hs Tr-T was positively correlated with LVMI and negatively correlated with LV systolic function. There is no consensus on the origin of elevated troponins in patients with ESRD. Several hypotheses have been discussed, such as a decreased renal clearance with subsequent accumulation in the circulation. This mechanism is unlikely given that troponins have a molecular weight similar to that of albumin and are therefore unlikely to be filtered at the glomerular level [4]. Furthermore, renal transplantation and improvement in renal function are not associated with normalization of cardiac troponin levels [23]. Other studies have suggested that uremic cardiomyopathy, myocardial hypertrophy, apoptosis, or small areas of silent myocardial necrosis might be involved [4].It is well established that LVH and LV dysfunction entail an ominous prognosis in the dialysis population. LVH in particular constitutes an exceedingly frequent complication and represents the strongest predictor of adverse cardiovascular events in these patients. LV systolic dysfunction has a prevalence rate lower than that of LVH, but it is at least equally vexing in terms of morbidity and mortality [22]. Mallamaci and co-workers [22] reported that Tr-T is strongly related to LV mass in clinically stable HD patients in concordant to our results.Microvascular heart disease is commonly associated with LVH in patients with advanced chronic renal failure [22].In consistent to our findings, Mallamaci and co-workers [22] concluded that Tr-T also is inversely related to systolic function (ejection fraction). Troponin T anchors the troponin complex to tropomyosin during cardiac contraction, and for this reason it is possible that the inverse relationship between systolic function and Tr-T represents another facet of uremic microvascular heart disease.Sharma and his colleagues [24] found that patients with ESRD with raised Tr-T concentrations have increased mortality. Raised concentrations are strongly associated with diabetes, LV dilatation, and impaired LV systolic and diastolic function, but not with severe coronary artery disease.Sharma and his colleagues [24] also concluded that a significant positive correlation exists between serum troponin T concentration and echocardiographic indicators of LVH (LVMI) in HD patients. Patients with higher serum levels of cardiac troponins have lower survival rates during one year follow up.The present study demonstrated a negative correlation between miRNA-133a and hs Tr-T among HD patients. There have not been many efforts to establish the association between specific miRNAs and cardiac troponin which is needed to develop a multifactor diagnostic panel for various vascular diseases [25].
5. Conclusions
- The circulating levels of miRNA-133a are remarkably decreased in ESRD patients on regular hemodialysis with LVH compared to those without LVH and healthy volunteers. The circulating levels of miRNA-133a is closely correlated to both LVMI and both LV systolic and diastolic functions denoting that the downregulation of miRNA-133a levels is associated with more pronounced left ventricular hypertrophy and LV dysfunction. We suggest that the plasma levels of miRNA-133a can serve as a novel biomarker for prediction of cardiac hypertrophy and left ventricular dysfunction in HD patients.
Limitations
- This study is limited by its small size and a larger cohort is required for validation of these results. HD patients differed from controls regarding sex and risk factors. Serial measurement of miRNA levels at periodic intervals may allow the evaluation of the dynamic changes in serum concentration of these molecules in this vulnerable group of patients. miRNA was measured before dialysis session only and post dialysis measurement is recommended in further studies to insure its stability during dialysis process. We included one patient with lupus nephritis who was not in active disease. In addition, various miRNAs pathways (apart from miRNA-133a) had been differently expressed in systemic lupus patients.
ACKNOWLEDGMENTS
- The authors acknowledge Mahmoud M.M. Hassan, Molecular biology specialist, Faculty of pharmacy Cairo University (Mahmoudmohsen92@gmail.com) for his technical support and guidance in miRNA extraction, detection and analysis, done in the molecular biology laboratory in clinical pathology department of ALZahraa university hospital.