-
Paper Information
- Next Paper
- Paper Submission
-
Journal Information
- About This Journal
- Editorial Board
- Current Issue
- Archive
- Author Guidelines
- Contact Us
American Journal of Biochemistry
p-ISSN: 2163-3010 e-ISSN: 2163-3029
2016; 6(6): 137-144
doi:10.5923/j.ajb.20160606.01

Trait Associations of Rice (Oryza sativa) Productivity upon Neem-Based Biopesticide Treatment by SPSS
 Abstract
 Reference
 Full-Text PDF
 Full-text HTML
Puteri Sarah Diba Kamarulzaman, Daniel Joe Dailin, Suzana Yusup, Noridah Binti Osman, Lai Fatt Chuah, Awais Bokhari
Biomass Processing Laboratory, Chemical Engineering Department, Universiti Teknologi PETRONAS, Seri Iskandar, Malaysia
Correspondence to: Suzana Yusup, Biomass Processing Laboratory, Chemical Engineering Department, Universiti Teknologi PETRONAS, Seri Iskandar, Malaysia.
| Email: |  |
Copyright © 2016 Scientific & Academic Publishing. All Rights Reserved.
This work is licensed under the Creative Commons Attribution International License (CC BY).
http://creativecommons.org/licenses/by/4.0/

Chemical pesticides have massive harmful with long-term residual effect on the environment. The bio-efficacy of commercial neem-based biopesticide was tested on the paddy field and compared to the common chemical pesticide practices. This procedure is crucial for the effectiveness evaluation on the actual field. The plant growth development and paddy yield were recorded and the emphasized of this paper is statistical analysis to determine their trait associations. Descriptive statistics for mean, range, standard deviation among selected characteristics such as plant height (113.59 ± 3.79), number of tillers per plant (5.90 ± 0.28) and yield contribution factors such as percentage of productive spikelets (80.86 ± 3.51), 100 grains of weight (2.59 ± 0.01) and grains yield per plant (17.35 ± 2.41) were significantly higher as compared to chemical pesticide practice. The t-test value indicated that biopesticide was significantly higher at 5% level of significance as compared to chemical pesticide for all the characteristics studied except for plant height but still recorded high numbers in biopesticide compared to chemical pesticide practices. The frequency distributions analysis of each yield characteristics shows higher result for each characteristic by using biopesticide compared to chemical pesticide. Biopesticide correlation coefficient analysis revealed grain yield was positively correlated with plant height, 100 grain weight and number of tiller per plant. For chemical pesticide, correlation coefficient analysis revealed grain yield was positively correlated with number of tiller per plant, % of productive spikelet and 100 grain weight. The results indicated that in the biopesticide treatment, the percentage of productive spikelet and 100 grain weight characteristics followed by the plant height were the characteristics related to higher grain yield. By using chemical pesticide, negative correlation between grain yields with the plant height was observed. The above mentioned characteristics along with their indirect causal factors should be considered simultaneously as an effective selection criteria evolving high yielding because of their direct positive contribution to grain yield.
Keywords: Biopesticide, Neem, Rice, Trait, Yield
Cite this paper: Puteri Sarah Diba Kamarulzaman, Daniel Joe Dailin, Suzana Yusup, Noridah Binti Osman, Lai Fatt Chuah, Awais Bokhari, Trait Associations of Rice (Oryza sativa) Productivity upon Neem-Based Biopesticide Treatment by SPSS, American Journal of Biochemistry, Vol. 6 No. 6, 2016, pp. 137-144. doi: 10.5923/j.ajb.20160606.01.
Article Outline
1. Introduction
- Rice is an important staple food in the world especially in Asian countries where it contributes 20% of the world’s dietary energy supply [1]. Most of the population in the world’s depending on rice as the primary daily intake of calories and protein [2]. More rice is needed with increasing human population. With limitation of land the only alternative that has is by increasing the rice productivity per hectare. However, it seems impossible to achieve this task due to various obstacles. Malaysian warm and humid climate attracts numbers of pests such as insects, birds, rodents, rats and snails that severely affect the production of rice leading to reductions in overall rice yield. Pest management is important to sustain yields as well as to increase the efficiency of inputs such as soil, water, energy, labor, genes, or chemicals [3].To avoid damage due to these pests, wide ranges of methods have been applied such as physical, chemical, and cultural methods but chemical spray is the most common practice and has been used extensively for the control of these pests [4]. This is because the direct result after use and easy handling. Therefore, in recent years an increase in the production and consumption of pesticides has been observed [5]. It cannot be denied by using chemical pesticides it could increase agricultural production [5]. However, reliance on chemical pesticides to address this issue could result in ecological adversity and health related problems [6, 7]. It was reported that in a long term, chemical pesticides have massive harmful residual effects not only the soil, health and crop productivity but they also contaminate the ground of water level and assimilated into the food chain in the ecosystem which result in human health hazards [8]. Therefore, the requirement for safer and environmentally friendly forms of pesticide is a must. There are concerted efforts that have been made to utilize organic resources to produce harmless and non-toxic biopesticide that could effectively kill pests. Therefore, biopesticide or botanical pest control was adopted as a new technique underline on environmentally compatible control scopes to substitute the chemical aligned control program [9]. Plant built pesticide is a biopesticide which concentrated starting with those plants that hold numerous dangerous intensify compound to be used for pest control administration action. It is slow-acting crop protectants which give another choice for the synthetic pesticides [10]. The dangerous residues are not detected, less expensive than chemical pesticides when locally produced, least persistence, more effective than chemical pesticides in the long term, easy availability, least toxic to non-target organisms and biodegradable are the most beneficial advantages of biopesticide [11]. Nowadays, about 200 plants with insectidal activities are known [12]. Farmers that are well educated, experienced, familiar with the pesticide benefits, engaged heavily with high shares in the farming activities may support the use of biological control as alternative solution to the negative effects of chemical pesticide [13].Azadirachtin, an active compound extracted from the Azadirachtaindica A. or also known as neem is one of the most promising natural compounds among the natural products. The neem tree is a fast growing hardy and evergreen tropical and sub-tropical plant belonging to the same family as mahogany, Meliaceae [14]. Neem was found to be able to be grown at practically diverse climatic conditions but preferably at suitable climatic conditions [15]. The leaves have been shown to contain crude fiber (11-24%), carbohydrates (48-58%), crude protein (14-18%), fat (2.3-6.9%), ash (7.7-8.5%), calcium (0.8-2.4%) and phosphorus (0.13-0.24%), as well as a number of amino acids [5]. The crude neem extracts and products induce antifeedant effect [16]. Products derived from neem tree perform great Insect Growth Regulators (IGR) and also help in controlling some of nematodes and fungi [17]. The big benefits of biopesticide are their strong selectivity to target pests and safety to non-target plus beneficial organisms. In the sustainable intensification of agriculture through green economy, the biopesticide have a huge role. They are compliant to bio-intensive pest management and ideally suited for paddy cultivations. Although, it has been well recognized that neem-based biopesticide could be build up into products appropriate for integrated pest management in several food production field but the application for rice field cultivation is still limited. In the process of investigating the bio-efficacy of this biopesticide, the study of dependencies and connection between the productivity components using correlation analysis helps to develop consistent measures to select high rice productivity. Correlation of agronomic characteristics with yield has been widely studies by several researchers. Rice grain yield is a quantitative character that greatly affected by many environmental factors. In addition, rice grain yield is positively correlated with its own parameters such as plant height [18-20], tillers number per plant [21], percentage of productive spikelet [22, 23] and 100 grain [24, 25]. The effectiveness of the neem-based biopesticide on rice in diverse agro-climatic regions and cultivars in field condition has not been studied much. Nonetheless, Pearson’s correlation coefficients among yield and plant characteristics of rice were calculated using SPSS software. This is the preliminary data analysis to help us to perform the next stage such as the mechanism of the resistance of plant against the pest upon biopesticide treatment. Therefore, the objective of this research is to determine the bio-efficacy of neem-based biopesticide by understanding the correlation between plant characteristics with the grain yield.
2. Material and Methods
2.1. Experimental Site
- The experimental site is located at paddy field Bota Kiri sub-district within Perak Tengah district, Perak, Malaysia which is belong to a farmer.
2.2. Field Experiment
- The biopesticide was tested at the paddy field to evaluate its bio-efficacy in improving rice yield. Two different fields were used for the test. One field was applied with biopesticide while the other with common chemical pesticide practices. The neem-based biopesticide, BV 500WS and BV 612EC were obtained from Bio-X Techno SdnBhd company as part of collaborative research. Locally derived MR 263 rice (Oryza sativa) variety was used in this experiment. For the biopesticide tested field, seeds were immersed in a bucket of water containing biopesticide BV 500WS for 8 hours before sowing. Seeds used for chemical pesticide plot were immersed in a bucket of water for 24 hours and sowed to the field. Crop management practices such as fertilizing, drainage, plant protection measures were done as per requirement. Weeding was done in order to keep the crop free from weed. Biopesticide BV 612EC was sprayed at the test plot for insect control purpose.
2.3. Crop Cutting Analysis
- The crop cutting analysis method by Fermont and Benson [26] was used to estimate the rice yield in an area. The size of block field is 13837 m × 2926 m. For each field, a total number of four square frames in the size of 1 m × 1 m were selected, randomly. All rice plants inside the frames were subjected for analysis.
2.4. Assessment of Rice Yield Attributing Characters
- Average plant height (cm), number of tillers per plant, percentage of productive spikelets per plant, and dry 100 weight grain (g) were measured from fifty randomly selected plants from each of the plots at maximum growth stage of paddy. Grains were sun dried until about 14% moisture content because it is a safe storage in the tropics country [27], threshed, and cleaned thoroughly. From the threshed product of each plot, hundred grains were separately counted and weighed.
2.5. Data Analysis
- Samples for laboratory analysis were conducted at the Biomass Processing Laboratory, Universiti Teknologi PETRONAS, Malaysia. All data collected were subjected to statistical analysis using SPSS version 16.0 and the explanation will be in descriptive form. Frequency distribution, independent sample t-test and correlation coefficient analysis were also carried out.
2.5.1. Frequency Distribution
- A frequency distribution divides observations in the set of data into conveniently established, numerically ordered classes (group or categories) [28]. The number of observations in each class is referred to as frequency denoted as f. According to Smith et al. [29], frequency distributions are used to objectively summarize a data set. Figure 1 shows the basic information about the dependent variables as the table but in graphical format. The x-axis shows the various possible scores and the y-axis shows the frequency of each score. Then, each bar indicates the frequency of a given score. Some scores did not occur and thus are represented on the histogram by a zero frequency.
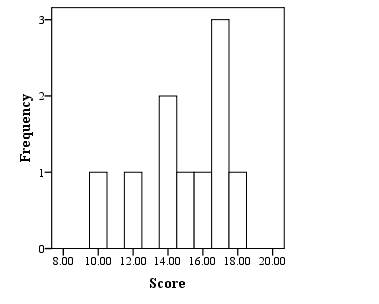 | Figure 1. Frequency distribution |
2.5.2. Independent Samples t-test
- A common statistical technique in research studies is independent samples t-test. This test is used to compare two independent groups, to determine whether there is a significant difference between the groups with respect to their mean scores on some numeric criterion variable [30]. The researcher must have a categorical dependent variable and a continuous dependent variable to apply an independent t-test [31]. This can be tested by using these two hypotheses.Two hypotheses tested are as follow:H0: There is no significant difference in yield component by using biopesticide H1: There is a significant difference in yield component by using biopesticideIf p-value < α = 0.05 (95% level of confidence), then H0 is rejected and show that there is a significant differences between the mean of pesticide.The presence of two data sets from two different samples of subjects makes the process of calculating t and the degrees of freedom with independent samples slightly more complicated than those for the one sample or paired samples situation. The formulas needed knowledge of means, standard deviations and sample size for both data sets. The test statistics for independent t-test is calculated using the following equations (1) and (2).
 | (1) |
 | (2) |
 = mean of the group 1
 = mean of the group 2
 = pooled variance
 = number of sample size of group 1
 = number sample size of group 2
 = standard error of group 1
 = standard error of group 2
2.5.3. Pearson’s Correlation Coefficient
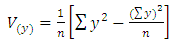
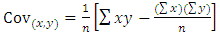
- Correlation coefficient,
 also known as Karl Pearson’s coefficient related to the covariance and like covariance is used to describe the existence of linear relationship between two variables x and y [32]. There are three types of linear relationship that may exist between these two variables namely positive linear correlation, negative linear correlation and no correlation. The strength of these variables can be seen based on the variance and covariance of the variables and ranges between -1 to +1, which -1 reflects a perfect negative correlation, +1 reflects a perfect positive correlation and 0 indicates no correlation at all. According to Rafter et al. [33], a negative value indicates an inverse linear relationship where large values of one variable are associated with small values of the other variable whilst a positive value indicates a direct linear relationship where large values of one variable are associated with large values of the other variable. Values close to 1 or -1 indicate a high degree of linear association and there is a little or no linear association for the values close to zero. When the variableshave no linear association, that means r = 0. A general thumb rule to call the correlation is weak for values between -0.25 and 0.25, for values between 0.25 and 0.75 in absolute values is moderate and for values over than 0.75 in absolute values is consider strong. The correlation coefficients were calculated using the following equation (3):
 | (3) |
 = correlation coefficients
 = covariance of x and y value
 = variance of x value
 = variance of y valueVariances and covariance are calculated by using the following equations (4), (5) and (6):
 | (4) |
 | (5) |
 | (6) |
 = sum of squares of x values
 = sum of squares of y values
 = sum of x values
 = sum of y values
 = sum of x and y values n = number of sample size
3. Results and Discussion
3.1. Descriptive Statistics and T-Test
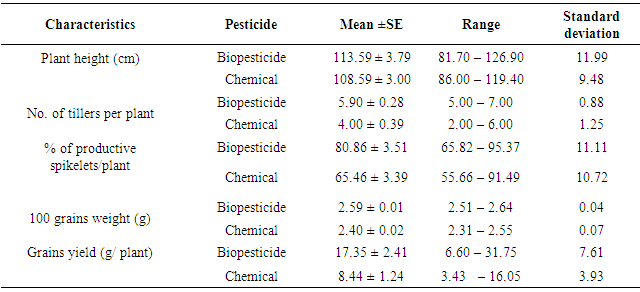
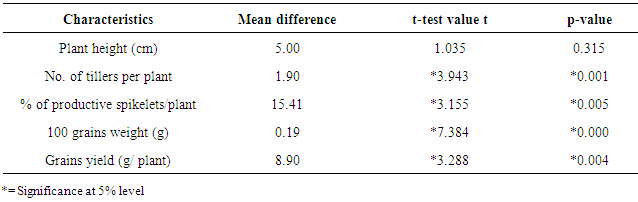
- Estimates for mean, range, and standard deviation for selected characteristics for biopesticide and chemical pesticide are shown in Table 1. With respect of yield characteristics of the rice given in Table 1, higher result was observed by using biopesticide as compared to chemical pesticide. The data in both cases revealed that in the case of biopesticide practice, the growth characteristics such as plant height (113.59 ± 3.79 cm), number of tillers per plant (5.90 ± 0.28) and yield contribution factors such as percentage of productive spikelets (80.86 ± 3.51), 100 grains of weight (2.59 ± 0.01 g) and grains yield per plant (17.35 ± 2.41 g) were significantly higher as compared to chemical pesticide practice. Maximum standard deviation belonged to plant height (11.99cm) followed by percentage of productive spikelets (11.11) and grain yield per plant (7.61g) as compared to chemical pesticide. The t-test value from analysis given in Table 2 indicated that biopesticide was significantly higher at 5% level of significance as compared to chemical pesticide for all the characteristics studied except for plant height but still recorded high numbers in biopesticide compared to chemical pesticide practices.
|
|
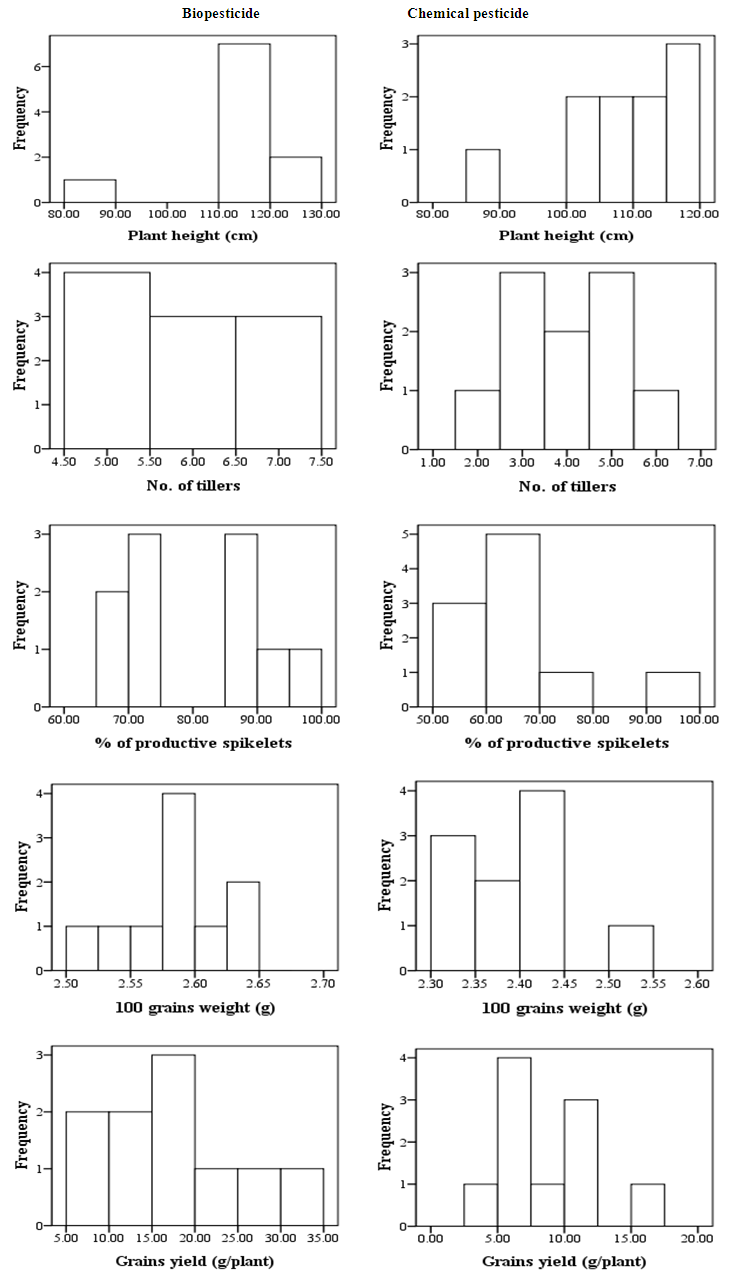 | Figure 2. Frequency distribution for each yield characteristics in rice |
3.2. Plant Height and Tiller Number
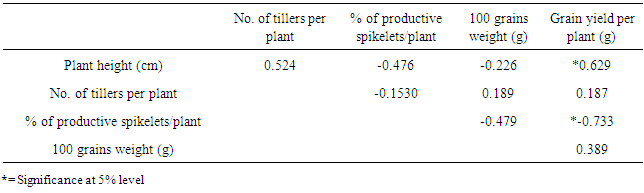
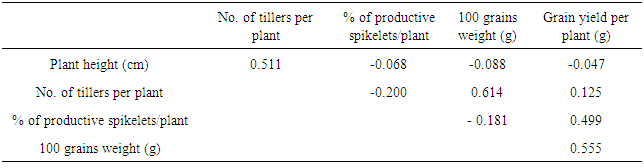
- Two important characters associated with biomass production [34] and grain yield in rice (Oriza sativa L.) [35] are plant height and tiller number. They are two main factors that affect the improvement of rice yield. Since tillering has an important effect on number of panicle, it plays a significant role in determining final grain yield [36]. According to [37], surplus tillers lead to high tiller abortion, small size of panicle, poor filling of grain and further reduced grain yield whilst too few tillers limit grain yield. Plant height had positive and significant relationship with grain yield per plant for biopesticide (Table 3) and similar results were also reported by [38]. Plant height also was positively associated with number of tillers per plant for both biopesticide and chemical pesticide. Positive correlation of plant height with number of tillers per plant was also reported by Ranawake and Amarasinghe [38]. It had a negative correlation with percentage of productive spikelets per plant and 100 grain weight for both pesticides. In addition, it also had a negative correlation with grain yield when chemical pesticide was used. Negative correlations between plant height and grain yield was also reported by Surek and Beser [39]. Negative correlation of plant height with grain yield suggested that increase in plant height would result in reduction of grain yield. Number of tillers per plant was negatively associated with percentage of productive spikelets per plant while it had positive correlation between 100 grain weight and grain yield per plant for both pesticides (Table 3 and 4). The positively correlation indicated that the number of tillers per plant is a significant yield contributing characteristic and it can lead to extra number of 100 grain weight and grain yield.
3.3. 100-Grains Weight
- Table 3 and 4 presented the results that indicated that 100 grain weight was positively and non-significantly correlated with grain yield for both pesticides. The result was proven that the 100 grain weight has significant influence upon rice yield. [24] and [22] also found that there was a positive correlation between grain weight and grain yield.
|
|
4. Conclusions
- The productivity of the studied accessions of rice yield by using biopesticide was statistically proven to be positive interdependence with plant height, number of tillers per plant and 100-grain weight. Higher result of growth characteristics was obtained when using biopesticide compared to chemical pesticide. On the grounds of the obtained results from the correlation analysis, it was established that in order to increase the productivity of rice, it is recommended that the characteristics such as plant height, number of tillers per plant and100-grain weight were achieved in biopesticide. The strongest characteristic that has positive effect on productivity was the plant height. Hence, the higher positive relationship between the grain yield and crop growth characteristics resulted in increase in grain yield which lead to higher preference by farmers for adoption of neem-based biopesticide for rice cultivation over chemical pesticide.
ACKNOWLEDGEMENTS
- This is a collaboration research between Universiti Teknologi PETRONAS, Bio-X Techno Sdn Bhd, and Agriculture Department of Perak Tengah. The authors would like to thank all those who contributed their joint efforts to this research and also to Universiti Teknologi PETRONAS for supporting this work via research grants, 0153AA-B36 in the effort of improving rice productivity.