-
Paper Information
- Paper Submission
-
Journal Information
- About This Journal
- Editorial Board
- Current Issue
- Archive
- Author Guidelines
- Contact Us
American Journal of Biochemistry
p-ISSN: 2163-3010 e-ISSN: 2163-3029
2015; 5(6): 131-137
doi:10.5923/j.ajb.20150506.01

Toxicity Studies of the Ethanolic Stem- Bark Extract of Milicia excelsa (Welw.) C. C. Berg in Wistar Rats
 Abstract
 Reference
 Full-Text PDF
 Full-text HTML
Areola J. O.1, Babalola O. O.2, Ilesanmi O. R.3, Oyedapo O. O.2
1Department of Medical Biochemistry, Obafemi Awolowo University, Ile-Ife, Nigeria
2Department of Biochemistry, Obafemi Awolowo University, Ile-Ife, Nigeria
3Department of Pharmacology, Obafemi Awolowo University, Ile-Ife, Nigeria
Correspondence to: Areola J. O., Department of Medical Biochemistry, Obafemi Awolowo University, Ile-Ife, Nigeria.
| Email: |  |
Copyright © 2015 Scientific & Academic Publishing. All Rights Reserved.
This work is licensed under the Creative Commons Attribution International License (CC BY).
http://creativecommons.org/licenses/by/4.0/

Thisstudy was designed to investigate the toxicity ofethanolic stem bark extract of Miliciaexcelsa in wistar rats. The ethanolic extract was screened for secondary metabolites to determine its phytochemical constituents. The acute toxicity of the extract was determined in mice with a view to estimating its median lethal dose (LD50). For sub-chronic toxicity study, twenty wistar rats with average weight of 184.50 ± 3.21 g were randomly assigned into four groups (I-IV) of five rats each. Animals in groups II-IV were orally administered with ethanolic extract at the doses of 250, 500 and 750 mg/kg body weight respectively once daily for 28 days, while those in the control group (group I) received 2 ml of 5% dimethyl sulphoxide (DMSO/water 5:95 v/v) daily. The results of this study showed that flavonoids, tannins, saponins, cardiac glycosides and terpenoids are the major secondary metabolites present in the extract. The LD50 was found to be greater than 5 g/kg body weight. The results of biochemical analyses showed that the concentrations of plasma protein, albumin, bilirubin, creatinine and uric acid in the extract treated rats (groups II- IV) were not significantly different (p > 0.05) from the control (group I). Similarly, the activities of hepatic marker enzymes in the plasma showed that AST, ALP and GGT activities in all the treated groups were not significantly different from control group. However, the ALT activity of the extract treated groups was lower than its activity in the control group and the difference was statistically significant (p < 0.05). Also, the antioxidant enzymes (SOD and CAT) activities in the treatment groups were not significantly different (p > 0.05) from control group. The results of this study suggest that prolonged use of ethanolic stem bark extract of Milicia excelsa might not have adverse effects on the liver and kidney at the tested doses in this study.
Keywords: Milicia excelsa, Stem-Bark, Toxicity, Ethanolic extract, Phytochemical
Cite this paper: Areola J. O., Babalola O. O., Ilesanmi O. R., Oyedapo O. O., Toxicity Studies of the Ethanolic Stem- Bark Extract of Milicia excelsa (Welw.) C. C. Berg in Wistar Rats, American Journal of Biochemistry, Vol. 5 No. 6, 2015, pp. 131-137. doi: 10.5923/j.ajb.20150506.01.
Article Outline
1. Introduction
- Various claims for the therapeutic properties of plant extracts are commonly made by the traditional medical practitioners. These claims are frequently based on oral tradition, intuition, trial and error [1]. Scientific investigations of some of these claims have yielded both positive and negative results. Therefore, it is important to investigate other unsubstantiated claims for scientific validation or repudiation [2]. The potential of plant-based drugs as cheaper alternative and their availability in every community are probably responsible for the fast growing industry of herbal medicine in Asia, Africa, America and Europe [3]. Toxicity during prolonged treatment with synthetic drugs and development of resistance by micro-organisms are other probable factors responsible for the continuous search for bioactive compounds from natural sources. Ethno-pharmacology will continue to be relevant to mankind as long as there are both infectious and non-infectious diseases [4] and [3]. M. excelsa belongs to Mulberry family; Mulberry is the common name for the Moraceae, a family of deciduous or evergreen trees and shrubs, often climbing, mostly of pan tropical distribution, and characterized by milky sap. Several of the genera bear edible fruits, examples include; Morus, Ficus, and Artocarpus [5]. In traditional medicine, different parts of M. excelsa (leaves, sap or latex, stem and root barks) are used for the treatment of various ailments in many African countries. These include malaria, cough, skin infections, rheumatism and other inflammatory conditions [6], [7] and [1]. Literature survey revealed that the extracts of the plant exhibited numerous biological activities including anti-inflammatory [6] anticancer [8] and anti-fungal activities [9]. The commercial values of M. excelsa trees as sources of famous timber known as Iroko is probably responsible for few studies on its ethno-medicinal uses. Despite wide applications of the extracts of the plant in ethno-medicine and its biological activities; there was no scientific investigation on the possible toxicity of the plant’s extracts, fractions and metabolites in laboratory animals, hence this study.
2. Materials and Methods
- Plant MaterialsFresh stem-bark of M. excelsa was collected from a matured M. excelsa tree at the main Campus of Obafemi Awolowo University, Ile-Ife, Nigeria. The plant was identified and authenticated by Dr. F. A. Oloyede, Department of Botany, Obafemi Awolowo University, Ile-Ife, Nigeria. The plant specimen was deposited at IFE Herbarium with specimen voucher number UHI 16469. Reagents and Chemicals The reagents used were of analytical grade. They were obtained from various sources such as British Drug House Limited (BDH) London, Sigma Fine Chemicals Limited, Upssala, Sweden and Sigma Aldrich Germany. Reagent Kits for the assay of alanine aminotransferase (ALT), aspartate aminotransferase (AST), alkaline phosphatase, γ-glutammyl transferase, uric acid, bilirubin and creatinine were products of Randox Laboratories Limited, United Kingdom. All solutions, buffer and reagents were prepared with glass-distilled water.Experimental AnimalsHealthy mice (20) with average weight of (20
 2 g) and white albino rats (20) with average weight of (184.5
  3.2 g) were obtained from the Faculty of Pharmacy, Obafemi Awolowo University, Ile-Ife, Nigeria. The animals were acclimatized, fed and watered ad libitum for 4 weeks before the commencement of experiment. Preparation of Ethanolic ExtractThe stem-barks of M. excelsa were washed, cut into tiny bits, shade dried for four weeks and ground into powder with electrical milling machine. The powdered stem bark (1kg) was macerated in 70% (v/v) ethanol (3L) for 72 hr at room temperature with regular shaking. The suspension was filtered; the residue was re-suspended and re-extracted until the filtrate became colourless. The filtrates were combined, concentrated under reduced pressure in rotary evaporator (Edman High Vacuum Pump) at 40°C and lyophilized. Phytochemical ScreeningThe ethanolic extract of M. excelsa was screened for the presence of secondary metabolites according to standard procedures [10] and [11]. Alkaloid: extract (0.1 g) was stirred in 10% (v/v) HCl on a steam bath followed by filtration. The filtrate (1ml) was separately mixed with a few drops of Meyer’s, Wagner’s and Drangendorff’s reagents. The mixtures were observed for turbidity or formation of precipitate; Saponin: extract (0.1 g) was suspended in distilled water (5 ml) and shaken vigorously until froth appeared. The tube and its content was warmed in water bath for 10 min, presence or absence of frothing was noted after warming; Tannins: extract (0.1 g) was taken up in 10 ml-distilled water and filtered. To 1 ml of the filtrate, a few drops of ferric chloride solution were added and mixture observed for formation of blue, blue-black, green or green--black colouration or precipitate; Flavonoids: extract (0.1 g) in 5 ml ethanol was shaken and filtered. To 1 ml of the filtrate, few drops of 0.5 N alcoholic KOH were added and the mixture observed for yellow coloration or precipitate; Cardiac glycosides: extract (0.1 g) was suspended in 5 ml chloroform and filtered. To the filtrate, concentrated sulphuric acid (2 ml) was carefully layered at the bottom of the tube without disturbing the solution. It was observed for the formation of a sharp brown ring at the chloroform / sulphuric acid interface. Toxicological InvestigationAcute Toxicity StudyAlbino mice (18) were randomly divided into six groups of three mice per group and the study was carried out in two phases: First phase: three groups of mice were randomly selected; the ethanolic extract was prepared using 5% dimethyl sulphoxide (DMSO/water 5:95 v/v) as vehicle, at doses of 100 mg/kg bwt, 1000 mg/kg bwt and 2000 mg/kg bwt., the extract was administered once to the three groups of mice respectively. The mice were monitored for mortality and signs of toxicity such as foaming in the mouth, food refusal and convulsion during the first 1 hour, then at 2 hours interval for the next 6 hours and everyday for 72 hours. Signs of toxicity were recorded for each group during the observation period.Phase two acute toxicity study was carried out based on the outcome of first phase study. The remaining three groups were used for phase two of the study. The extract at 3000, 4000 and 5000 mg/kg body weight were administered to the three sets of mice respectively. The mice were monitored for signs of toxicity and mortality as was done in the first phase. Median lethal dose (LD50) was calculated according to the arithmetic method of Karbar as reported by Saidu et al. (2007) [12].Sub-chronic Toxicity StudyGrouping and Treatment of AnimalsThe appropriate weight of the ethanolic extract was dissolved in the vehicle to give final doses of 250, 500 and 750 mg/kg body weight. The rats were treated orally once daily for 28 consecutive days. A total of twenty (20) wistar rats were randomly divided into 4 groups of five animals as follows:I: Rats + 2ml distilled water (control)II: Rats + 250 mg / kg bwt.III: Rats + 500 mg / kg bwt.IV: Rats + 750 mg / kg bwt. On the 28th day, the animals were fasted overnight and sacrificed on day 29. Blood was collected by cardiac puncture using disposable pyrogen free needle into heparinized tubes. The liver and kidney were removed aseptically, washed free of blood, dried on tissue paper, wrapped with aluminium foil paper and kept frozen. Preparation of Plasma The blood was centrifuged at 3000 rpm for 10 min; the plasma (supernatant) was carefully collected and used for the biochemical assays. Liver and kidney (1 g each) were homogenized separately in 10 ml of freshly prepared 100 Mm phosphate buffer, pH 6.8 and centrifuged at 3000 rpm for 10 minutes. The supernatants were transferred into separate clean vial bottles and used for the assay of antioxidant enzymes and hepatic marker enzymes.Liver and kidney (1 g each) were homogenized separately in 10 ml of freshly prepared 100 Mm phosphate buffer, pH 6.8 and centrifuged at 3000 rpm for 10 minutes. The supernatants were transferred into separate clean vial bottles and used for the assay of antioxidant enzymes and hepatic marker enzymes.Biochemical AnalysesRandox Diagnostic Kits were used for all the enzymatic assays. Plasma protein determination was according to Bradford (1976) [13] method: The assay mixture consisted of plasma or liver homogenate (20 µL), distilled water (780 µL) and Bradford reagent (200 µL). The absorbance was read immediately at 595nm and protein concentrations estimated from standard protein curve. Albumin was according to Pinnell and Northam (1978) [14], bromo-cresol green concentrate solution was added to test tubes labeled (blank, standard and sample) in triplicates. Standard albumin solution (10 µL) was added to test tube labeled standard while 0.85% NaCl (10 µL) and plasma (10 µL) were added to the tubes labeled blank and sample respectively. The tubes were mixed, incubated for 20 min at room temperature and the absorbance read at 578nm against the blank within 60 min. Albumin concentration in the plasma was estimated using the formula provided in the manual. Bilirubin concentrations was according to Jendrassisk and Grof (1938) [15], two sets of clean test tubes (blank and sample) were arranged in triplicates, 0.2 ml of reagent 1 was added to both blank and sample tubes, (10 µL) of reagent 2 was added to sample tubes only. Reagent 3 (10 µL) and (200 µL) plasma were added to blank and sample tubes. The reaction mixture were thoroughly mixed and allowed to stand for 10 min at room temperature. Finally, reagent 4 (1000 µL) was added to all the tubes, mixed, incubated at room temperature for 20 min and absorbance was read at 578nm against the sample blank. Total bilirubin concentration was calculated using this expression: Total bilirubin (mg/dl) = 10.8 x Abs of sample. Creatinine was estimated according to the procedure described by Chawla, (1999) [16]; working reagent (2000 µL) was added to two sets of test tubes in triplicate (labeled sample and standard). Plasma (200 µL) and standard creatinine solution (200 µL) were added to sample and standard tubes respectively. The reaction mixture was allowed to stand for 30 seconds, the absorbance A1 was read at 520nm and exactly 2 min later, absorbance A2 was read. Concentration of creatinine (mg/dl) was calculated using the expression: [(A2 - A1) sample/ (A2 - A1) standard] x standard concentration (mg/dl). Alkaline Phosphatase activity was according to the method of Sanni and Van-Eteh, (1978) [17]. The assay mixture consisted of plasma (20µ) or liver homogenate (50 µl) in triplicates and incubated at 30°C for 3 min. The blank was prepared using water instead of the liver homogenates or plasma samples. The reaction was initiated by the addition of 1000 µl of substrate and the absorbance was read against the reagent blank at 405nm for 3 min at 1 min interval. The activity of alkaline phosphatase was calculated using the expression below: Alkaline phosphatase (U/L) = 2760 x ∆A 405 nm/min. The aminotransferases (L-alanine and L-aspartate) were assayed according to the method of Reitman and Frankel (1957) [18]. The assay mixture consisted of the respective substrate (250 µl) and blood plasma (50 µl); the contents of the tubes were mixed thoroughly and incubated in a water- bath at 37°C for 30 min followed by the addition of 2, 4–dinitrophenylhydrazine (250 µl). The mixture was allowed to stand at room temperature for 20 min after which 2500 µl of NaOH solution was added to terminate the reaction. The absorbance was read at 546 nm against the sample blank and the activity of the enzyme was extrapolated from a standard curve. Gamma glutamyltransferase activity was determined according to the method of Szasz (1969) [19]. To 100 µl of the plasma, 1000 µl of buffered substrate reagent was added. The solution was mixed and the timer started simultaneously. The absorbance was read at time 0, 1, 2 and 3 minutes against the reagent blank at 405 nm. The activity of GGT was calculated as follows: GGT (U/L) = 1158 x ∆Abs at 405nm. Superoxide dismutase (SOD) and catalase activities were determined according to the method of Mistra and Fridovich (1972) [20] and Aebi (1973) [21] respectively.
3. Statistical Analysis
- All data from biochemical assays were expressed as Mean ± SEM. Statistical analyses were performed by one way analysis of variance (ANOVA) followed by Turkey- Kramer multiple comparison tests to ascertain differences between treatment groups and p values for significant difference between the mean of control and test groups was considered at p < 0.05. The analyses were performed using Graph Pad Instat 3 (version 1.1, 2007).
4. Results
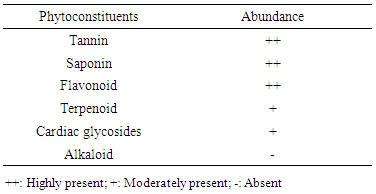
- The extraction procedure yielded 41g of ethanolic extract (EE) from 500g (8.2%) starting material. Phytochemical screening revealed the presence of tannins, saponins, flavonoids, terpenoids and cardiac glycosides as shown in Table 1. The results of acute toxicity showed that there was no mortality in both phases and the estimated value of Median lethal dose (LD50) was greater than 5g/Kg body weight.
|
|
|
|
5. Discussion
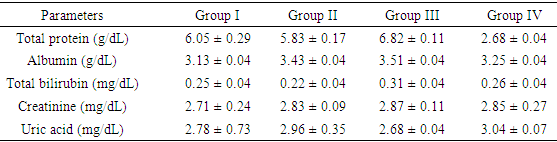
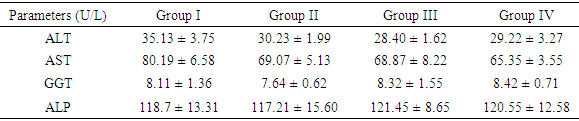
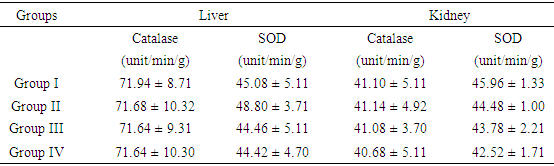
- The extraction of secondary metabolites from plants is affected by several factors such as particle size and method of extraction. In a particular study, 5 minutes extractions of very fine particles of plant material gave higher yield than the yield obtained after 24 hours in a shaking machine with coarse plant material [22]. In this study, fine particles of M. excelsa stem bark was macerated in 70% (v/v) ethanol for 72 hours with constant shaking; the yield obtained was 8.2%. The yield was not different from methanol extraction of M. excelsa stem bark through soxhlet extraction method for 6 hours [23]. This shows that it is possible to achieve yields comparable to soxhlet extraction method by cold maceration of fine particles with constant shaking if left for at least 72 hours. The yield obtained in this study falls within the range of yields of ethanolic extracts (7 – 19%) reported for some medicinal plants [24]. The phytochemical screening of the ethanolic extract (Table 1) revealed the presence of flavonoids, saponins, cardiac glycoside, terpenoid, and tannins as attested to by the positives reactions elicited by the molecules. The presence of phenolic compounds (flavonoids and tannins) known for their strong antioxidant properties and the presence of other phytochemicals (terpenoids, saponins and cardiac glycosides) known to possess various biochemical properties [25] that have direct application in the management of human diseases could be one of the reasons why the stem bark of M. excelsa is extensively used in ethnomedicine. Plasma concentration of proteins and albumin may decrease as a result of impaired protein synthesis due to malnutrition, mal-absorption, liver disease or increased protein loss due to renal, gastrointestinal and skin disorders; external factors such as nutrition may also affect protein synthesis [26]. Increase protein synthesis as a result of extract administration could be due to the presence of phytochemical that stimulates protein synthesis as observed with aqueous extract of M. charantia [27]. There were no significant differences (p > 0.05) between the concentration of plasma protein in the control and treated groups; for this reason it could be stated that the extract might not have deleterious effect on the liver of experimental animals. Creatinine is derived from creatine and creatine phosphate in muscle tissues. It is a function of body muscle mass; its rate of production is constant and it is not reutilized after production, so it is excreted by the kidneys. Sudden increase in the plasma creatinine concentration could be a sign of renal dysfunction. The marginal increase in the plasma concentration of creatinine observed in the treated animals was not statistically significant when compared with the control (Table 2). This was an indication that the glomerular filtration rate (GFR) might not be affected by the oral administration of the extract [28]. Uric acid is a byproduct of purine metabolism, in healthy human, uric acid is filtered and removed from the blood by the kidneys and excreted into urine. A number of kidney diseases are known to affect uric acid levels, uric acid determination is thus important and useful in diagnosing and evaluating kidney diseases. Increased levels of uric acid are also known to be associated with uremia, leukemia and pneumonia. Elevated plasma uric acid concentration may result from overproduction of uric acid or failure of the kidneys to excrete it from the body. Uric acid concentration in the plasma was employed to evaluate the effect of oral administration of EE on the renal function. Plasma uric acid concentrations in the control group were not significantly different from all the treated groups (p > 0.05). This result also showed that the extract might not be nephrotoxic. The result was in agreement with creatinine concentration determined in this study. Drug metabolism and capacity to transport organic anions are important functions of the liver; these functions are impaired if liver cells are damaged [29]. Serum bilirubin is one of the organic anions derived from red blood cells. Normal conjugation of bilirubin and eventual excretion through biliary system is an indication of healthy liver. But when there is liver damage, bilirubin is not conjugated and will not be excreted [30]. Conjugated bilirubin is soluble in plasma, it passes down the bile duct and it is excreted into the gastrointestinal tract but the unconjugated bilirubin is not soluble and does not normally pass through the kidneys into the urine. To evaluate the toxicity of EE on the capacity of liver to process and excrete organic anions, total bilirubin concentrations were estimated in the plasma. It was observed that oral administration of ethanolic extract of M. excelsa to rats did not cause elevation of either conjugated or unconjugated bilirubin. Marginal changes observed in the total bilirubin concentrations were not statistically significant (p > 0.05). This result revealed that the liver functions were not affected by the extract and it might not be hepatotoxic. Alanine aminotransferase (ALT) is found in the liver, kidney, heart and muscle but the highest concentration is found in the liver compared with other tissues. ALT is purely cytoplasmic enzyme where it catalyses transamination reactions [30]. Cellular injury in the liver causes the release of both AST and ALT; ALT is a more specific indication of liver disease, whereas AST elevations may be secondary to damage of other organs (heart, kidney, brain, intestine and placenta). The results of the study showed that, oral administration of ethanolic extract did not cause ALT elevation; this is an indication that the extract might not contain toxic compounds that could cause injury to the liver cells. However, reduction in ALT activity was observed in all the groups of rats treated with ethanolic extract (Table 3). Though, the reduction was statistically significant (p < 0.05) at higher concentrations (500 mg/kg and 750 mg/kg) but it was not dose dependent. Similar results were reported for the aqueous extracts of Annona muricata [31], Carica papaya [33] and Momordica charantia [27]. The results of these studies suggested that the extracts of these plants could be relatively safe for human consumption at low doses (< 500 mg/kg bwt.). The reduction in ALT activity observed could be an indirect sign of toxicity at doses greater than 500 mg/kg bwt. Aspartate aminotransferase (AST) is found in highest concentration in the heart compared with other tissues of the body, elevated AST along with low level of ALT [30]. Elevated AST activity was not observed in this study, instead reduction in enzyme activity was observed in all the treated groups as was the case with ALT activity. The results revealed that oral administration of ethanolic extract of M. excelsa might not be toxic to the liver, heart and the skeletal muscle of experimental animals. Though, the reduction in AST activity was not statistically significant but it could be an indirect sign of mild toxicity. In addition to ALT and AST, alkaline phosphatase (ALP) is another important serum enzyme commonly used to investigate injury to the liver and bones. Alkaline phosphatase belongs to a family of zinc metalo-enzymes, with a serine at the active center; they catalyse the release of inorganic phosphate from various organic orthophosphates and are present in nearly all tissues. In the liver, alkaline phosphatase is found in the microvilli of bile canaliculi and on the sinusoidal surface of hepatocytes. In healthy people, most circulating alkaline phosphatase originates from the liver or bone [33]. In acute viral hepatitis, ALP usually remained normal or moderately increased but hepatic and bone metastasis can cause elevated levels of ALP. In this study, administration of ethanolic extract did no elicit increase in the values of plasma ALP in all the treated groups. The results showed that the extract might not be toxic to the liver and bone tissues at a maximum dose of 750 mg/kg body weight investigated in this study. Gamma glutammyl-transferase (GGT) is a microsomal enzyme present in hepatocytes and biliary epithelial cells, renal tubules, pancreas and intestine. Plasma GGT activity is mainly attributed to hepatobiliary system, though it is found in higher concentration in renal tissue [30]. An elevated plasma GGT level of more than 10 folds of normal value is observed in alcoholism. It is partly related to structural liver damage, hepatic microsomal enzyme induction or alcoholic pancreatic damage. In cholestatic injury to the liver, GGT increases at an average of 12 times its upper reference limit compared with three-fold increase for ALP [26]. When ALP increases are accompanied by smaller increases in GGT level, bone origin of ALP is suspected as GGT is not found in bone [34]. The results showed that there was no GGT elevation in the animals treated with the extract. This observation was in agreement with other hepatic marker enzymes results and further showed that the extract might not be toxic to the liver.The activity of antioxidant enzymes in the tissues determines the level of oxidative stress; superoxide dismutase (SOD) and catalase are responsible for the regulation of reactive oxygen species in many tissues (liver, kidneys and heart). Superoxide dismutase is the major antioxidant enzyme that provides the body’s first enzymatic step in the defense system against oxidative stress while the catalase is used by cells to defend against the toxic effects of hydrogen peroxide [35]. In patients with chronic heart failure, endothelial-bound superoxide dismutase activity was substantially reduced and its diminished levels were closely linked with increased vascular oxidative stress, which contributes to endothelial dysfunction in chronic heart failure [36]. The activities of SOD and catalase determined in the liver of experimental animals showed that the activities of the enzymes in the control group were essentially the same as in the treated groups (Table 4). Similar results were obtained in the kidney homogenate for the control and treated animals. The differences between the control and the treated groups were not statistically significant at p > 0.05. These results showed that oral administration of the extract was able to suppress increase in the generation of free radicals due to its strong antioxidant properties. This could be the reason why there was no elevation or depletion in the activities of both antioxidant enzymes investigated. This is an affirmation that the ethanolic extract of M. excelsa might not be toxic at the doses investigated in this study.
6. Conclusions
- The outcome of this investigation has shown that oral administration of ethanolic extract of M. excelsa did not elicit any untoward effects on the experimental animals. The extract is neither hepatotoxic nor nephrotoxic at the doses investigated. It is therefore reasonable to suggest that the stem bark ethanolic extract of M. excelsa might be relatively save at a maximum dose of 750 mg/kg body weight. It is necessary to investigate the effects of the extract on other tissues and organs of laboratory animals before final conclusion could be drawn on its absolute safety.