-
Paper Information
- Paper Submission
-
Journal Information
- About This Journal
- Editorial Board
- Current Issue
- Archive
- Author Guidelines
- Contact Us
American Journal of Biochemistry
p-ISSN: 2163-3010 e-ISSN: 2163-3029
2015; 5(4): 77-84
doi:10.5923/j.ajb.20150504.02

Conformational Change of Tb-Transferrins, Tb-Ovotransferrin; Cause and Effects of Anion Bindings to Tb-Transferrin
 Abstract
 Reference
 Full-Text PDF
 Full-text HTML
Sohrab Abdollahi
Department of Chemistry, Payame Noor University, I. R. of Iran, Tehran, Iran
Correspondence to: Sohrab Abdollahi, Department of Chemistry, Payame Noor University, I. R. of Iran, Tehran, Iran.
| Email: |  |
Copyright © 2015 Scientific & Academic Publishing. All Rights Reserved.
This work is licensed under the Creative Commons Attribution International License (CC BY).
http://creativecommons.org/licenses/by/4.0/

Circularly Polarized Luminescent is used to probe the symmetry around coordination sphere of terbium bonded to a large biological molecule such as transferrin, ovotransferrin or lactoferrin. Any conformational changes in protein which result from bonding of metals or anions to protein can be measured by total emission and glum with the CPL. The CPL and difference-UV measurements of these proteins can help to illustrate kinetics of iron release and binding of anions to transferrin. Human transferrin and lactoferrin have similar total emission and CPL, representing similar symmetry of coordination environment. However CPL of ovotransferrin is significantly different regarding glum value and shape. Some inorganic anions can interact with protein through weak bonding which is detected by CPL. Interaction nature of anions seems to be hydrogen bonding and Lewis basicity. Binding of these small anions may act the same as triggers to start changes of conformation in macromolecules which may be required for specific biological functions.
Keywords: CPL, Transferrin, Terbium, Ovotransferrin, Lactotransferrin, Difference-UV
Cite this paper: Sohrab Abdollahi, Conformational Change of Tb-Transferrins, Tb-Ovotransferrin; Cause and Effects of Anion Bindings to Tb-Transferrin, American Journal of Biochemistry, Vol. 5 No. 4, 2015, pp. 77-84. doi: 10.5923/j.ajb.20150504.02.
Article Outline
1. Introduction
- Circularly Polarized Luminescence, CPL, spectroscopy is a very useful technique for the investigation of optically active (chiral) molecules [1-4]. Electronic and structural characterizations of these compounds can be probed by CPL spectroscopy. Optically active molecules are very important in living organisms. For example, proteins, DNA, and carbohydrates are all optically active molecules, and so they interact differently with left and right circularly polarized light. This property of chiral molecules can be used to determine structural information by using chiroptical spectroscopic techniques such as Circular Dichroism, CD and CPL. Emeis and Oosterhof were the first to report the measurement of the circular polarization in the luminescence of optically active molecules [4]. The CPL technique is used for naturally active systems and differs from those in which external fields are necessary for the creation of field-induced polarization.Studies in which fluorescent labels have been attached to biomolecules continue to be one of the most promising areas of research involving CPL. The measurement of CPL from lanthanide complexes has been emphasized in many researches [1, 5, 6]. Conformational changes of biomacromolecules such as proteins, DNA, and carbohydrates are very important in biological systems. Complexity, crowding, and folding situations of these kinds of large molecules have limited the investigation and usage of regular spectroscopic or other technical probes as well. Specifically, the purification and structural determination by x-ray crystallography, if not impossible, but it is very hard task. This is why, the role of CPL technology regarding biomacromolecules is very crucial. Therefore conformational changes of these macromolecules around spectroscopically active centers or far from these centers are very important clues regarding biological functions. Any kinds of advances in CPL technology can be very promising for revealing biological functions and secrets.Many researches have conducted experiments by replacing Fe(III), Ca(II) and other metals (natural substrate) in large biological molecules with luminescent lanthanide(III) ions [7, 8]. Lanthanides complexes such as Tb(III) and Eu(III) bonded proteins, when irradiated be Ar-ion laser, strongly emit luminescent radiation since the excitation radiations of an Argon laser overlaps with the absorption line peaks of TB(III) and EU(III) ions. Among lanthanides, terbium and europium are two ions that provide a large dissymmetric ratio upon binding to transferrin(Tf) because of certain electronic transitions that obey magnetic dipole selection rules, i.e. ∆J = 0, ±1 [2]. Fortunately, due to intraconfigurational f-f transitions of lanthanides such as Tb(III) and Eu(III) in both absorption state and emission states accompanied with a lot of chiral activity [9]. Therefore metals such as terbium(III) and europium(III) are used in biomolecular systems as a good luminescent probe because they are the most luminescent lanthanides. In this research, complexes of Tb(III) with human serum transferrin, lactotransferrin and ovotransferrin were investigated.Another main subject in this area is anion binding properties. Different anions can bind to apo and monoferric transferrin. However their binding to transferrin may have different properties. Some anions are required for the binding of metals to transferrin. Some remove iron from transferrin (ligating anions such as pyrophosphates). Some non-chelating anions facilitate iron release from transferrin. Anions may have both kinetic and thermodynamic properties. Anions are divided into two broad classes regarding their interaction with transferrin. 1- Synergistic anions such as bicarbonate and carbonate which are required for the binding of iron to the protein under physiological conditions [10-12]. Other synergistic anions are Nitrilotriacetate, oxalate, EDTA, Malonate and some more. 2- Nonsynergistic anions such as phosphate, sulfate, chloride, nitrate, thiocyanate and halogens which interact with the protein and change its conformation and reduce the iron-protein binding strength [13-15]. The anion binding properties of transferrin are very important [16] because it binds to protein and change its conformation in response to proper biological actions.
2. Materials and Methods
- Precautions were taken to avoid contamination by extraneous metal ions because apotransferrin and some ligands have high affinity toward Fe(III) ions. Therefore all glassware, including cuvettes, was soaked in 30% HNO3 and then rinsed with extra pure water which was prepared from distilled water which was further purified by passage through a Millipore MilliQ system (18MΩ cm).
2.1. Hepes
- The hepes buffer of 0.1 M concentration was made by dissolving an appropriate amount of hepes in Millipore water. The pH of this solution was acidic, around 5.6, and was adjusted to pH 7.4 by adding carefully 50% sodium hydroxide drop wise.
2.2. Lanthanide Stock Solutions
- Stock solution of 0.1 M terbium chloride was prepared by dissolving weighed samples of the corresponding chloride in 50 mL hydrochloric acid solution at pH 2. The solutions were diluted to volume of 100 mL with distilled water. The final stock solutions had a pH of 2.8.
2.3. Standardization of Lanthanide Solutions
- The terbium stock solutions were standardized by compleximetric titration with EDTA, using xylenol orange as a metal indicator in acid acetic/sodium acetate buffer at pH 5.5. Xylenol orange indicator was prepared by dissolving 0.05 g of xylenol orange in 50 ml water and ethyl alcohol. One mL of the lanthanide stock solution was added to an Erlenmeyer flask containing 3.8 mL of 0.2 M acetic acid and 36.2 mL of 0.2 M sodium acetate. After adding 3 to 4 drops of the xylenol orange indicator, the solution was titrated with 0.01 M EDTA until the color changed from pink to yellow. The color change at the end point is very sharp, fast, reversible and easily distinguished.
2.4. Preparation of Apotransferrin Sample
- A solution of apotransferrin was prepared by dissolving 100 to 200 mg of protein into one to two mL of 0.1 M hepes buffer, pH 7.4 containing 0.1 M sodium perchlorate. This solution was passed through a 1.6 x 30 cm column packed with Spectra/Gel AcA 202gel filtration beads in the same buffer. Eluent fractions containing the protein were identified using a pharmica UV-1 Monitor and concentrated using an Amicon Model 8010 ultrafiltration cell feed with an XM-50 membrane under 70 psi of nitrogen gas. The concentrated apoTf solution was eluted through a second Spectra/Gel column with 0.1 M Hepes and concentrated by ultrafilteration to the desired molarity. The concentration was determined from the absorbance at 278 nm using an extinction coefficient of 93,000 cm-1M-1 [17-21].
2.5. Difference-UV spectroscopy
- Difference-UV titrations were carried out in a cuvette at 25°C and 0.1 or 0.05 M hepes buffer at pH 7.4. The absorbances were measured either by a Hitachi 3110 UV-vis spectrophotometer with automatic control of the temperature or with a Cary UV-vis spectrophotometer equipped with cell holders connected to an external circulating water bath maintained at 25°C. Both instruments provide similar reproducible results. The pH of the cuvette contents was measured before and after the titration. Apotransferrin was titrated with terbium, and some salts at ambient bicarbonate concentration. In each titration, equal volumes of protein solutions were added to reference and sample cells (usually 2.2 mL in each cuvette). The absorbance of protein vs. protein was recorded as a baseline. An aliquot of titrant was added to the sample cuvette, and an equal volume of water was added to the reference cuvette. After equilibrium was reached, the absorbance from 320 to 240 nm was recorded.
2.6. CPL Spectra of Tb-Tf-Tb
- One mL of 80 to 100 μM apoTf solution was added to a 3 mL cuvette. After adding 30 μL of 0.1 M bicarbonate, 2 to 4 equivalents Tb(III) were added to the protein solution. The cell contents were completely mixed by inverting the cuvette several times. The cuvette was placed in the sample holder and irradiated by a laser beam of 488 nm as the excitation source. First, the total emission of the sample was measured over the emission wavelength around 530 to 560 nm. Following the total emission, glum was measured. In most cases the glum was measured over a smaller emission wavelength range where the emission intensity is higher (usually around 535 to 555). Most CPL spectra were recorded with slit width of 0.5-1 mm, window% of 50 and stable laser power of 1.7 V. with the above mentioned concentration of protein, one hour was needed for the complete measurement of a CPL spectrum. The same procedure was used to measure the CPL spectra for diterbium lactoferrin and diterbium ovotransferrin.
2.7. CPL Titration of apoTf with Tb(III)
- In these experiments apoTf solutions were titrated with an acidic solution of Tb(III). One mL of protein and 30 μL of 0.1 M bicarbonate were added to a 3 mL cuvette. After complete mixing, the cuvette was placed in the sample holder and irradiated by a laser line of 488 nm. During each titration, both the total emission and glum were measured after the addition of an aliquot of titrant. Total emission was measured over an emission wavelength of 530 to 560 nm. In some cases, glum was measured at a fixed emission wavelength (454.5 nm). Sometimes, instead of a single wavelength, glum was measured for a range of wavelengths that corresponds to an emission band, and the area under this band was integrated. In general, the measurement of the area under a peak provides a more accurate measurement of the glum than a measurement at a specific wavelength. In this work the area of the negative CPL peak at 541-543 nm was calculated. Titration curves were prepared by plotting glum (or area related to glum) and intensity (or area related to intensity) of emitted light (y-axes) vs. number of equivalent Tb(III) (x-axis).All total emission and CPL measurements were carried out using a 3 mL fluorescence cell. All samples contained 0.1 M hepes buffer at pH 7.4 and room temperature. The protein concentration for CPL measurements varied from 80 to 100 μm. In most experiments 0.1 M bicarbonate solution was added to obtain a bicarbonate concentration in the cell of around 3.0 mM.
2.8. CPL Titration of Tb-Transferrin with Anions
- Tb-transferrins were titrated with the inorganic anions F-, ClO4- , SO42-, HPO42-, NO3- and SCN-. The amounts of 1 mL of protein solution, 30 μL of 0.1 M bicarbonate and 2 to 3 equivalents (1 to 1.5 equivalents for monoferric Tf's) of Tb(III) were added to the cuvette. For each added aliquot of anion solution, the total emission was measured first over the range of around 530 to 560 nm. The glum was measured for the area of the negative CPL peak at 541- 543 nm. The titration curves were provided as explained above, but in this case the x-axis was the concentration of the anion rather than equivalents of Tb(III).Most of CPL measurements were carried out with slit width of 0.5 to 1 mm, window% of 50 and stable laser power of 1.7 V. The number of glum is measured for each data point varied among 5, 10, or 20. All CPL spectra were measured at pH 7.4 and room temperature.
2.9. Instrumentation
- The custom-built CPL spectrometer which was designed in our laboratory [2, 4, 22] consists of three subsystems; the excitation source, the circular analyzer and monochromator (the emission optics), and the photodetection electronics. The excitation source used for all CPL experiments described in this work was a 4.0 watt, continuous-wave (CW) Argon-ion laser (Cigereb Ubbiva 70-40). The laser was capable of providing both single-line (457.9-514.5 nm) and all-line (four-watt total) modes. Quartz florescence sample cells were use throughout the experiments. The linearly polarized laser beam causes emission of light which consists of partially left and right circular polarization (elliptical polarization). The emitted light passes through a circular analyzer which consists of two parts; a Photoelastic Modulator (PEM), and a linear polarizer oriented at 45° with respect to the crystal axis of the modulator and placed directly after the PEM. The function of this analyzer is to discriminate between the left and right polarized light. The PEM is a piezo-optical birefringence modulator, which is composed of an isotropic transparent crystal driven by a voltage, Vm, and oscillating at 50 KHz between 1/4 and 3/4 wave retardation [23]. For each alternation cycle of the PEM, the left and right circularly polarized component of the emitted light is converted into the plane of polarization of the analyzing linear polarizer, and is then detected by a photo multiplier tube. The amplitude has to be set in a manner such that the resultant phase difference is equal to a quarter-wave retardation. Each time the computer deals with a new emission wavelength the amplitude changes in such a way that the phase difference is always equal to a quarter-wave retardation. Most of the stray excitation light is eliminated by a long pass filter which is located between the circular analyzer and the sample. There are no lenses between the sample cell and the circular analyzer for light collimation because they would affect the circularly polarized components of the emission.
3. Results and Discussion
- Lanthanides such as terbium were used as a luminescence source over 25 years and the strength of binding (binding constant) of these metals to transferrin was determined by previous research [24]. The values of the binding constants (strength of luminescence emission) of these lanthanides to transferrin were high enough and this showed that Tb-transferrin system was proper to be used in CPL measurements.Difference-UV coupled with Circularly Polarized Luminescent is a major instrument for the investigation of the biological macromolecules. In fact Difference-UV shows the strength of metal bindings to biological molecules such that kinetics and thermodynamic aspects are studied. However, the CPL system can detect and measure the amount of molecular chirality change which is directly related to conformational change of biomolecules. Knowledge about cause and consequence of conformational changes may help to reveal the biological functions of proteins and other biomolecules.
3.1. Difference-UV Titration Spectra of Tb with Tf
- The difference-UV titration spectra of terbium with apotransferrin were obtained by titration of apotransferrin with an acidic solution of terbium chloride and scanning the wavelength range of 240 to 320 nm as shown in Fig.1.
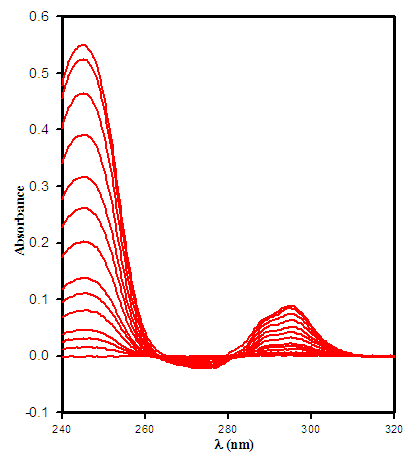 | Figure 1. The difference-UV titration spectrum of Tb(III) with apotransferrin at pH 7.4, 0.1 M hepes and 25 °C |
3.2. CPL of Tb-Transferrin
- In this research, the CPL instrument is used to measure the conformational changes in Ovotransferrin protein; a chicken serum transferrin. Circularly polarized luminescence is the emission analogue of Circularly Dichrism, and monitors the chirality of excited state molecules. CPL measurement have essential role in revealing biological functions of macromolecule such as protein. One of the main activity of these large biomolecules is changing their conformations when bind to metals such as lanthanides, anions like F-, ClO4- or other anions [25, 26]. Analyzing different CPL spectra of these molecules in different stats may help to observe conformational changes regarding kinetics of metal releasing from metal binding site of proteins. For example, iron releasing kinetics from metal binding site of human transferrin is very crucial in treating thalassaemia disease a well know sickness in Iran because thalassaemia belt is located in Iran.A solution of transferrin containing 2 equivalents of Tb(III) was irradiated directly with 488 nm radiation line of an Ar-ion laser, and the intense emission from the 5D4→7F5 transition of Tb(III) was measured. Fig. 2, shows a plot of total emission(I) and glum vs. emission wavelength. The CPL spectra consist of three main peaks. A large negative peak with minimum of -0.2 at 541 nm, a maximum peak of 0.6 at 545 nm and another minimum at 553 nm are shown in Fig.2. These peaks are related to expected crystal field splitting of Tb(III) in a low symmetry site. Although this crystal field splitting can be seen in the total emission, it is very small and has a complex pattern. The value and pattern of the glum spectrum is indicative of the chirality associated with the coordination environment of the metal binding sites in the protein. Any conformational changes during metal or anion binding which affects the chirality of the coordination environment will be reflected in the glum spectrum.
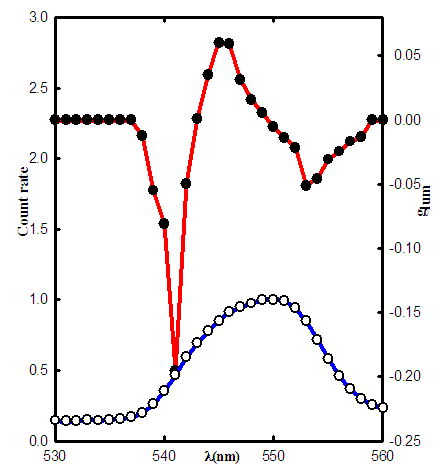 | Figure 2. CPL and total emission spectra of Tb-Tf-Tb complex ( ◦ total emission, • glum ) |
3.3. CPL Titration of Tf with Tb(III)
- A series of experiments in this research show that free ions of Tb(III) in aqueous solution do not have considerable emission, therefore any kind of measurable emission resulted from metal ions bond to the protein. The spectrum of emission intensity due to 5D4 → 7F5 transition at 545.5 nm with equivalent number of Tb(III) is shown in Fig. 3.
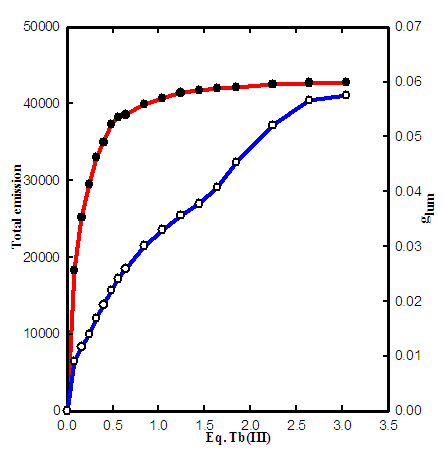 | Figure 3. CPL titration of apoTf with Tb(III) at 5445 nm and 3 mM bicarbonate ( ◦ total emission, • glum ) |
3.4. CPL of Tb-Lactoferrin and Tb-Ovotransferrin
- Lactotransferrin is the iron-binding protein which was originally isolated from human milk. Milk and some other biological fluids such as tears, bile, and seminal fluid contain 10 to 50 μM Lactotransferrin [27]. The Lactotransferrin concentration is very high in tears (25 μM), where it represents 25% of the total protein mass [28]. Ovotransferrin (Conalbumin), the iron-binding protein of egg white, is found in the eggs of all birds in amount ranging from 2 to 16% of the dry weight of egg white [29].The total emission and CPL spectra of both human lactoferrin and chicken ovotransferrin were measured after adding two equivalents of Tb(III) to these protein samples as shown in Fig. 4, and 5 respectively.
 | Figure 4. CPL and total emission spectra of human lactotransferrin ( ◦ total emission, • glum ) |
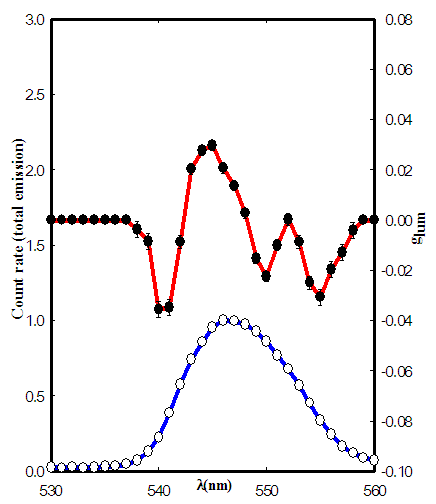 | Figure 5. CPL and total emission spectra of chicken ovotransferrin ( ◦ total emission, • glum ) |
3.5. Anion Binding Properties of Transferrins
- Another significant interaction with biological macromolecules is anion interaction or binding to different parts of biological molecules. Unlike metals that have specific binding sites in the biological molecules, anions behave more complex than metals and they may bind to different parts of the molecules or have a specific binding site for its biological functions. However, anions may have crucial rule in controlling biological activities in macromolecules via conformational changes that they cause in the molecules. In fact, some anions may have been made for such an important biological action. Cowart et al. [30] proposed a conformational change as the initial step in the removal process. In this mechanism the rate determining step in the iron-removal reaction is a conformational change of the protein from a closed form to an open form in which the iron is accessible to other ligandsWe have conducted preliminary studies on the effects of phosphate, sulfate, nitrate, thiocyanate, perchlorte and fluoride on the Tb-Tf-Tb complex by titration one mL of this protein complex with these anions at pH 7.4 and room temperature. The glums were measured at a single wavelength of 545.5 nm where we could have the advantages of both high emission intensity and a relatively large glum Fig. 6, shows plots of glum vs. anion concentration. At this wavelength the addition of relatively low concentration of anions causes a much larger decrease in glum than was observed at 543 nm. Even though the reason for this difference is not clear yet but it may be due to form of binding and strength of interaction of anions at two different positions of molecules. The anion that interacts stronger, it involves with bigger crystal field splitting and grater changes in glum.
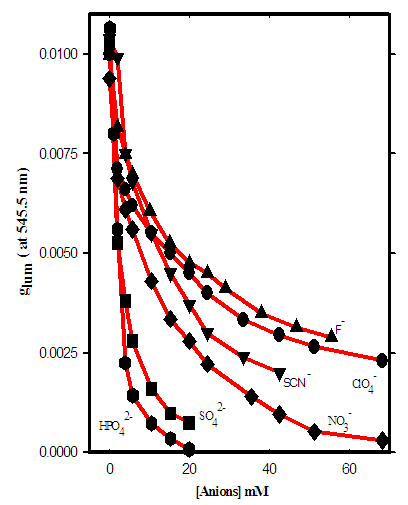 | Figure 6. CPL titration of some inorganic anions with Tb-Tf-Tb. Glum values are measured at a single wavelength of 545.5 nm |
4. Conclusions
- Difference-UV and CPL spectroscopy are complementary. Luminescent metals such as terbium, can replace metals which are natural substrate of biological molecules and mimic their functions. Anion binding to proteins and metal releasing properties are extensive area for further investigations. Life strongly depends on biological activities of macromolecules such as different proteins. Half of all proteins contain a metal and one third of all proteins require metals to carry out their functions such as; Storage and transport metalloproteins, metalloenzymes, Signal- transduction metalloproteins. In this regard, symmetry, folding, conformational changes and in general relative movement of different parts of proteins or movement of lobal domains in large biological molecules may have intensive effect on kinetic and thermodynamic properties of metal release and main biological functions in macromolecules. On the other hand, detail investigation of these kinds of biological molecules due to complexity and large number of crowded spectroscopically active atoms, it is not possible to use regular instrument to measure these biological movements. Fortunately, in this respect, CPL technology and functions can be a great help to determain and measure the main variables for almost accurate prediction of macromolecules behavior and secret biological functions. Conformational changes of large molecules due to anion binding must be more investigated because for one molecule of protein, energy of anion binding is not enough to create movement in such a large molecule. Therefore, other mechanisms such as intramolecular balance or partially self awareness of the protein is expected which needs more investigations. There is a genetic disorder called thalassaemia in which the body is unable to synthesize functional hemoglobin and as a result the person is anemic. In this case, repeated transfusions of blood are necessary for the person to survive. Unfortunately, these blood transfusions cause an accumulation of iron in the body, which eventually results in iron toxicity and premature death. The design of a proper chelator to help release iron from transferrin in the form of an excretable complex is one main goal for transferrin chemists.
ACKNOWLEDGEMENTS
- I would like to acknowledge the University of Payame Noor of Lamerd, for their financial support and the opportunities that were provided for our research. I sincerely thank Fatemeh Mostaghni, Homa Shafiekhani and Saeid Zahmatkesh for correction and editing this paper.