-
Paper Information
- Paper Submission
-
Journal Information
- About This Journal
- Editorial Board
- Current Issue
- Archive
- Author Guidelines
- Contact Us
American Journal of Biochemistry
p-ISSN: 2163-3010 e-ISSN: 2163-3029
2015; 5(1): 1-5
doi:10.5923/j.ajb.20150501.01
Postmortem Time Affects Brain, Liver, Kidney and Heart DNA in Male Rat
 Abstract
 Reference
 Full-Text PDF
 Full-text HTML
Osaretin A. T. Ebuehi, Motolani Amode, Ayooluwa Balogun, Adenike Fowora
Department of Biochemistry, College of Medicine, University of Lagos, Lagos, Nigeria
Correspondence to: Osaretin A. T. Ebuehi, Department of Biochemistry, College of Medicine, University of Lagos, Lagos, Nigeria.
| Email: |  |
Copyright © 2015 Scientific & Academic Publishing. All Rights Reserved.
The aim of this paper is to evaluate the effect of post-mortem time (0, 24, 48 h) on the integrity of DNA extracted from the brain, liver, heart and kidney of male albino Sprague –Dawley rats. Random Amplification of Polymorphic DNA–Polymerase Chain Reaction (RAPD-PCR) followed by agarose electrophoresis were used to detect the correlation between DNA integrity and post mortem time. The results of the post-mortem DNA profile showed that DNA degradation was a time dependent process. DNA from brain, as compared to liver and kidney DNA, showed a slower degradation rate and therefore brain could serve as a valuable organ for studying degradation in longer post-mortem time. This study provides the first DNA profile analysis of the postmortem progress of DNA degradation in rats.
Keywords: Postmortem time, DNA degradation, RAPD-PCR, Brain, Liver, Kidney
Cite this paper: Osaretin A. T. Ebuehi, Motolani Amode, Ayooluwa Balogun, Adenike Fowora, Postmortem Time Affects Brain, Liver, Kidney and Heart DNA in Male Rat, American Journal of Biochemistry, Vol. 5 No. 1, 2015, pp. 1-5. doi: 10.5923/j.ajb.20150501.01.
1. Introduction
- One of the most important longstanding problems in the field of forensic medicine is the determination of the time of death upon the discovery of a possible homicide victim [1]. With a majority of homicide victims discovered within the first 48h, it is critically important to be able to determine time of death quickly, and with accuracy and precision. Current methods of determining post-mortem interval (PMI) vary, but none can provide better than an 8-h window time estimate [1-5]. Deoxyribonucleic acid (DNA) analysis was applied as a possible method for post-mortem interval determination [6-10]. The determination of the quantity of DNA should be an objective and exact way to estimate the PMI [11-14]. Therefore, it is important to know which organ is most reliable for DNA extraction and also to know the effect of PMI on DNA degradation. Although livor mortis, rigor mortis, and to a lesser degree, algor mortis have been used to estimate the post-mortem interval, most experienced forensic pathologists agree that these characteristics provide at best, “post-mortem windows” [15-18].Several methods have been developed to quantify DNA, from basic UV spectrometry, through gel-based techniques, to dye staining, blotting techniques, and very recently, DNA amplification methods (Polymerase Chain Reaction, PCR) [19]. Application of DNA analysis for the personal identification of decomposed body has had difficulties [20, 21]. Of these difficulties, the most important is the degradation of template DNA [22, 23], which is thought to be caused mainly by intracellular enzymes and decomposition through bacterial proliferation in the corpse [24-29].The present study used a simple, easy, applicable and highly informative electrophoresis method that makes it ideal for the busy forensic laboratory. Liu et al. [2] suggest that computerized image analysis technique (CIAT) is a useful and promising tool for the estimation of early PMI with good objectivity and reproducibility as quantitative indicator for the estimation of PMI within the first 36h after death in rats. DNA degradation and the postmortem interval in combination with conditions such as temperature have been investigated in some studies [24-26]. However, the relation has not been investigated in sufficient detail. The objective of the present study is to investigate the postmortem time on DNA extracted from the brain, liver and heart of male Sprague - Dawley rats.
2. Methods
- Twenty male Sprague - Dawley albino rats (174.53±6.93g) obtained from the Animal House of the National Institute for Medical Research (NIMR), Yaba, Lagos, were used in this study. The rats were divided into four equal groups, designated as Rat Groups A, B, C, and D. The rats were sacrificed via cervical dislocation, their brain; liver, heart and kidney were excised at point of death (0h) into a micro tube and labeled. Samples were also collected 24h and 48h later. The DNA extraction was carried out according to manufacturer’s instructions of the QIAmp DNA Extraction Kit. DNA profiling was carried out by Random Amplification of Polymorphic DNA Polymerase Chain Reaction (RAPD-PCR). The RAPD PCR was carried out using RAPD primer-OPC-04: CCGCATCTAC [2].The PCR was performed in 25 µl of a reaction mixture containing DNA (10-200ng), 200 µM of each deoxynucleoside triphosphates (dNTP) (Promega), 2.5 mM MgCl2, 1X PCR Buffer, 20 pMol primer, 2.5 unit of Taq DNA polymerase (Promega) and sterile distilled water. Thermal cycling was conducted in an Eppendorf Master Cycler Gradient for an initial denaturation of 94°C for 5min followed by 40 amplification cycles of 1min at 94ºC; 1min at 28ºC and 1min at 72ºC. This was followed by a final extension step of 10min at 72ºC. The amplification product was separated on 1% agarose gel electrophoresis and visualized by ethidium bromide staining. 1kb DNA ladder was used as DNA molecular weight standard.
3. Results
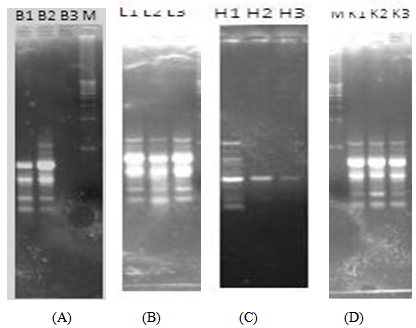
- The results of RAPD profiles of the brain, liver, heart and kidney of Rat Group A at 0h, 24h and 48h post-mortem are presented in Figure 1.RAT A
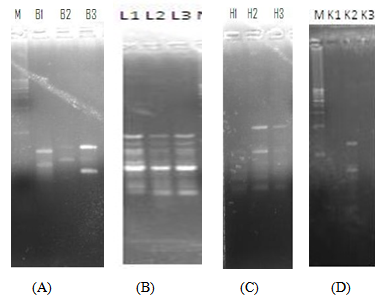 | Figure 1. RAPD profiles of the brain, liver, heart and kidney of RAT A at 0h, 24h and 48h post-mortem |
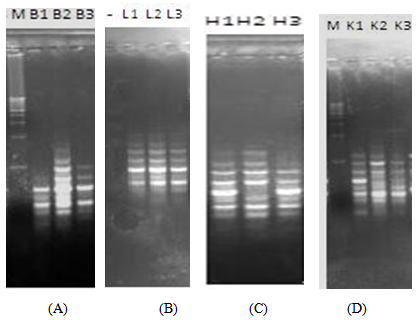 | Figure 2. RAPD profiles of the brain, liver, heart and kidney of RAT B at 0h, 24h and 48h post-mortem |
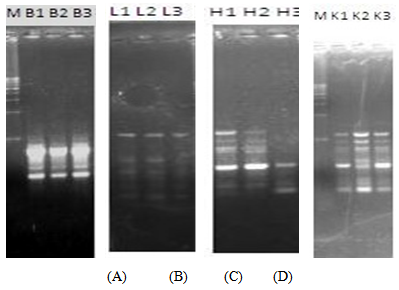 | Figure 3. RAPD profiles of the brain, liver, heart and kidney of RAT C at 0h, 24h and 48h post-mortem |
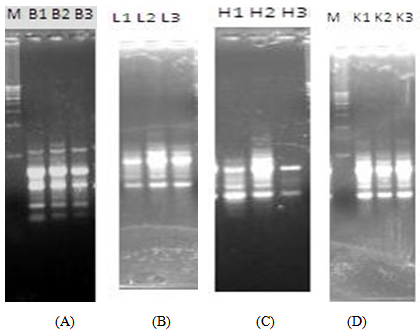 | Figure 4. RAPD profiles of the brain, liver, heart and kidney of RAT D at 0h, 24h and 48h post-mortem |
 | Figure 5. RAPD profiles of the brain, liver, heart and kidney of RAT E at 0h, 24h and 48h post-mortem |
4. Discussion
- The determination of the PMI is one of the most valuable subjects in forensic practice. However, it is often very difficult to accurately determine the PMI in daily practice. Forensic DNA technology has recently been used to estimate the PMI [26-29]. DNA decays after death, in biological samples, and the ensuing damage is manifested in many forms. In postmortem studies, no previous researchers studied the integrity of the DNA in these organs using this Random Amplification of Polymorphic DNA-PCR method.Generally, results of this study revealed gradual degradation of intact nuclear DNA in the brain, kidney and heart, with increasing PMI. These findings coincide with those of Luo et al., [32-34] who showed gradual decrease of bone marrow DNA with prolongation of PMI. In addition, El-Harouny et al., 2009 [35] showed that using DNA maximal optical density, there was significant lower mean values in the concentration of brain, spleen, lungs, liver and skeletal muscle, with increasing PMI than control group at zero time at intact DNA which was prominent in the lungs beginning from 3 hours post mortem and in the spleen beginning from 6h post mortem. There is a significant (P<0.01) higher mean value of maximum optical density than control group at 600, 400 and 200 base pairs which is prominent in the liver. In agreement with these findings, Johnson and Ferris, 2002 [36] reported that in tissues, such as liver and kidney, enzymes tend to be more active and accelerate DNA decomposition.In the present study, the RAPD method was useful in viewing the profile of random segments of genomic DNA. In addition, Lin et al., [37] observed that the DNA degeneration rate of liver cells had a linear relationship to early postmortem period in rats. Considering the brain, liver, heart and kidney DNA degradation, the brain DNA degradation occurred at a slower rate than the other organs. The liver also showed a little regularity in their PMI DNA profile. The bands in the RAPD profiles of the brain and liver were fairly similar showing that the DNA in the brain, and the liver was more intact as compared to the heart and kidney, where disappearance of bands were more prominent. [38-40] According to these results of this study, it can be concluded that the degradation of DNA shows a relationship with PMI in the studied organs. This degradation revealed sequential time dependent process with the potential for use as a predictor of PMI. The slower degradation of brain DNA suggests that at a later PMI the brain, and then liver is a preferred organ for forensic studies than the heart and kidney.The present study used a simple, easy, applicable and highly informative PCR method that makes it ideal for the busy forensic laboratory. These photographic images therefore were able to show that after 48hrs of decomposition Brain DNA can be used to get intact amount of DNA, then liver, which can then be used to determine PMI at later times. Therefore, the RAPD method can be used for a reliable and sensitive analysis of PMI and future human studies should be considered.