-
Paper Information
- Previous Paper
- Paper Submission
-
Journal Information
- About This Journal
- Editorial Board
- Current Issue
- Archive
- Author Guidelines
- Contact Us
American Journal of Biochemistry
p-ISSN: 2163-3010 e-ISSN: 2163-3029
2014; 4(2): 35-40
doi:10.5923/j.ajb.20140402.04
Physicochemical Analysis of Honey Samples Collected from Local Markets of Rawalpindi and Islamabad, Pakistan
 Abstract
 Reference
 Full-Text PDF
 Full-text HTML
Farida Iftikhar1, Rashid Mahmood1, Noor Islam1, Ghulam Sarwar1, M. Asif Masood2, Hammad Shafiq3
1Honeybee Research Institute, NARC, Islamabad
2Social Sciences Institute, NARC, Islamabad
3Department of Food Technology PPMAS-Arid Agriculture University, Rawalpindi
Correspondence to: Farida Iftikhar, Honeybee Research Institute, NARC, Islamabad.
| Email: |  |
Copyright © 2014 Scientific & Academic Publishing. All Rights Reserved.
The present study was carried out to determine the quality of honey samples with local and imported brands available in the Rawalpindi and Islamabad markets. Physicochemical analysis of these samples were carried out using AOAC methods and compared with Codex Alimentarius Commission & European Union Council Directive. The ranges of different parameters are 17.0-19.0% moisture, 3.24-6.5 pH, 7.0-25.0 acidity, 7.60-8.70% sucrose, 75.0-83.0% total sugars and 0.08-0.80 mS/ cm electrical conductivity. These parameters are within the normal ranges. Some of the samples showed high hydroxy methyl furfural (HMF) and low diastase number which confirm low quality of the samples. One sample LB5 has highest value of 95.0 mg/kg of hydroxy methyl furfural (HMF) while IBE has 79.0 and LB12 has 75.0 mg/kg HMF. These are higher than the recommended ranges.
Keywords: Honey, Physicochemical, HMF, Diastase, Quality
Cite this paper: Farida Iftikhar, Rashid Mahmood, Noor Islam, Ghulam Sarwar, M. Asif Masood, Hammad Shafiq, Physicochemical Analysis of Honey Samples Collected from Local Markets of Rawalpindi and Islamabad, Pakistan, American Journal of Biochemistry, Vol. 4 No. 2, 2014, pp. 35-40. doi: 10.5923/j.ajb.20140402.04.
Article Outline
1. Introduction
- Honey, one of the major bee products, is a sweet viscous fluid made from the nectar of plants. Honey was defined as “the sweet substances produced by honeybees from the nectar of blossoms or from secretions on living plants, which the bees collect, transform and store in honey combs” [1]. It is a concentrated aqueous solution of invert sugar that contains a mixture of other carbohydrates, amino and organic acids, minerals, aromatic substances, pigments waxes and pollen grains to make it complex [2, 3, 4, 5]. There are many reports on the presence of unstable compounds e.g. enzymes, substances of hormonal character, some vitamins and a few minor compounds [6, 7]. Honey is widely used in food, sweetening, medicine etc. [8]. It is produced in almost every country of the world and is very important energy food. Honey cannot be considered a complete food by human nutritional standards but it does offer potential as dietary supplement. For infants and senior citizens honey can be more easily digested and more palatable carbohydrate food than saccharose by itself [9]. Food processors are known to use honey in many different food products: sweetness, functional advantages (viscosity, flavor hygroscopic miscibility spreadability and colour) and as natural appeal [10]. Many scientists have reported physical and chemical properties of different types of honey. Effects of principal chemical constituents on the quality of honey have been reviewed [11]. Recently, there is a worldwide increasing demand by consumers to natural foods and foods claimed to enhance human health. Honey has a priority in this concern as it contains oligosaccharides beside a wide range of other valuable nutrients.Honey is generally evaluated by a physicochemical analysis of its constituents. Several of these constituents are of great importance to the honey industry. These constituents influence the storage quality, granulation, texture, flavor and the nutritional quality of the honey. These are also responsible for the medicinal quality of honey. The International Honey Commission (IHC) has therefore proposed certain constituents as quality criteria for honey. These constituents include: moisture content, electrical conductivity, reducing sugars, sucrose content, minerals, free acidity and hydroxy methyl furfural (HMF) as reported by Bogdanov et al [12].Most of the honey sold in grocery stores is not raw. In some cases it has been heated to kill any bacteria that might be present in it. Honey is a precious food and the enzymes in it are sensitive to heating. They are destroyed by the heat-treatment and render the honey unhealthy for adults and children. The levels of enzymes present in honey are sometimes assayed and used as a guide to honey quality. The enzymes in honey (invertase, glucose oxidase, amylase, etc.) come from the bees, or from the plant where the bee foraged. They are present in very small quantities, but may still have a nutritional importance in the human diet. The enzymes are very sensitive to overheating (above 35°C) or storage at too high a temperature. Because they are destroyed by heating, a low enzyme level may mean that honey has been heated.There are branded and unbranded honeys available in the market. Significant differences may exist between honey brands in terms of nutritional as well as quality of honey. Most of the people are unaware about the quality of honey they consume. It is important to do the quality testing of commercial honey due to increasing problems related to adulteration and tampering with natural honeys sold in the market. Therefore a study was designed to test the quality of commercial honey available in the market for comparison with International Honey Standards to get a useful data for the honey consumers.
2. Materials and Methods
- The present study was conducted in the laboratory of Honeybee Research Institute, (NARC) Islamabad. The study was designed to explore the quality of twenty four honey samples purchased from local markets of Rawalpindi and Islamabad.Honey samples were analyzed for pH, moisture, total sugars, acidity, sucrose, HMF, electrical conductivity and diastase enzyme present in honey by following AOAC (Association of Analytical Chemists) Method [13].
2.1. Determination of Moisture Content
- Moisture content of honey samples were determined by using refractrometer reading at 20ºC and obtained corresponding percentage moisture from AOAC standard table.
2.2. Determination of pH
- pH is a measure of the acidity or basicity of an aqueous solution. Solutions with a pH less than 7 are said to be acidic and solutions with a pH greater than 7 are basic or alkaline. In actual practice, pH is determined by using pH meter. pH meter was calibrated by using standard buffer of pH 4 and 7. Honey (10g) was weighed accurately and dissolved in 75 ml distilled water. Took honey solution in a beaker and when the meter got stable took readings directly from pH meter.
2.3. Determination of Acidity
- Acidity can be defined as ‘the percent acidity in a sample determined by titration with a standard base and stated in terms of predominant acid in the sample. Weight 10g honey into 75 ml distilled water, pH was noted and honey solution was neutralized by using NaOH till pH 8.3.% Acidity = Vol of NaOH used × Weight of Honey.
2.4. Determination of Sugars
- Fehling solution A, Fehling solution B, Methylene blue solution, NaCl solution, Hydrochloric acid. Took (5.00g) of honey in a beaker, add D. H2O and dissolve it make up to the 100ml. Added 2-3 drops of phenopthelene then added NaOH solution till the solution turns in to pink color. Added HCl to the solution till it turns to its original color and then added distilled water to 200ml total volume (honey solution). 5ml of Honey solution + 5ml fehling solution A + 5ml fehling solution B in a conical flask and boiled for 2minutes. During boiling add 3 drops of methylene blue indicator; titrate with honey solution till brick red colored end point. Noted volume of honey solution used.
 Take (5.00g) of honey solution in a beaker add d.H2O and bring up to 100ml distilled water. Add 2-3drops of phenopthelene then add NaOH solution till the solution turns in to pink color. After that add HCl to the solution till it turns to its original color and then add distilled water to 200ml (v1) total volume. Take 50ml (w2) from above solution, 5g citric acid and boil for 10 minutes and cool it. Then neutralize it as in reducing sugars and add distilled water to make total volume up to 200ml (v2). Take 5ml of honey solution add 5ml fehling solution A, 5ml fehling solution B and boil for 2min. add 2-3drops of methylene blue and titrate with honey solution till it turns in to brick red color. Note the volume of honey solution used.
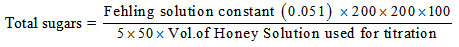 Non-reducing sugars = total sugars – reducing sugars.
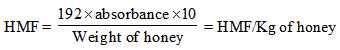
2.5. Determination of HMF (hydroxyl-methylfurfuraldehyde)
- Based on method of Winkler (1955). 10g of honey sample was weight and dissolved in 20ml oxygen-free distilled water. This was transferred to a 50ml graduated flask and made up to volume (honey solution). The sample was tested after preparation without delay. 2.0ml honey solution was pipette into each of two tubes and 5.0ml p-toluidine solution was added to each. Into one test tube 1ml water was pipetts and into other 1ml barbituric acid solution and both mixtures were shaken. The one with add water serves as the water blanks. The addition of the reagents was done without pause and finished in about 1-2 min. the extinction of the sample was read against the blank at 550nm using 1-cm cell immediately the maximum value was reached.The method was calibrated by using a standard solution of hydroxymethylfurfuraldehyde (HMF) standardized by dissolving commercial or laboratory prepared HMF and assaying spectrophotometerically where €=16830 (J.H.Turner) at 284 nm using 0-300 mg standards. An equation is given by which results may be roughly worked out:
2.6. Determination of Electrical Conductivity
- The Electrical Conductivity was determined by conductivity meter (CM-40S, TOA Japan). Electrical Conductivity meter was first calibrated with water and then conductance cell was dipped into honey Solution (10.0%) and reading was noted after stabilization of instrument.
3. Statistical Analysis
- A Complete randomized experimental design was used. Twenty four [24] honey samples collected from the local market were combined and differences among honey from different brands in pH, Acidity, Moisture, Electrical conductivity , Sucrose, Total Sugar, Hydroxymethylfurfural (HMF) and Diastase Number were determined by one-way Analysis of Variance (ANOVA) [14] using the General Linear Model (GLM) in the PC MINITAB version 15 Statistical Software [15]. Analysis of variance is a collection of statistical methods used to analyze the difference between group means and their associated procedures such as variation among and between groups. Variable in the means of twenty four types of honey brands showing significant differences in the ANOVA were further separated using least significant difference (LSD) test.
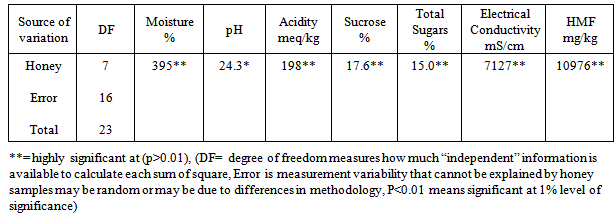
4. Results
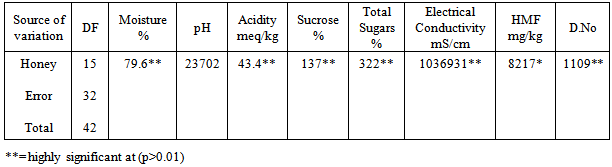
- The results of physicochemical analysis of twenty four honey samples collected from the local market of Rawalpindi/ Islamabad are given in the tables 1-4.All of twenty four samples were tested for moisture, pH, acidity, sucrose, total sugars, electrical conductivity, HMF and diastase enzyme. ANOVA was used to observe the statistical significance of the effects of various variables evaluated during the experiment. Concise ANOVA and means are summarized. The results (Table 1) indicate statistically significant difference among eight types of honeys from different import brands pertaining to the following variables pH, acidity, moisture, E.C, sucrose, total sugar and HMF. Means were separated using least significant difference (LSD) test (table 2).
|
|
|
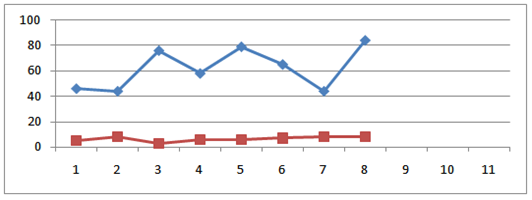 | HMF (blue) and diastase number (red) of eight imported branded honey sample |
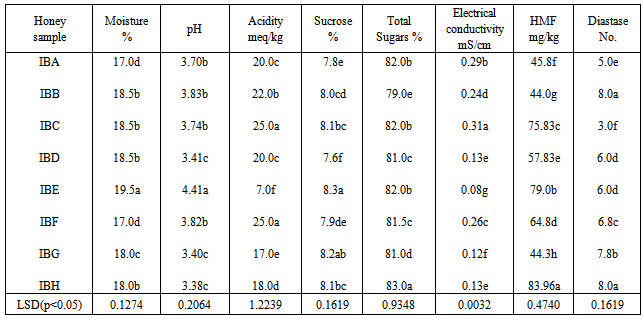
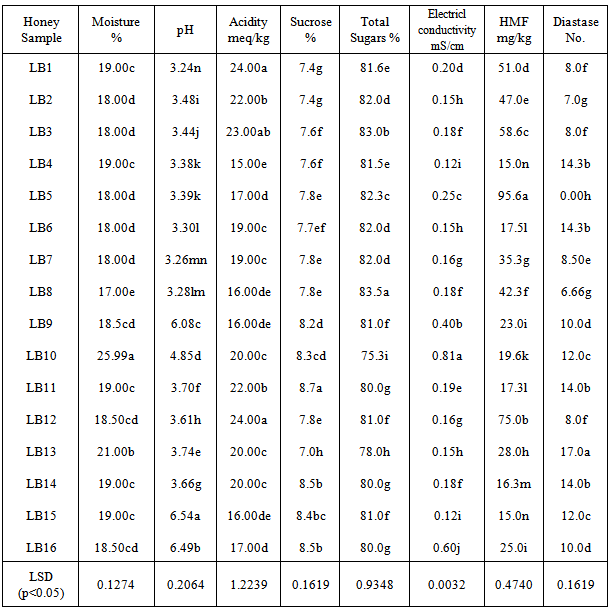
 The physicochemical analysis of sixteen honey samples of local brand is shown in Table 3 and 4. When the moisture % contents of these honey samples are observed can be divided in three groups. One group has moisture in the range of 17.0-18.0% the other have 19.0% moisture. One sample has 21.0% moisture while LB10 shows highest moisture of 25%.Most of the samples have pH in the range of 3-4 while one sample has pH of 4.85. Three samples LB9, LB15 and LB16 have pH 6.0, 6.5 and 6.4 respectively. All are significantly different from each other (statistical significance is often determined by the p- value of a hypothesis test. If the p-value is low for example, less than 0.05, then the statistic is said to be statistically significant). The sucrose and total sugars are in the normal ranges. The electrical conductivity (EC) of most of the local branded honey samples ranges between 0.1-0.2 mS/cm. One sample LB9 has 0.40mS/ cm while LB16 has 0.60 mS/cm of electrical conductivity. LB10 has maximum value of EC i.e. 0.8 mS/cm.
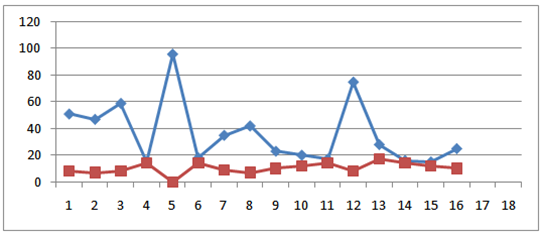 | HMF (blue) and diastase number (red) of sixteen local branded honey samples |
5. Discussion
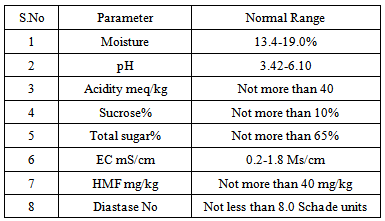
- The results of different parameters of all the honey samples collected from the markets of Rawalpindi and Islamabad were compared with the Codex Alimentarius and European Standards [16]. It was observed that moisture, pH, acidity, sucrose, total sugars and electrical conductivity are within the normal ranges. HMF and diastase enzyme values of honey are quality criteria for testing and as index of heat treatment and prolonged shelf life of honey. The excessive heat treatment during processing of honey or prolonged storage above 27℃ lowers the diastase and increases the HMF. The levels of enzymes present in honey are assayed and used as a guide to honey quality. The enzymes in honey (invertase, glucose oxidase, amylase, etc.) come from the bees, or from the plant where the bee foraged. They are present in very small quantities, but may still have a nutritional importance in the human diet. The enzymes are very sensitive to overheating (above 35°C) or storage at too high a temperature. Because they are destroyed by heating, a low enzyme level may mean that honey has been heated. HMF is produced when fructose is decomposed and depends upon the pH, heating temperature and storage period [17, 18, 19]. The HMF is used as standard for testing honey’s freshness and overheating of the honey. Variable means followed same or a common letter do not indicate statistical significant difference between any two means using LSD (p<0.05). Same letters means no statistical difference. The Codex Alimentarius and EU recommend a maximum of 40mg/kg. In our study the HMF is ranged 15.0 – 95.6mg/kg which is not within the standard range. As regarded the diastase activity it varied from 0.0-17(DN). These were significantly different for all honey samples. Honey proteins are mainly enzymes [20]. These enzymes are added by the bees during honey ripening process. Diastase and invertase are the main enzymes used as indicators of honey freshness [21]. The diastase and invertase activity of honey depends upon the botanical origin [22, 23] and in this way have limited indicating power for the freshness. The HMF and diastase enzyme values of these samples are not within the normal ranges. Most of the samples have high value of HMF and low diastase number. HMF is hydroxymethylfufural, a breakdown product of fructose (one of the main sugars in honey) that is formed slowly and naturally during the storage of honey, and much more quickly when honey is heated. The amount of HMF present in honey is the reference used as a guide to the amount of heating that has taken place: the higher the HMF value, the lower the quality of the honey is considered to be. Some countries set an HMF limit for imported honey (sometimes 40 miligrams per kilogram), and honey with an HMF value higher than this limit will not be accepted. However, some honeys have a naturally high HMF level. HMF is measured by laboratory tests. In Table 2 all of the eight samples showed more than 40.0 mg/kg of HMF and 3.0-8.0 diastase value. It means these samples are not good quality honey because more shelf life or heating on high temperature for more than 30 minutes destroy the honey quality. As a result HMF increases and diastase number decreases. In Table 4 the HMF value of six honey samples are highly significantly different from each other and are more than the normal range. One sample LB5 has highest value of 95.0 mg/kg of HMF while LB12 has 75.0 mg/kg HMF. LB1, LB2, LB3 and LB8 are 51.0, 47.0, 58.0 and 42.3 mg/kg respectively. The diastase number of these honey samples are 0.0, 8.0, 8.0, 7.0, 8.0 and 6.6 respectively. These high HMF value and low D.No. indicate that the samples are of low quality honey.
References
| [1] | Codex Alimentarius. 2001. Draft revised standard for standard for honey (at step 10 of the codex procedure). Alinorm., 01/25: 19-26. |
| [2] | Speer, K. and A. Montage. 1987. Decomposition products of phenylalanine as aroma components of honey. Deut. Leb. Rund., 83: 103-107. |
| [3] | Bogdanov, S., V. Kilchenmann and P. Fluri. 1998. Influence of organic acids and components of essential oils on honey tastes. Am. Bee. J., 139: 61-63. |
| [4] | Qiu, P. Y., H. B. Ding, Y. K. Tang and R. J. Xu. 1999. Determination of chemical composition of commercial honey by near infrared spectroscopy. J. of Agri. Food Chem., 47: 2760-2765. |
| [5] | Sanz, M.L., J. Sanz and C.l. Martinez. 2004. Presence of some cyclitols in honey. Food Chem., 84: 133-135. |
| [6] | Coco, F.L., C. Valentini, V.Sapra and L. Ceccon. 1996. High performance liquid chromatographic determination of 2-furaldehyde and 5-hydroxymethyl-2-furaldehyde in honey. J. of Chromatography A., 749: 95-102. |
| [7] | Crews, C., J. R Startin and P. A. Clarke. 1997. Determination of pyrrolizidine alkaloids in Honey from selected sites by solid phase extraction and HPLC-MS. Food Addition Contamination., 14: 419-428. |
| [8] | Sa-nguandeegul R. Honey and bee products in Thailand. Symposium on Biodiversity of Honey Bees and Bee Products, Chiang Mai, Thailand, 2003: 24-25. |
| [9] | Mendes E, Brojo Proenc E., Ferreira IMPLVO, Ferreira MA. Quality evaluation of Portuguese honey. Carbohydrate Polymers., 1998; 37: 219-223. |
| [10] | Wilson RD and Crane E. Uses and products of honey: A Comprehensive Survey: E. Crane ed Hameman Publisher Ltd, London, U.K. 1976; pp 378-380. |
| [11] | Estupinon S and Sanjuan E. Quality parameters of honey II chemical composition. Alimentaria., 1998; 297: 117-122. |
| [12] | Bogdnov, S., C Lullman, P.Martin, W. Von der ohe and Ho Russmann et al., 1999. Honey Quality, methods of analysis and international regulatory standards: review of the work of the International Honey Commision., Mitt Leb. |
| [13] | AOAC 2002. Sugars and sugar products. In: Official Methods of Analysis of The Association of Official Analytical Chemists, 17th Ed (edited by W. Horowitz). pp. 22-33. Gaithersburg, MD: AOAC International. |
| [14] | Arora P.N., SumeetArora and S.Arora (2007). Comprehensive Statistical Methods. Chapter 19, pp 19.1-19.37. |
| [15] | MINITAB Version 15, Statistical Software, MINITABINC., (2006). |
| [16] | EU Council. 2002. Council Directive 2001/110/EC of 20 December 2001 relating to honey. Off. J. of Eu commun., 10: 47-52. |
| [17] | Subramanian, R; Hebbar, H U; Rastogi, N K, 2007. Processing of honey: A review. InternationalJ. of food properties., 10 (1): 127-143. |
| [18] | Tabouret, T; Mathlouthi, M, 1972. Essai de pasteurization de miel. Rev. Apic., 299: 258-261. |
| [19] | Thrasyvoulou, A, 1997. Heating times for Greek honeys. Melissokomiki Epitheorisi., 11 (2) 79-80. |
| [20] | White, J W, 1975. Composition of honey., In Crane, E(ed.) Honey A Comprehensive survey, Heinemann Edition; London., pp 157-239. |
| [21] | Bogdanov Stefan, 2009. Bood of honey. Bee product Science., Chapter 5. 7. Crews, C., J. R Startin and P. A. Clarke. 1997. Determination of pyrrolizidine alkaloids in honey from selected sites by solid phase extraction and HPLC-MS. Food Addition Contamination., 14: 419-428. |
| [22] | Persano Oddo, L; Baldi, E; Accorti, M, 1990. Diastatic activity in some unifloral honeys. Apidologie., 21 (1): 17-24. |
| [23] | Persano Oddo, L; Piazza, MG; Pulcini, P. 1999. Invertase activity in honey. Apidologie., 30 (1):57-65. |