Manoj Kumar Gupta 1, V. K. Sehgal 2, Dattatreya M. Kadam 3, A. K. Singh 4, Y. K. Yadav 5
1Department of Processing and Food Engineering, CCS HAU, Hisar Haryana
2Department of Processing and Food Engineering, College of Agricultural Engineering, Punjab Agricultural University, Ludhiana, India
3Central Institute of Post Harvest Engineering and Technology, P.O: P.A.U., Ludhiana, Punjab, India
4Veg Sci , CPCT, IARI, New Delhi, India
5Department of Processing and Foodengineering, CCS HAU, Hisar Haryana
Correspondence to: Manoj Kumar Gupta , Department of Processing and Food Engineering, CCS HAU, Hisar Haryana.
| Email: |  |
Copyright © 2012 Scientific & Academic Publishing. All Rights Reserved.
Abstract
Hybrid cauliflower (variety no. 71) samples were dried in hot air convective dryer with drying air conditions of 60℃ and 1m/s. The samples were dried for five different drying bed thicknesses (4, 8, 12, 16, and 20 cm). The moisture diffusivity for the samples ranged from 3.39 X 10⁻⁹ to 1.53 X 10⁻⁹ m2/s. The effect of drying bed thickness on drying time, final moisture content, vitamin C retention, rehydration ratio, browning and overall acceptability of the dried cauliflower was studied and all these parameters were significantly affected by the drying bed thickness. Statistical and sensory analysis revealed that drying bed thickness can be increased up to 8 cm for optimum utilization of the drying conditions.
Keywords:
Cauliflower, Bed-Thickness, Drying-Characteristics, Models, Moisture Diffusivity
1. Introduction
Fruits and vegetables are important sources of essential vitamins and minerals for human consumption. Different fruits and vegetables have their own unique mix of nutrients, which have different healthful effect on the consumers. To make the availability of such products with desired qualitative and quantitative attributes, a focused approach is required to minimize high postharvest losses and to tap the huge availability during glut by means of appropriate technology.Cauliflower (Brassica oleracea) is an important cole crop of north India and belongs to crucefere family and it is cultivated all over India in the winter season. Punjab witnesses two crops of cauliflower round the year, but mostof the production is done during winter. Fresh cauliflower has 92 to 94 percent moisture content (w.b.) and it can be stored for 2 to 4 weeks at 0℃[1]. There are so many techniques to preserve the produce, but drying method comes out the most convenient and feasible option. A number of studies have been conducted to optimize the drying process parameters of cauliflower and a study[2] indicated that dried cauliflower can be stored up to six months at room temperature with the desired attributes. Dehydrated Cauliflower can be used to enhance the test and nutritional value of various products such as rehydrated vegetable mix, soups, canned products, extruded products etc. The selection of proper drying conditions is of prime importance for decreasing thermal stress and maintaining the qualities of key compounds in the rehydrated product.The drying operations in convective heating involves moisture transfer from the wet material to heated air and the process may be illustrated as a transport of moisture from the material core to its surface, followed by evaporation from the surface of the material, and dissipation of water vapour into the bulk of the drying air. Drying causes irreversiblestructural damage to the cellular structure of foods whereby rehydration of the dehydrated product affected. Pretreatment, subsequent drying and rehydration may induce changes in the structure and composition of plant tissues[3], which affect the organoleptic properties of the peppers upon rehydration. Several studies[2,4,5] reveals that the structure of dried foods depends on the drying methods and conditions such as temperature, relative humidity, air velocity and initial physico-chemical characteristics of the product. The quality of end product in terms of sensory and other physic-chemical factors significantly influenced by drying conditions[6,7].The results of thin layer drying can be used to simulate dryers under deep bed drying conditions and can also form the basis for design of specialized drying equipment. Thin layer drying studies for cauliflower have been conducted, however very limited information is available for cauliflower drying behaviour under deep bed conditions. An effort has been made to study the effect of cauliflower bed thickness (4, 8, 12, 16, and 20 cm) in hot air convective drying.
2. Material and Methods
The results of the earlier studies were employed for the present studies. One of the studies, conducted to determine the optimized drying parameters for thin layer drying of cauliflower, showed the drying was effective if drying air temperature was 60.10℃, drying air flow rate was 59.28 m/min, and initial size of the cauliflower was of 3.35 cm[8]. Another study[9] also revealed that the cauliflower samples dried (in thin layer) at 60℃ drying air temperature retained better quality attributes at the end of the 4 months storage. On the recommendations of the above mentioned study, the cauliflower drying was done for different bed thickness at 60℃, and 60 m/min drying air temperature and drying air velocity, respectively. The initial size of the cauliflower was fixed to 4 cm for the ease in sizing.
2.1. Sample Preparation
The fresh cauliflower (Variety 71) was procured from Maerkotla and Samrala villages of district Ludhiana, Punjab from Angrej Singh, Jagtar Singh, and Amir Hussain. Fresh cauliflower was procured for every experiment. Procured cauliflower was destalked and trimmed manually and edible part, curd, was sized down to desirable florets’ sizes with the help of stainless steel knife. The sized cauliflower florets were washed in tap water and drained to remove the excess water. Washed cauliflower samples were blanched by tying them in muslin cloth and dipping the samples in boiling water for 5 minutes[10]. The blanched samples were cooled immediately by keeping them under flowing water to prevent overcooking. The blanched samples were dipped in 1%solution of potassium meta bisulphate, KMS[11] for 20 minutes by tying them in the muslin cloth. Thus treated samples were then put on a screen to drain the excess water.
2.2. Dryer Set Up and Drying Conditions
The experimental convective drier was used to dry the cauliflower samples. Drying chamber had a square base with 51 cm each side. The base was provided with a 35 cm diameter 100-wire mesh size. This base was used to support a column of 2 feet height. Other specifications of the column were: Internal diameter of column: 30 cm, External diameter of column: 34.6 cm, Thickness of plywood sheet: 3 mm, Thickness of insulator (Thermo coal sheet): 1 cm. The column was marked for 4 cm distance interval along the height of column from the base to measure the depth of bed.The cauliflower samples for 4, 8, 12, 16, and 20 cm bed thickness were dried at 60℃ and drying air velocity of 60 m/min. The dryer was started 2 hours earlier the drying runs to get steady state conditions. The weight of the samples during drying was determined with the help of a digital weighing balance having accuracy of 0.01 gm without disturbing the sample from drying chamber. Dehydrated cauliflower samples were packed in high-density polyethylene bags of 500 gauge[10] and the samples were kept at room temperature for further quality analysis.
2.3. Moisture Content Determination
The moisture content of dehydrated cauliflower was determined by standard hot air oven method[12] and was calculated on dry basis, %.
2.4. Drying Characteristics
Moisture ratio and drying rate of the samples for different bed thickness were calculated with the help of the following relationshipsMoisture Ratio (MR) | (1) |
Where, M – Moisture content of drying sample at any time (%, db)Me – Equilibrium moisture content (%, db)Mo – initial moisture content (%, db)Drying Rate | (2) |
Where,DM/Dt = Drying rate, % moisture loss per minuteMi = Moisture content, (% d b) of sample at time tiMi+1 = Moisture content, (%d b) of sample at time ti+1Moisture Diffusivity | (3) |
The solution of the equation can be used to estimate the diffusivity by converting the solution into a linear relationship between the logarithm of moisture ratio and time[13]. The slope of the plot is represented by constant B in Eq. (4) and hence the moisture diffusivity can be determined. | (4) |
Where, A = 8/π2 and B =[(π2De/L2)] and De is the effective diffusivity.
2.5. Quality parameters of the dried cauliflower samples
2.5.1. Vitamin C
Vitamin C of dried cauliflower samples was determined by 2, 4-die chlorophenol indophenol dye method[13].
2.5.2. Rehydration Ratio
Five gm of dehydrated sample was put into a small container and 55 ml of cold water was added. Container was covered with a watch glass and the water was brought to boil. Water was boiled gently for 20 minutes. Sample was turned out onto a white dish which surface was covered with a piece of filter paper to soak the excess water and the weight of sample was recorded and rehydration ratio was calculated by the following formula[11]: | (5) |
Where, B = weight of sample (g) after rehydrationA = weight of sample (g) before rehydration
2.5.3. Non Enzymatic Browning
The increase in the absorbance of the sample extract at 420 nm wavelengths was taken as a measure of non enzymatic browning. Five gm of dehydrated cauliflower sample was soaked in 100 ml of 60% alcohol for 12 hours and filtered. Absorbance of the filtrate was recorded at 420 nm with the help of a spectrophotometer using 60% alcohol as blank and the observations were expressed in terms of optical density[11].
2.6. Sensory Evaluation
A panel of 11 members was drawn from the staff and the members evaluated the rehydrated cauliflower samples on 9 point hedonic scale with 9 for like extremely and 1 for dislike extremely[14]. The samples were evaluated for overall acceptability of the product while considering taste, aroma, colour, and texture of the rehydrated samples.
2.7. Statistical Analysis
Response Surface Methodology (RSM) was used to investigate the main effects of thickness of cauliflower bed on the final moisture content, drying time, vitamin C retention, rehydration ratio, browning, and overall acceptability of the dried samples. Only thickness of the cauliflower bed was selected as independent variables. Box - Behnken design was used for the experimental data. Significant terms in the model for each response were found by analysis of variance (ANOVA) and significance was judged by the F-statistic calculated from the data[15]. Design Expert Ver. 7.1.0[16] was used to fit response surfaces and optimize the drying process.
3. Result and Discussion
3.1. Drying Characteristics
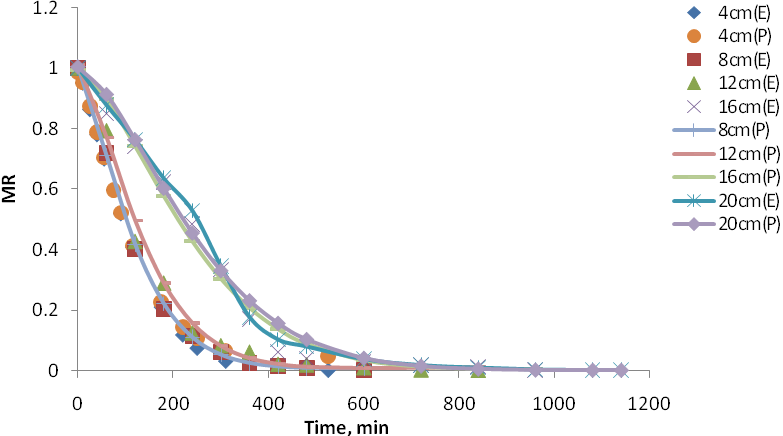
Drying time increased with the increase in the thickness of the cauliflower bed. Fig. 1 shows the variation of moisture content with drying time and it clearly depicts that samples for bed thickness 20 cm took maximum time for drying. Minimum drying time of 525 min was recorded for 4 cm thickness samples and it was 1140 min for 20 m thickness samples. Table 1 presents the ANOVA for the factor and it was found that drying time was significantly affected by the cauliflower bed thickness during convective drying of the samples. Fig. 2 presents the drying rate behaviour with time for different bed thickness samples. It is evident from the Fig. 2 that drying rate decreased with the increase in the bed thickness in hot convective drying. Maximum drying rate was observed for 4 cm bed thickness samples (9.5 % moisture loss/min), whereas it was minimum for the samples in 20 cm bed thickness (3.6 % moisture loss/min) (Fig 3.). The moisture diffusivity of the cauliflower samples for different bed thickness was calculated 17 and found to be within the range of 3.39 X 10⁻⁹ to 1.53 X 10⁻⁹ m2/s. The moisture diffusivity found to decrease with the increase in the thickness of cauliflower bed (Fig.4). Figure 4 shows the relation between moisture diffusivity and cauliflower drying bed thickness. The following empirical relation was developed to predict the moisture diffusivity within the range of 4 to 20 cm thickness of the cauliflower bed and the coefficient of determination was 0.96 for the relation.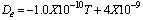 | (6) |
Where, De is moisture diffusivity m2/s, and T is thickness of drying bed, cm.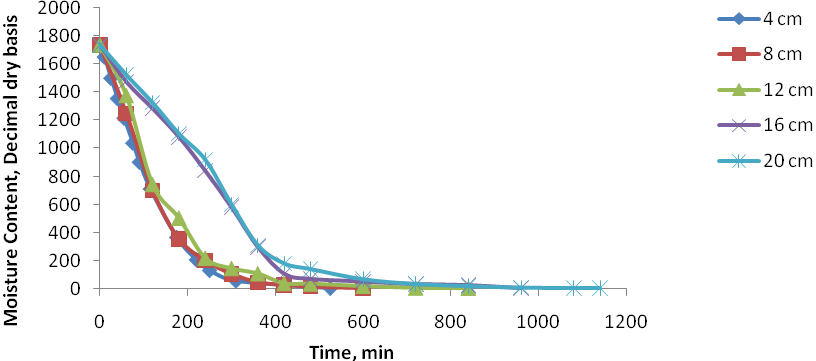 | Figure 1. Variation of moisture content with time for cauliflower drying at different bed thickness |
 | Figure 2. Drying rate variation with time during cauliflower dryin at different bed thickness |
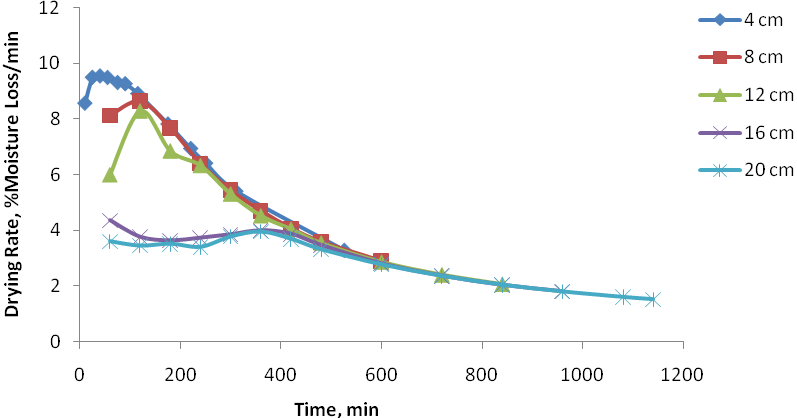
 | Figure 3. Comparison of experimental (E) and predicted (P) values of moisture ratio for differenbt bed thickness |
3.2. Effect of Different Drying Bed Thickness on Quality Characteristics
RSM analysis of the experimental data resulted in linear models for drying time, final moisture content, rehydration ratio, vitamin C retention, browning, and cubic model for overall acceptability scores. ANOVA was conducted to determine significant effects of cauliflower bed thickness (A) on each response and to fit the appropriate polynomial models to experimental data. Regression equation coefficients of the proposed models and statistical significance of all main effects were obtained and effects, not significant at p > 0.05, were stepped down from models without damaging the model hierarchy (Table 1 and 4). ANOVA also showed that the lack of fit was not significant for all response surface models at 95% confidence level. R2, Adj-R2, Pre-R2, PRESS, Adeq. Precision and coefficient of variation (C.V.) were also observed to check the model adequacy.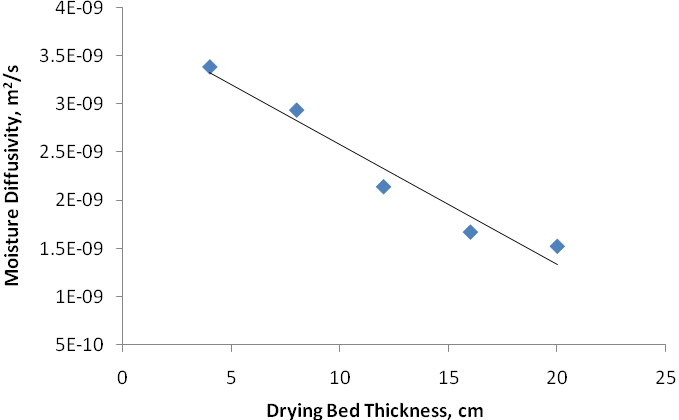 | Figure 4. Moisture diffusivity varaition with drying bed thickness |
3.2.1. Final Moisture Content of the Dried Cauliflower Samples
Fresh cauliflower moisture content was 738.38±0.15, % (d.b) and the samples were dried up to moisture content to 5.25±0.5, % (d.b), however the samples for 16 and 20 cm thickness did not attain the stated moisture content after constant drying under respective drying conditions. Final moisture content of the dried cauliflower samples was significantly affected (Table 1) by the cauliflower bed thickness. Final moisture content of the end product increased with the increasing thickness of the drying bed for the prevailing drying air temperature and velocity. Tables 1 clearly depicts that the lack of the fit for the model was not significant and the model is capable to predict the moisture content with 0.89 predicted R2 value. The moisture contents of the dried product (Table 3) were 7.27 and 8.12 % db for 16 and 20 cm thick bed respectively and these moisture contents were not safe for long-term storage of the dried cauliflower. A study reported that dried cauliflower with 6 % moisture content (db) can be safely stored up to six months 1.
3.3.2. Vitamin C
Table 2 shows the significant effect of bed thickness on the vitamin C retention in the dried cauliflower samples. Vitamin C retention decreased (Table 3) with the increase in the bed thickness because cauliflower samples were exposed to drying air for long time as the bed thickness increased.
3.3.3. Rehydration Ratio
Rehydration ratio is the important property of dried product and ANOVA values (Table 1) clearly indicates that it was significantly influenced by the cauliflower bed thickness. The predicted R2 value for the fitted model was 0.98 in the case. Rehydration ratio of the dried cauliflower samples reduced (Table 3) with the increase in the bed thickness. This effect was observed because of cauliflower structure damage due to prolonged exposure to high temperature during drying.
3.3.4. Browning
Browning of cauliflower samples increased as the bed thickness increased from 4 cm to 20 cm (Table 2 and 3). Statistical analysis shows that browning was significantly affected by the drying bed thickness of cauliflower samples. The model described the variation with one predicted R2 value.
3.3.5. Sensory Quality of Dried Cauliflower Samples
Overall acceptability scores of the dried cauliflower samples were statistically analyzed and it was found that overall acceptability of the end product was significantly affected by the drying bed thickness of cauliflower samples. The fitted model described the relationship between drying bed thickness and overall acceptability with 0.99 predicted R2 value. The average scores of sensory evaluation (appearance, texture, flavor, colour and overall acceptability) for all the dried cauliflower samples are presented in Table 4. The samples dried in 16 and 20 cm bed thickness got lower scores (3.1 and 1.3 respectively) for overall acceptability of the dried samples. The scores for other sensory attributes were also inferior for 16 and 20 cm bed thickness dried samples. On the basis of sensory evaluation the samples dried in 16 and 20 cm bed thickness were rejected, however samples dried in 12 cm thickness were accepted marginally. The best sensory scores were given for the samples, which were dried in 4 cm bed thickness or in thin layer, whereas minor sensory scores difference were observed for the samples dried in 8 cm bed thickness. With the help of quality characteristics and sensory evaluation, it was concluded that cauliflower bed thickness can be increased up to 8 cm safely without significantly affecting on quality with increased throughput and optimum utilization of the drying air potential.
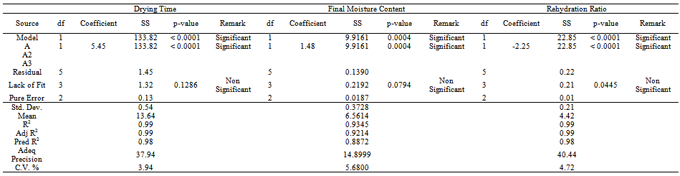
Table 1. Statistical Analysis Results of RSM for Drying Time, Final, Moisture Content, and Rehydration Ratio
 |
| |
|
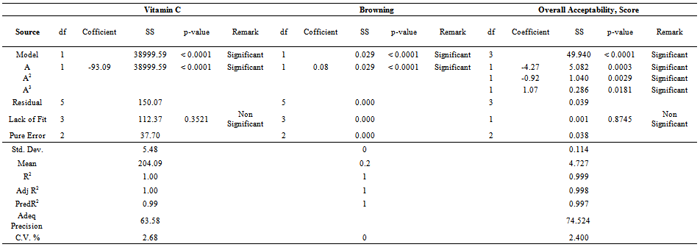
Table 2. Statistical Analysis Results of RSM for Vitamin C, Browning and Overall Acceptability
 |
| |
|
| Table 3. Quality characteristics of dried cauliflower for different bed thickness |
| | Bed Thickness, cm | Final Moisture Content, % db | Vitamin C,g/100g | RehydrationRatio | Browning | Overall Acceptability(Score) | | 4 | 5.25 | 298.45 | 6.82 | 0.12 | 7.7 | | 8 | 5.67 | 260.00 | 5.17 | 0.16 | 7.1 | | 12 | 5.89 | 203.10 | 4.51 | 0.20 | 5.3 | | 16 | 7.27 | 155.05 | 3.49 | 0.24 | 3.1 | | 20 | 8.12 | 110.00 | 2.13 | 0.28 | 1.3 |
|
|
| Table 4. Average sensory evaluation scores |
| | Bed Thickness(cm) | Appearance | Texture | Flavour | Colour | Overall Acceptability | Remark | |
| 4 | 8.2 | 7.9 | 8.2 | 7.9 | 7.6 | V. Good | | 8 | 7.1 | 7.2 | 8.0 | 7.2 | 7.1 | Good | | 12 | 7.0 | 6.0 | 4.1 | 3.7 | 5.3 | Fair | | 16 | 4.3 | 2.5 | 4.8 | 2.3 | 3.1 | Rejected | | 20 | 2.6 | 2.5 | 3.1 | 1.9 | 1.2 | Rejected |
|
|
4. Conclusions
Drying rate of cauliflower for different bed thickness decreased with the increase in bed thickness. Samples dried for 4 cm bed thickness took minimum time, however samples dried for 20 cm bed thickness took maximum time. Moisture diffusivity decreased with the increase in the drying bed thickness and ranged from 3.39 X 10⁻⁹ to 1.53 X 10⁻⁹ m2/s. Drying time, Final Moisture content, Vitamin C retention, rehydration ratio, browning, and overall acceptability of the dried cauliflower were significantly affected by the drying bed thickness of cauliflower. On the basis of sensory evaluation it was concluded that drying bed thickness can be increased up to 8 cm for cauliflower drying for optimum utilization of the drying conditions.
References
| [1] | Mudgal V D & Pandey V K, Dehydration Characteristics of cauliflower. Int J Food Eng, 3(6) (2007) Article 6. DOI: 10.2202/1556-3758.1278. |
| [2] | Kadam D M, Samule, D V K, Chandra, P & Sikarwar H S, Impact of processing treatments and packaging material on some properties of stored dehydrated cauliflower, Int J Food Sci & Technol, 43 (2008) 1–14. |
| [3] | Lewicki, P, Effect of pre-drying treatment, drying and rehydration on plant tissue properties: A review, Int J Food Prop, 1(1) (1998) 1–22. |
| [4] | Pardeshi I L, Arora, S & Borker, P A, Thin-layer drying of green peas and selection of a suitable thin-layer drying model, Drying Technol, 27 (2009): 288-295. |
| [5] | Rahman M S, Guizani, N & Al-Zakwani, I, Pore formation in apple during air-drying as a function of temperature: porosity and pore-size distribution. J Sci Food & Agricul, 85 (2005) 979–989. |
| [6] | Carbonell, J V, Pin˜aga, F, Yusa´, V & Pen˜ a, J L, The dehydration of paprika with ambient and heated air and the kinetics of colour degradation during storage, J of Food Engg, 5(3) (1986) 179–193. |
| [7] | Simal, S, Garau, C, Femenia, A & Rossello, C, Drying of red pepper (Capsicum annuum): Water desorption and quality. Int J Food Engg, 1(4) (2005) 10–22. |
| [8] | Gupta, M K, Sehgal, V K & Arora, S, Optimization of drying process parameters for cauliflower drying, J Food Sci & Technol (2011) DOI: 10.1007/s13197-011-0231-5. |
| [9] | Gupta M K, Sehgal, V K & Singh A K, Effect of process parameters and storage length on quality of dried cauliflower during storage, Ind J Traditional Know (Accepted manuscript number: TK-2037 (F)). |
| [10] | Kaur, B & Singh, S, Effect of dehydration storage of cauliflower on the physical characteristics, Indian Food Packer 35(1) (1981) 23-26 |
| [11] | Srivastava R P& Kumar S, Fruits and Vegetable preservation Methods and practices, (International Book Distribution Co., Lucknow), 1993. |
| [12] | AOAC, Official Methods of Analysis, (Association of Official Analytical Chemists, Washington DC), 2000. |
| [13] | Ranganna S, Handbook of analysis and quality control for fruits and vegetable products, 2nd edn, (Tata McGraw Hill publishing company limited, New Delhi), 1986, 497– 528. |
| [14] | Amerine M A, Pangborn, R M, & Roessler, E B, Principles of sensory evaluation of foods, (Academic Press, London), 1965. |
| [15] | Eren I & Kaymak-Ertekin F, Optimization of osmotic dehydration of potato using response surface methodology, J Food Engineering, 79 (2007) 344–352. |
| [16] | Stat-Ease, Stat-Ease Design Expert Package, Version 7.1.0. (Minneapolis, USA), 2009 |
 Abstract
 Reference
 Full-Text PDF
 Full-Text HTML