-
Paper Information
- Paper Submission
-
Journal Information
- About This Journal
- Editorial Board
- Current Issue
- Archive
- Author Guidelines
- Contact Us
International Journal of Aerospace Sciences
p-ISSN: 2169-8872 e-ISSN: 2169-8899
2019; 7(1): 1-12
doi:10.5923/j.aerospace.20190701.01

Automated Preliminary Thermal and Stress Analyses Applied to a Turbine Housing Assembly
 Abstract
 Reference
 Full-Text PDF
 Full-text HTML
M. Moret1, H. Moustapha1, Patricia Phutthavong2, F. Garnier1
1Ecole de Technologie Supérieure, Montreal, Quebec, Canada
2Pratt & Whitney Canada, Montreal, Quebec, Canada
Correspondence to: F. Garnier, Ecole de Technologie Supérieure, Montreal, Quebec, Canada.
| Email: |  |
Copyright © 2019 The Author(s). Published by Scientific & Academic Publishing.
This work is licensed under the Creative Commons Attribution International License (CC BY).
http://creativecommons.org/licenses/by/4.0/

The use of Multidisciplinary Design Optimization (MDO) techniques at the preliminary design phase (PMDO) of a gas turbine engine allows investing more effort at the pre-detailed phase in order to prevent the selection of an unsatisfactory concept early in the design process. Considering the impact of the turbine tip clearance on an engine’s efficiency, an accurate tool to predict the tip gap is a mandatory step towards the implementation of a full PMDO system for the turbine design. Tip clearance calculation is a good candidate for PMDO technique implementation considering that it implies various analyses conducted on both the rotor and stator. As a second step to the development of such tip clearance calculator satisfying PMDO principles, the present work explores the automation feasibility of the whole analysis phase of a turbine shroud segment and housing assembly preliminary design process, and the potential increase in the accuracy of results and time savings. The proposed conceptual system integrates a thermal boundary condition automated calculator and interacts with a simplified air system generator and with several design tools based on parameterized CAD models. Great improvements were found when comparing this analysis method results with regular pre-detailed level tools, as they revealed to be closer to the one generated by the detailed design tools used as target. Moreover, this design process revealed to be faster than a common preliminary design phase while leading to a reduction of time spent at the detailed design phase. By requiring fewer user inputs, this system decreases the risk of human error while entirely leaving the important decisions to the designer.
Keywords: Preliminary and Multidisciplinary Design Optimization, Shroud Segment, Tip clearance, Automated analyses
Cite this paper: M. Moret, H. Moustapha, Patricia Phutthavong, F. Garnier, Automated Preliminary Thermal and Stress Analyses Applied to a Turbine Housing Assembly, International Journal of Aerospace Sciences, Vol. 7 No. 1, 2019, pp. 1-12. doi: 10.5923/j.aerospace.20190701.01.
Article Outline
1. Introduction
- The design of a gas turbine engine is a multidisciplinary and iterative problem in which the best compromise has to be found between the conflicting disciplines involved: thermal, structural, aerodynamics, manufacturing, cost, weight, etc. The design of aero-engines traditionally follows two main stages: preliminary design and detailed design. At the pre-detailed stage, only a few groups are involved to design and analyse the turbine concept’s components and sub-systems. However, the Science and Technology Organisation of the North Atlantic Treaty Organization (NATO) [1] showed that decisions taken early in the design process are often based on low fidelity models when only little information (data, requirements, etc.) is available. This may compromise the analysts’ ability to select the optimal design. At the detailed design phase, more groups are involved having their own set of specialized tools and methodologies, and the process is thus even more segmented within the groups to form sub-disciplines’ specialists. Panchenko et al. [2] explain that even though knowledge increases during the design process, the freedom to modify any part of the design decreases as shown in Fig. 1, and/or induces major delays in the planning and a rise of design costs. It is consequently difficult to correct a bad concept at a detailed design phase. To correct this, Panchenko et al. [2] suggest the use of MDO at the preliminary design phase, since it is at that stage that the biggest influence on the final product configuration can be made. As explained by Martins and Lambe [3], the concept of MDO has been widely studied during the past 50 years. However, there is a lack of information in the literature about using this methodology during the early stages of design. Pachenko et al. [2] explain that an increase of the effort and knowledge during the pre-detailed design phase implies involving directly the specialist groups instead of waiting until the detailed design phase. However, it results in significant delays of the concept evolution since many interactions between several groups are then required. This is where PMDO systems come into play in order to automate and ease this iterative process. Referring to Pachenko et al. [2], NATO Science and Technology Organisation [1] and Korte et al. [4], the following steps are required to implement a PMDO system:1. Develop a robust tool base: design tools based on parametrized CAD models, and advanced physics analysis tools which includes the development or improvement of correlations;2. Apply single discipline optimization to individual analytical tools;3. Create an integration framework, i.e. a software architecture enabling integration, communication and execution of several tools;4. Implement multidisciplinary optimization with a clear statement of the design objectives, constraints and variables, and an appropriate selection of the algorithms.
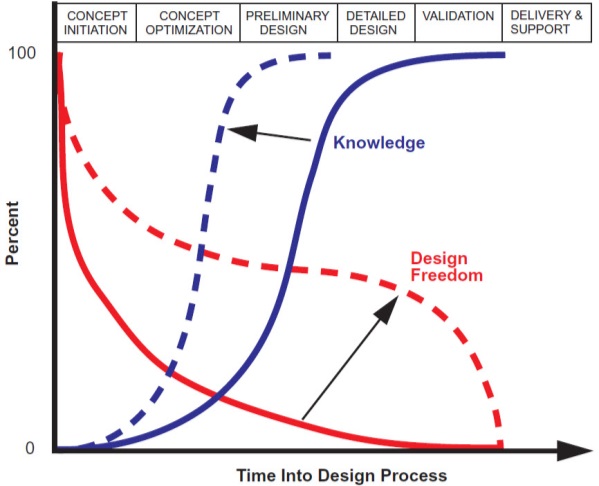 | Figure 1. Knowledge vs. design freedom during the design process. Knowledge increases during design process (solid line to dash line) while design freedom decreases (solid line to dash line) [1] |
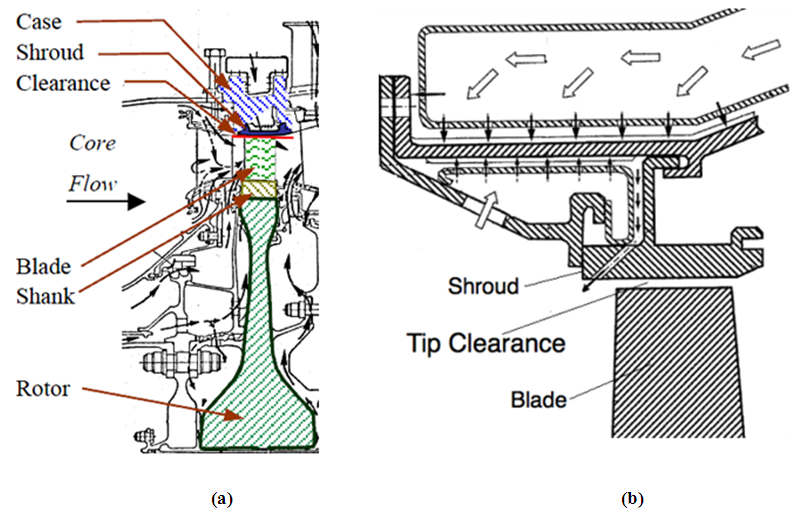 | Figure 2. (a) Geometry of the E3 high-pressure turbine [7]; (b) Highlighting of the tip clearance [8] |
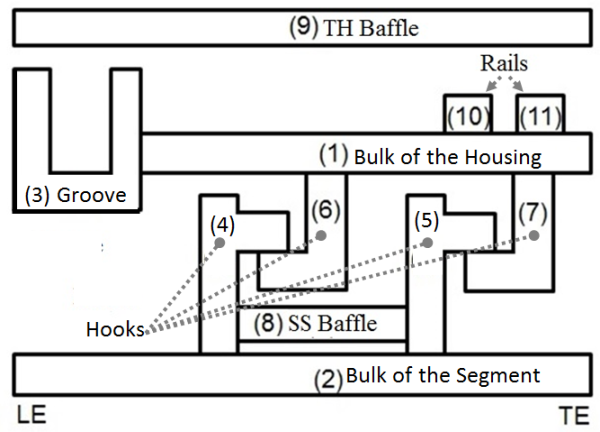 | Figure 3. Stator Assembly Components Names [10] |
2. Methodology
- Based on Wieringa’s definition [11], this work is a practical problem as opposed to a knowledge problem. Therefore, the goal of this work is to identify the requirements of the industry regarding the research problem, to propose a new process in response to those requirements, and to implement that proposal. The initial requirements were to improve the pre-detailed design process by proposing a more flexible, robust and adaptable design and analysis system. This means that the new system has to allow more stator configurations to be modeled while requiring limited number of input from the user. Moreover, the new process results should be targeting within 20% accuracy when compared to detail design results. This 20% difference comes from the fact that, based on experts’ opinion, it is usually accepted for a regular pre-detailed phase to be about 30% off when compared to the detail design phase results. This target of 20% therefore represents an improvement of 10% compare to the current pre-detailed design process. Finally, the whole design and analysis process should not be slower than the current process.As it has been developed by the authors previously reported in [9], and is resumed here for the reader’s benefit, tip clearance calculation over an entire flight mission implies the determination of the transient radial growth, due to temperature and rotational speed (for the rotor), of the turbine’s rotor and static components. Fig. 4, first introduced in [9], shows the architecture of the tip clearance calculation process being developed in this work, where each arrow represents data exchange. As one can see, the creation of a rotor analyses system is the first step toward the implementation of a tip clearance calculator [9]. The present paper investigates the development of the automated analyses process for the housing and shroud segment assembly. The process required in order to evaluate the stator’s components displacement includes several sub-systems: pre-processors, an analysis system and a post-processor for visual purposes. The first and highest-level pre-processor sub-system in this program architecture provides the initial concept’s data, i.e. the performance data. The second one, called mission builder, generates the flight mission with the proper transient responses to a change in throttle position for all the air chambers around and inside the stator, and in the gas path. The third one is the design tool generating geometric data of the stator based on parameterized CAD models. The sub-systems introduced so far are not the work of the authors. They are indeed developed in the collaborative program initiated between Pratt & Whitney Canada and the Ecole de Technologie Supérieure. Examples of such works are described in Savaria et al. [10] for the implementation of the stator designer sub-system or in Ouellet [12] and Twahir [13] for the rotor design sub-systems. The scope of this paper is indeed limited to the following sub-systems as described in Fig. 4.
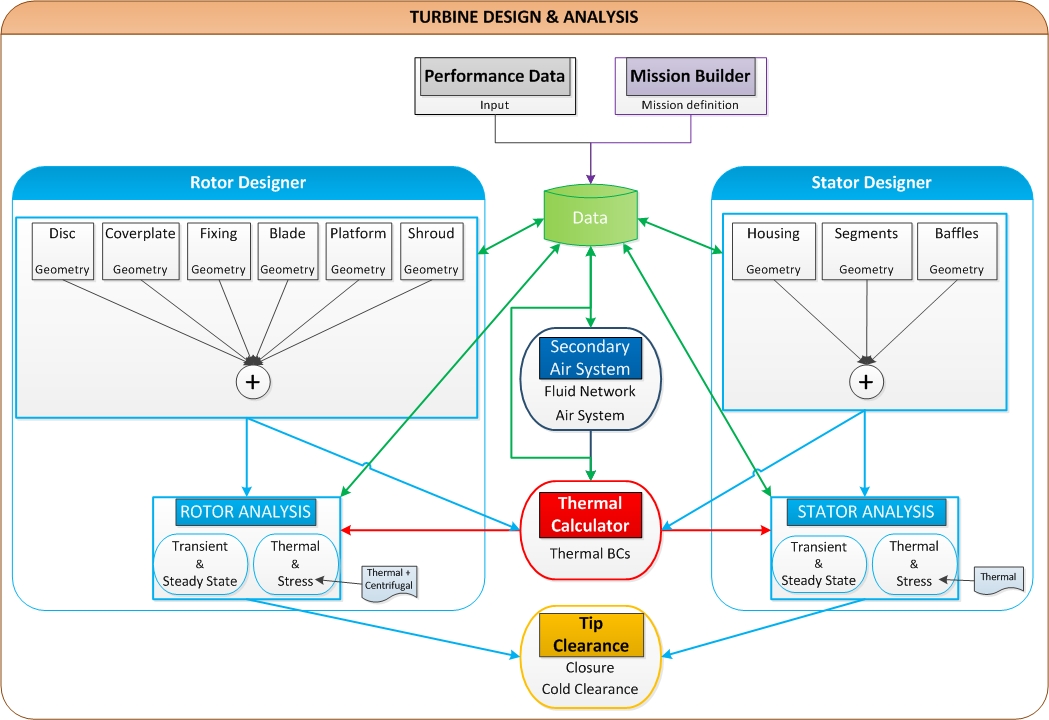 | Figure 4. Tip clearance calculation methodology [9] |
3. Secondary Air System Generation
- Studying the secondary air system of the stator assembly is important in order to control the thermal growth of the housing (Hennecke [6]) and to maximize the turbine durability by avoiding hot gas ingestion that could lead to metal damage as presented by Malak [14]. Cooling the shroud segment assembly also allows lowering the housing temperature and therefore controlling more easily its thermal growth. Such process is described by Hennecke [6] as a passive system to control the tip clearance variation in the sense that it allows to achieve a slower response of the housing similar to that of the rotor. The shroud segment serves as a thermal barrier taking most of the heat from the gas path and therefore protecting the housing which drives the stator’s total growth.In order to cool the stator, different solutions are used. But the most common ones are to flow the housing with compressor discharge air and to add impingement holes. The housing and shroud segment assembly’s geometry can significantly vary from one configuration to another. And the cooling means chosen can also differ for a given geometry. The secondary air system will indeed vary depending on the presence of impingement holes and the number of rows of holes, if a piston ring is sealing a cavity, the orientation of the hooks, the length of a channel, the presence of protuberances, etc. This means that the resulting secondary air systems are very different from one engine to another. A tool automatically generating a fluid network for a given geometry and cooling scheme must therefore be highly flexible. The Secondary Air System Generator automatically assigns the correct number of air chambers at the relevant locations around the stator, and the stator geometry dictates the type of restrictors to be used between these chambers. The Secondary Air System Generator creates a simplified air system network and provides the necessary inputs to an integrated in-house air system analysis software. Fig. 5 presents three examples of stator with their fluid network automatically generated by the proposed system. The first geometry has a piston ring in the housing groove. The presence of this piston ring seals the cavity above the housing and small leakage flows are modeled passing above and below the ring. One impingement hole also exists in the housing to cool down the shroud segment. The second stator has two impingement holes in the housing central groove with angles different from 90°. The third stator has an impingement baffle attached to the shroud segment. This feature allows reducing the impingement height and therefore increase the heat transfer, but as for drawback to limit the amount of flow that can be used to impinge the shroud segment surface. The third stator is also the only shown here that has impingement on the housing base itself. The yellow triangles at the extremities of the fluid networks are the air sources constraining the thermal model. Two are located upstream and downstream of the housing and provide cooling air, and two are located in the gas path upstream and downstream of the shroud segment. The third test case has two extra sources above the housing baffle to model the chambers upstream of the impingement holes.
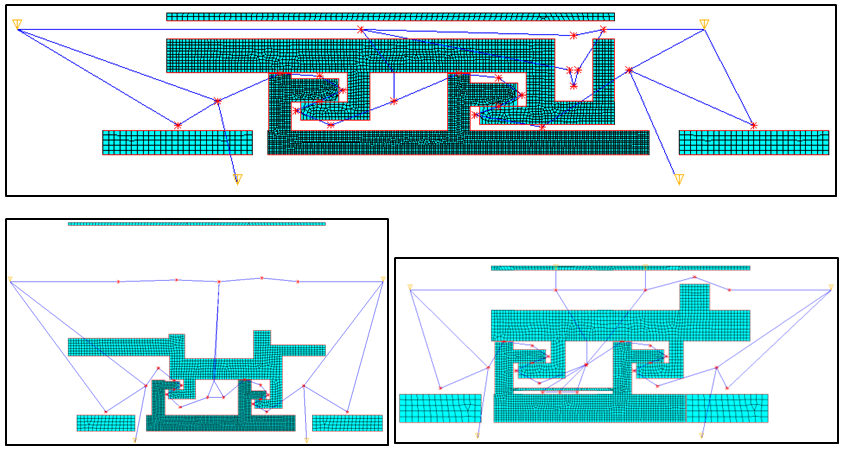 | Figure 5. Examples of Secondary Air System |
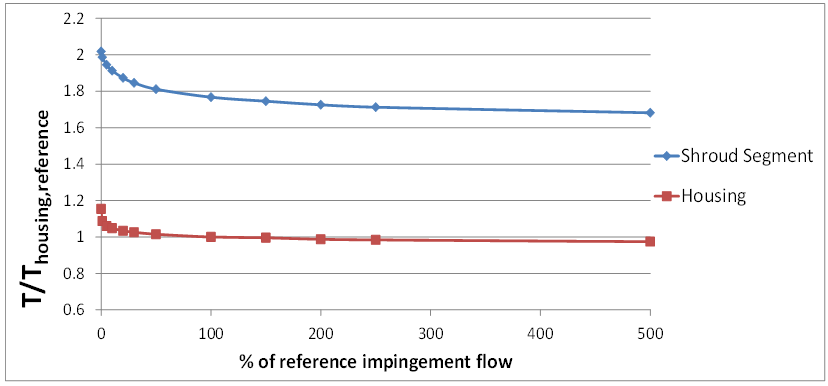 | Figure 6. Impingement flow effect on the Shroud Segment and Housing average temperatures |
4. Thermal Boundary Conditions
- To execute a thermal analysis, boundary conditions are required for each specific location (i.e. zone) around the geometry. The Thermal Calculator uses for each zone a specific set of inputs obtained from all the connected sub-systems (performance data, design CAD sub-systems, the Secondary Air System Generator, etc.) to calculate the thermal boundary conditions. Thanks to a Gateway software, i.e. a link through which two programs can communicate, the Stator Analysis CAE sub-system is able to make use of the CAD parametric models (cf. Savaria et al. [10] for example) to identify and measure each zone of the stator geometry.In detailed design, specific correlations are used to evaluate the boundary conditions on a large number of zones defined all around the 3D geometry of the stator to better represent the effect of every seal, hole, cavity, etc. At a pre-detailed level, the 2D geometry is much simpler and therefore fewer zones are defined. It was decided to define one zone per air chamber. Apart from modeling the entire housing and shroud segment assembly, it was decided to represent the tip portion of the upstream and downstream vanes in order to take into account some heat pickup from the fluid network on the sides of the stator. An example of zone distribution around a stator’s geometry is presented in Fig. 7 along with the type of correlation used for each of these zones. The thermal boundary conditions correspond to a heat transfer coefficient defined at the surface of each zone, which are also connected to a fluid node. The fluid network connecting every fluid node is constrained by temperature source nodes at the extremities of the network as explained previously and shown in Fig. 5. The zones in the gas path are not connected to a fluid node and have for thermal boundary conditions a combination of a heat transfer coefficient and a bulk temperature at their surface. Kreith et al. [15] explain how the bulk temperature can be evaluated based on the fluid’s static temperature, its relative velocity and the Prandtl number. Static temperatures around the stator are easily computed based on the gas path mean line temperature (which is part of the initial concept data). The real challenge here is therefore to select the proper correlations for the heat transfer coefficients all around the stator considering that these are directly influenced by the zone’s geometry and the physics at stake. The Nusselt number is often used to evaluate the heat transfer coefficient of a surface as these two are directly correlated. At a preliminary design stage, the zones around the stator can be modeled using basic textbook correlations such as flat plates, channels, impingement, etc. The types of assumptions developed here are represented in Fig. 7.
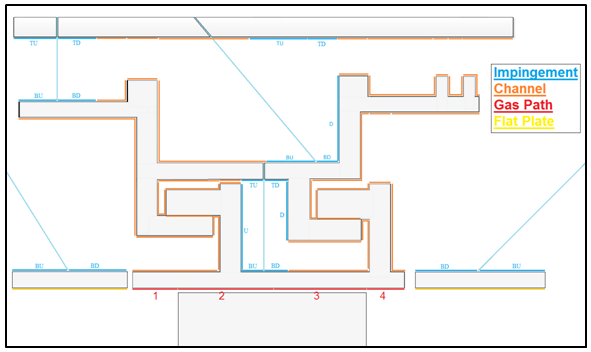 | Figure 7. Stator thermal zones |
4.1. Channels
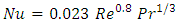
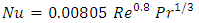
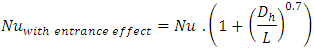
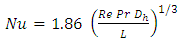
- The heat transfer process of channel flows is well known and has been widely covered in the literature (as for examplie in Incropera and DeWitt [16] or Kreith et al. [15]). Channels are present all around the stator geometry and represent the majority of the cooling means used to control the housing temperature. However, some very narrow channels can exist in a stator’s geometry (i.e. housing and shroud segments hooks, the piston ring, etc.) for which a simple channel correlation would lead to unrealisticly high heat transfer coefficients because of their small hydraulic diameters. Indeed, based on Mehandale et al. [17], some of the channels modeled during the boundary condition calculation are in the range of the meso channels (100μm to 1 mm). For this type of channels, Wang and Peng [18] consistently obtained Nusselt numbers lower than the ones calculated using Dittus-Boelter Eq. (1) [19]. Wang and Peng [18] came up with Eq. (2) which has a reduction factor of 0.35 compared to a regular channel flow correlation (1).For a turbulent flow in regular channels Incropera and DeWitt [16] and Kreith et al. [15] both suggest the use of the Dittus-Boelter Eq. (1) [19]. If the conduit is short and the fluid turbulent, the flow cannot be considered as fully developed and an entrance effect must be accounted for by including a term in the correlation as shown in Eq. (3). In the case of laminar flows the empirical Eq. (4) [20] is suggested.
 | (1) |
 | (2) |
 | (3) |
 | (4) |
4.2. Impingement Jets
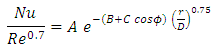
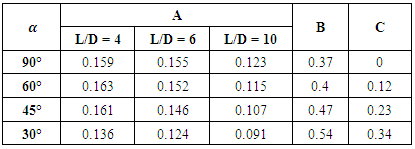
- Cooling impingement jets are commonly used to provide high local heat transfer in modern gas turbine engine and effectively cool down a specific region of the geometry. Goldstein and Franchett [21] experimentally determined the heat transfer to a jet impinging at different spacing and angles to a plane surface. The authors obtained the empirical correlation Eq. (5) for the local Nusselt number on the plane surface.
 | (5) |
 are the cylindrical coordinates of contours of constant Nu and the coefficients A, B and C are given in the Table 1 depending on the impingement angle
  and the distance L from jet orifice to surface. Compared to other research work done on the heat transfer process of impingement jets, using Goldstein and Franchett [21] correlation (5) allows taking into account the effect of the impingement jet’s angle which is necessary in housing and shroud segment assemblies where the hardware design often require the use of non-vertical impingement jet.
|
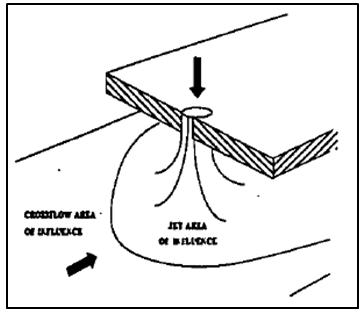 | Figure 8. Areas of Influence for the Impinging Jet Array: Jet and crossflow areas of influence [22] |
|
 | (6) |
4.3. Flat Plates
- For the sake of simplicity, the gas path side of the vanes can be modeled as flat plates. For such model, Incropera and DeWitt [16] give the following Eq. (7) and (8).
 | (7) |
 | (8) |
4.4. Shroud Segment Gas Path Side
- Many references such as Azad et al. [23] and Prasad and Wagner [24] developed the behavior of the secondary flow within the blade tip and the shroud segment gap. As Prasad and Wagner [24] proved in their study, the unsteadiness of the flow seems to be mostly confined to the gap between the blade tip and the shroud segment. Based on this observation, one can conclude that for a simplification purpose of the problem at stake, the shroud segment gas path side can be separated in two regions: - The first one is composed of the surfaces preceding and following the blade. These zones are the numbers 1 and 4 in Fig. 7. They are exposed to the main flow and can be modeled as a flat plate (using Eq. (7) and (8)) considering that the blade tip does to affect them.- The second region is the portion of shroud segment located above the blade tip and numbered 2 and 3 in Fig. 7. The zones of this second region cannot be modeled as easily as for the first region. The reason is that when the blade is underneath the shroud, the shroud – blade’s tip system can be considered as two concentric cylinders, with the shroud a stationary one. While when no blade is under the shroud, this one can be seen as a flat plate as in the first region. To consider these two cases, one can calculate a ratio of the time the shroud segment is facing the tip to the time it is not.Rademaker et al. [25] studied the heat loading of a shroud segment and more specially the effect of the blade tip’s windage and the radial outflow of cooling flow at the blade squealer tip. Their study of the windage effect is interesting for the present work because it highlights the periodic variation of the shroud temperatures with the passing of the blades. The authors introduce an equation allowing them to calculate the reduction factor in thermal loading to the shroud surface. If one considers this concept and applies it to the present problem of calculating the heat transfer coefficient at the surface of the shroud segment, one can come up with Eq. (9).
 | (9) |
 is the time fraction for which the shroud segment is covered by the blades. Using basic geometry as shown in Fig. 9, this time fraction can be calculated using Eq. (10).
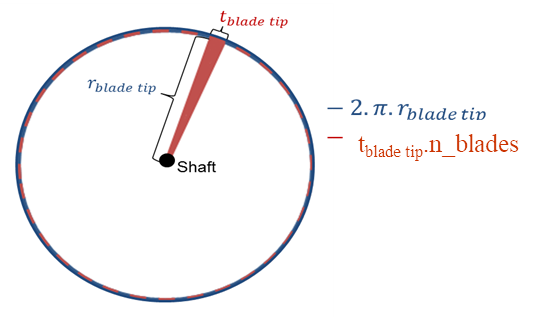 | Figure 9. Time Fraction Theory |
 | (10) |
 is the blade’s thickness and
  is the number of blades. The heat transfer coefficient for concentric cylinders can be calculated using the Dittus-Boelter Eq. (1) [19] but with the Reynold’s number calculated based on the fluid’s relative velocity given by Eq. (11).
 | (11) |
 the fluid’s relative tangential velocity between the two concentric cylinders and
  the fluid’s axial velocity.
5. Automated Analyses
- Automation of the analyses is possible thanks to the process described previously and depicted in Fig. 4. As mentioned previously, the integration of all the sub-systems shown in Fig. 4 is handled by the use of a common and centralized data structure. A framework was created and repeated through all parts of the system by means of object oriented programming (OOP). Automation of the analyses therefore only requires an effective way for the sub-systems to communicate with the CAD and CAE external software. Using a Gateway system, geometric data can be extracted from the CAD parametrized models and used in the sub-systems for calculation and display purposes. This Gateway software also allows direct communication between the CAD models and the CAE software used to run the 2D analyses. The thickness of the non-axisymmetric components (i.e. the shroud segment, and its baffle if any) are calculated based on the number of segments on the circumference, and applied on the meshed geometry in the CAE system.A program was developed in the CAE software in order to automate the analyses process. Depending on the configuration of the studied stator, this system loads the different components’ 2D geometry from the CAD models. The loaded geometries are meshed using the appropriate elements: thermal, fluid, convection and surface effect elements for the thermal analysis, and structural and contact elements for the stress analysis. The thermal and structural elements are defined as axisymmetric or with thickness depending on the component of the stator they are created for. The calculated thermal boundary conditions, varying in time in accordance with the mission, are applied on the zones identified in the CAE program. Temperatures are set at the boundary nodes of the fluid systems and air flows are applied on the fluid elements around the geometry. For the stress analysis, boundary and load conditions are much simpler to evaluate and apply considering that they consist of axially fixing the housing to prevent any axial translation, and applying the thermal results.
6. Results and Discussion
- A 2D transient thermal analysis process is more complex than the following stress analysis. For that reason, the presented results focus on thermals. It is indeed in the thermal analysis part of this work that improvements are made considering that executing a stress analysis is fairly straightforward once thermal analysis results are obtained. Thermal and stress analyses were carried out using the process described in this paper for one turbine stage of three different engines. Those engines are of different configurations: a turboprop as test 1, a turboshaft as test 2 and a high-bypass ratio turbofan as test 3. For all three test cases, this study focused on the first stage of the high pressure turbine. The results obtained were compared to the final detailed design results used to create these engines. Fig. 10a and Fig. 10b show an example of results obtained for a thermal analysis done on the test case number 1. In Fig. 10b, one can observe the evolution of the temperature probed at five key locations around the stator represented on the temperature contours in Fig. 10a. As absolute values cannot be disclosed in this paper for intellectual property reasons, non-dimensionalized scales were used in Fig. 10a and Fig. 10b. In these two figures, the temperature unit was removed by means of the shroud segment maximum metal temperature and the time scale in Fig. 10b was non-dimensionalized using the Take-off condition’s duration.
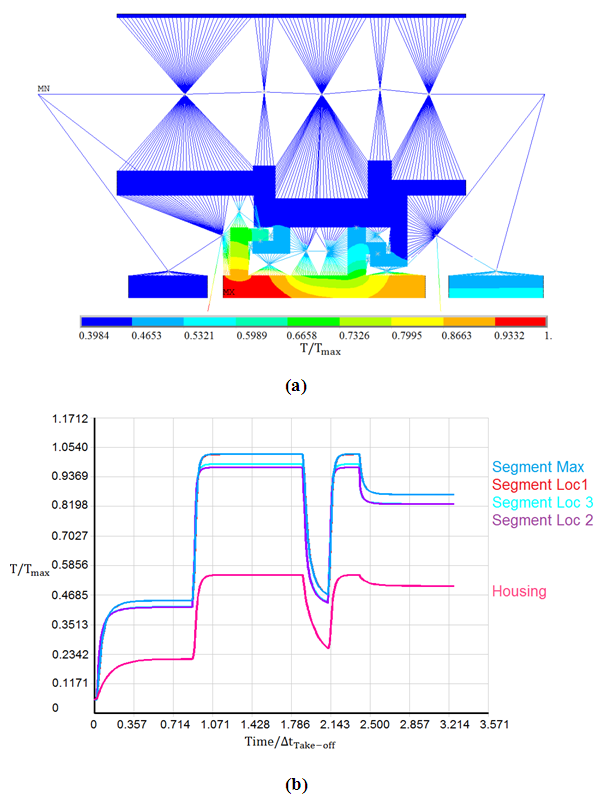 | Figure 10. Thermal analysis results example performed on test case 1: (a) contour plot, (b) transient plot of temperatures at key locations |
 | Figure 11. Presented work vs. Detail Design results |
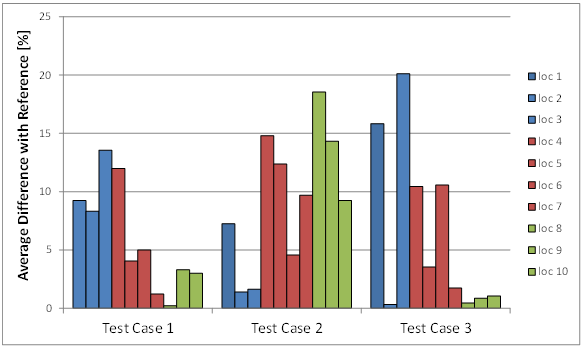
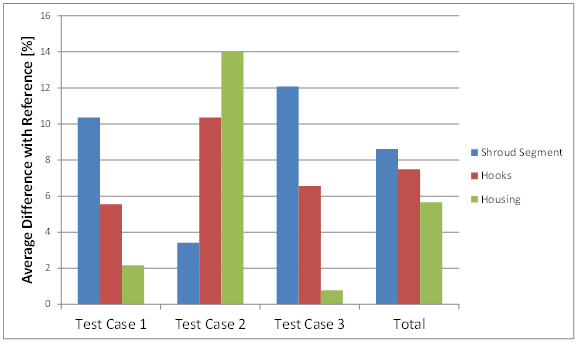 | Figure 12. Comparison results averaged per component |
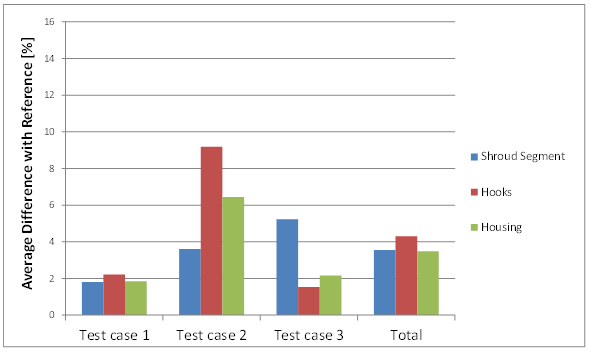 | Figure 13. Presented work vs. Detail Design improved results |
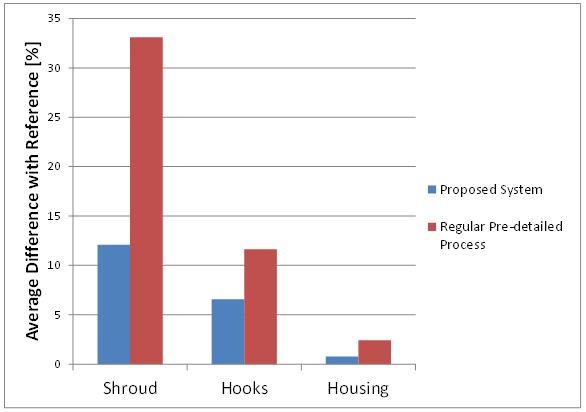 | Figure 14. Comparison of the results of the current and proposed processes with detail design results for the test case 3 |
7. Conclusions
- It is expected from the implementation of a PMDO system to improve the quality of pre-detailed level results considering that more knowledge is being injected early in the design process. It is also anticipated that such system would lead to an increase of productivity through the reduction of the overall design time. Through this work it was proved that, when using a PMDO system, the time required to deliver a housing and shroud segment assembly’s thermal and displacement results in the pre-detailed design phase is reduced by 80% due to improvements in the process efficiency. It was also estimated that the higher quality and quantity of the pre-detailed data would lead to a time reduction of about 30% during the detailed design phase.The new system showed a substantial improvement in the quality of the pre-detailed design results, from an estimate of about 30% to less than 8%, when compared to detailed design results. The accuracy of the results was even more improved during a second iteration on the pre-detailed model by adding some extra features to the model, which led to an average difference of less than 4%. These results prove that the decision of reducing the number of boundary condition zones, compared to detailed design best practices, to a minimum of one zone matching each air system chamber is valid. Finally, the selection of simplified models for the calculation of the heat transfer coefficients proved to be valuable when looking at the thermal analysis output.The results showed in this paper answered the knowledge sub-problem of identifying the predominant phenomena in the thermal analysis of a housing and shroud segment assembly. As expected, the main ones were the impingement jet cooling, the heat transfer from the gas-path, and all the channel flows around the stator. But the system introduced here allowed highlighting the importance of modelling the cooling channels inside the shroud segment base and the conduction in the housing if it has been cut, which was not initially anticipated.This work also confirms that an automation of the preliminary design process is possible. The results presented in this paper suggest that one analyst could be in charge of designing and analyzing an entire stator during the pre-detailed phase, without the need for many specialized groups to be involved.Moreover, by requiring fewer user inputs and removing the non-value added task for an analyst to manage data, this system decreases the risk of human errors while entirely leaving the important decisions to the user.Finally, the process described in this work closes the gap between the pre-detailed and detailed design phases meaning that results can be generated where assumptions had to be made before. The next and final stage of this work in order to implement a tip clearance calculator following PMDO principles is to compare the rotor and stator transient displacements in order to identify the most severe pinch point that will define the cold build clearance to be set, and finally to create an optimisation system able to generate an optimal turbine geometry depending on the selected design objectives.
ACKNOWLEDGEMENTS
- This work could not have been done without the support of Pratt & Whitney Canada, and the expertise of the employees who helped at the concretization of this project. The authors are grateful for the National Sciences and Engineering Research Council of Canada (NSERC) for partially financing their work.
Nomenclature
- CAD = Computer-aided DesignCAE = Computer-aided EngineeringD = Impingement jet diameterDh = Hole hydraulic diameterh = Heat transfer coefficientL = Length of the conduct
 = Mass flow rateNu = Nusselt numberPMDO = Preliminary and Multidisciplinary Design OptimizationPr = Prandtl numberr = Radius in cylindrical coordinate systemrblade tip = Blade tip radiusRe = Reynolds numbertblade tip = Blade tip thickness
  = Fluid’s relative tangential velocity
  = Fluid’s axial velocity
  = Fluid’s relative velocityx = Length of influence of an impingement jet#blades = Number of bladesα = Impingement angle ρ = Density of the fluidσ = Time fractionϕ = Azimuth in cylindrical coordinate systemω = Angular velocity of the co-rotating disks