-
Paper Information
- Paper Submission
-
Journal Information
- About This Journal
- Editorial Board
- Current Issue
- Archive
- Author Guidelines
- Contact Us
International Journal of Aerospace Sciences
p-ISSN: 2169-8872 e-ISSN: 2169-8899
2016; 4(1): 1-8
doi:10.5923/j.aerospace.20160401.01

Comparison of the Aerodynamic Characteristics of the NACA0012 Airfoil at Low-to-Moderate Reynolds Numbers for any Aspect Ratio
 Abstract
 Reference
 Full-Text PDF
 Full-text HTML
S. Martínez-Aranda1, A. L. García-González2, L. Parras2, J. F. Velázquez-Navarro2, C. del Pino2
1Faculdade de Engenharia, Universidade do Porto, Porto, Portugal
2Universidad de Málaga, E.T.S. Ingeniería Industrial, Málaga, Spain
Correspondence to: A. L. García-González, Universidad de Málaga, E.T.S. Ingeniería Industrial, Málaga, Spain.
| Email: |  |
Copyright © 2016 Scientific & Academic Publishing. All Rights Reserved.
This work is licensed under the Creative Commons Attribution International License (CC BY).
http://creativecommons.org/licenses/by/4.0/

This experimental work deals with the influence of the angle of attack (AoA) and the chord based Reynolds number (Rec) on the lift and drag coefficients for a low-aspect-ratio NACA0012 airfoil. In addition, we provide novel general correlations for the minimum drag coefficient together with the ratio between the maximum lift and the minimum drag coefficient for different Reynolds numbers and several aspect ratios, after comparing our experimental data with other research works. This information is very useful for future validation of numerical simulations. Furthermore, we observe that the change in the aerodynamic characteristics are linked to the variations in the linear slope of the lift coefficient as function of AoA for any aspect ratio, thus finding a critical Reynolds number Rec=105 at which the slope saturates its value and the maximum of the polar curve changes its upward trend.
Keywords: Low Reynolds Number, Wing Aerodynamics, Aspect ratio, Wingtip Vortex
Cite this paper: S. Martínez-Aranda, A. L. García-González, L. Parras, J. F. Velázquez-Navarro, C. del Pino, Comparison of the Aerodynamic Characteristics of the NACA0012 Airfoil at Low-to-Moderate Reynolds Numbers for any Aspect Ratio, International Journal of Aerospace Sciences, Vol. 4 No. 1, 2016, pp. 1-8. doi: 10.5923/j.aerospace.20160401.01.
Article Outline
1. Introduction
- Recent research in unmanned aerial vehicles (UAVs) deals with experimental measurements in which the wings present different aerodynamic characteristics as the chord Reynolds number or the aspect ratio are varied. It is also of great interest the aerodynamic performance regarding the maximum lift, lift curve slope, and polar curves [1]. Typically, UAVs operate in the range between 50,000 and 150,000 chord Reynolds number. There is also a great interest to study 3D shape-change and optimization frameworks where the aspect ratio plays a significant role [2-3]. This is the motivation of our experimental study: to analyse the aerodynamic characteristics at low-to-moderate Reynolds numbers in order to compare our results with other works with different aspect ratios.A wing profile is a surface that might be designed to provide lift force and the minimum drag. The relationship between both forces is determined by the wing cross section aerodynamic features [4]. In finite wings at low Reynolds numbers, drag and lift coefficient variations are mainly due to three mechanisms: Wingtip vortex [5-9]; laminar boundary layer separation leading to the formation of a laminar separation bubble (LSB) and the subsequent turbulent separated shear layer [10-12] and finally the vortex shedding in the wake behind the wing [13-15]. Most of these numerical or experimental investigations were performed analysing specifically the flow behaviour. Hence, CD and CL coefficients involve a whole fluid-structure scenario, giving us an overview of the interaction between the wing and the flow that passes over it.The NACA0012 airfoil has been extensively studied and its aerodynamic features are well known as well as the comparison between numerical and experiments by using Large Eddy Simulation [16]. Abbot and von Doenhoff [4] presented a large experimental data summary for different 2D airfoils. The maximum CL observed by these authors was 1.1 - 1.6 for chord based Reynolds numbers ranging from 3·106 to 9·106, and with stall angles between 12º and 16º. For lower angles than stall, the lift coefficient increases linearly with a constant slope ΔCL/Δα. The minimum CD depends on the roughness of the wing surface. Two decades later, Sheldahl and Klimas [17] tested a 2D NACA0012 model for chord based Reynolds numbers between 3.6·105 ≤ Rec ≤ 7·105 and AoA in the range 0º < α< 180º. Their results showed a reduction of the maximum lift coefficient (CLmax = 0.9 - 1.0) and the stall angle (αstall = 10º - 12º) in comparison to the study of Abbot and von Doenhoff [4], though the slope of the lift curves as function of α for small AoA were in agreement. It was also observed by Sheldahl and Klimas [17] that the slope decreases for the AoA greater than 5º - 6º. Nevertheless, if the aspect ratio (AR) between the chord and the span of the wing decreases up to a certain limit value, three-dimensional effects on the wingtip dynamics play a key role. This modifies the expected aerodynamics performance of the wing and there is a meandering movement of the vortex core that is complex to identify [18, 19], though low frequencies have been measured in this random movement for the same NACA0012 airfoil studied here by means of flow visualizations and Proper Orthogonal Decomposition [20]. Besides, the vortex core location has been adjusted while doing PIV measurements due to the presence of the vortex wandering [21]. Actually, wingtip vortex on finite wings generates a lift coefficient reduction respect to the 2D infinite airfoil (called “downwash”), as well as the increment of the drag coefficient. This behaviour is even more significant if the aspect ratio reduces its value. Laitone [22] performed tests with a rectangular finite wing with a NACA0012 cross section profile, with AR=6, chord based Reynolds numbers below 7·104, and a free stream turbulence intensity 0.02% - 0.1%. These results showed a discontinuity at small AoA in the slope on the linear region of the lift curves for Rec = 2.07·104 and Rec = 4.21·104. This discontinuity decreases as the free stream velocity increases together with the smooth increment of the slope ΔCL\Δα. Likewise, the maximum lift coefficient for a constant Reynolds number decreases as the free stream turbulence intensity increases. Laitone also reported a slight reduction of the minimum drag coefficient C_Dmin (null AoA) as Rec increases. The CDmin evolution with Reynolds number has a curve fitting C_Dmin=0.35·Rec-0.25. Moreover, Nngo and Barlow [23] conducted measurements in a low turbulence wind tunnel of a rectangular NACA0012 (AR≈4) in order to study the mechanism that reduces the drag force induced by the wingtip vortex for Rec = 4.8·105. They obtained a value of CDmin = 0.048 for α = 0º, while CLmax is close 0.6 for the critical (stall) angle αstall = 11º. These values are reviewed to highlight how the aerodynamic characteristics of the NACA0012 airfoil strongly depends on the geometry (e.g. aspect ratio) and the presence of edge effects.Finally, Mueller [5] measured experimentally drag and lift coefficients for different wing models in a wind tunnel. These models had semi-span aspect ratios (sAR) between 0.5 and 3 and they were machined using thin flat plates with rounded edges. The Reynolds numbers tested were in the range between 6·104 and 2·105, and AoA between -15º and +25º. Mueller found a direct relationship between the wing aspect ratio and the drag and lift polar profiles. Specifically, for a rectangular flat plate model and decreasing the sAR from 3 to 0.5, the lift coefficient is reduced by 50% in comparison to the rounded edge model. However, as the semi-aspect ratio is decreased, the linear region of CL is extended to greater values of α, as well as an increment of the stall angle. In other work [6], the same author reported a value of CLmax = 0.8 with a stall angle of 18º for the (flat plate) rectangular wing model with aspect ratio AR = 2, together with other experimental observation: an increase of the drag force due to the occurrence of edge effects, not moving from squared to rounded edges but due to wingtip vortex formation.The outline of this manuscript is as follows. Details of the experimental setup are given in Section 2 including a brief description on aerodynamic coefficient computations. Results and discussions are shown in order to achieve a better understanding of the general curve fittings for several aspect ratios in Section 3, including an estimation of sources of experimental errors in different flow regimes. Finally, we draw the main findings in Section 4.
2. Experimental Arrangement
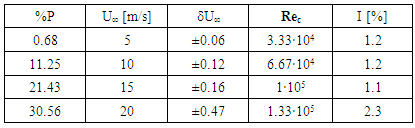
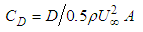
- Experimental tests are performed in the Vehicle Aero-Hydrodynamics Laboratory (VAHL) at Málaga University, with a closed (return-flow) low-speed wind tunnel, which has a 4 m long closed test section, with one squared meter cross-section. The free-stream velocity ranging from U∞ = 4 to 30 m/s. The turbulence level (Turbulence Intensity I [%]) is shown in Table 1. The calibration of the free-stream velocity was done by means of Laser Doppler Anemometry (LDA). The percentage of power %P supplied to the four wind tunnel fans (relative to their nominal power) is the control parameter. This parameter produces a wind velocity U∞ with a given deviation δU∞ LDA. The values %P, U∞ LDA and δU∞ LDA are also shown in Table 1. We use four different free-stream velocities. The chord based Reynolds number Rec is defined as Rec = U∞·c/ν; ν being the temperature-dependent kinematic viscosity of the air. The blockage ratio is lower than 1\%, so this effect is negligible. The model is a solid rectangular wing NACA0012 airfoil. The wing model has a chord and a length of c=100 mm and l=200 mm, respectively, so the aspect ratio is AR = l/c = 2. The NACA0012 airfoil is made from an aluminium alloy with rounded wingtip. The maximum thickness is 12 mm and it is located at 30 mm from the profile leading edge [20, 21].The wing is firmly fixed to a cylindrical base, also made of aluminium, allowing the coupling of the wing to a precision force sensor placed under the test section floor (see the sketch in Figure 1 and photographs in Figure 2). This digital device measures 3D forces and it is levelled taking into account the location of the Z-axis in the vertical position respect to the measurement section floor, in other words, Z-axis is parallel to the gravitational force. The X-Y force sensor plane is perpendicular to the longitudinal axis of the wing, the X-axis being parallel to U∞. The force sensor is coupled to an automatic rotation system which allows to vary the wing-base system orientation in the range of α = [-180º, 180º]. The rotation mechanism was previously calibrated to ensure its accuracy [24].Experiments are carried out during T = 200 s, and for the AoA ranging from α = 0º to α = +35º constraining the rotation angle to 1 or 2 degrees increments, depending on the case.
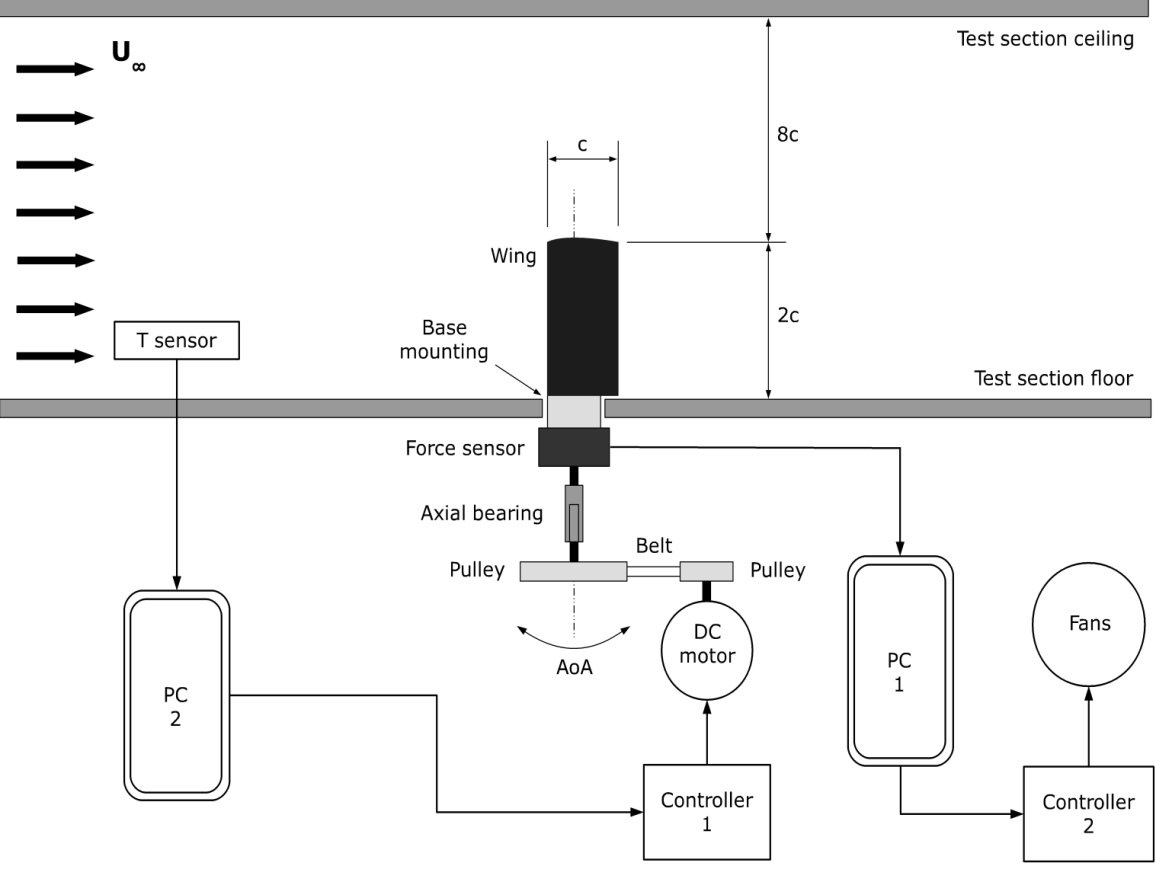 | Figure 1. Schematics of experimental set-up with the wing model mounted |
|
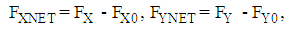
 as function of α, that corresponds to the angle where the force F presents its minimum value. Besides, and following an accurate experimental procedure [24], a set of experiments for different AoA are carried out without velocity in the tunnel in order to determine the force offsets (FX0,FY0) in the plane X-Y, and possible deviations in the Z axis measuring the weight of the wing. Therefore, the expressions for the different angles and forces are:
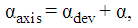 | (1) |
 | (2) |
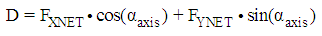 | (3) |
 | (4) |
 | (5) |
 | (6) |
 | Figure 2. Up: NACA 0012 profile inside the wind tunnel; Down: digital force sensor coupled to an automatic rotation system which allows to vary the wing-base system orientation in the range of α = [-180º, 180º] |
3. Aerodynamic Characteristics: Results and Discussion
- Drag coefficients as function of α are depicted in Figure 3. One can observe in the inset that our results also show a slight deviation in comparison to those obtained by Ngo [23]. Besides, our values of CDmin are in agreement with those reported by Mueller [6] for a flat wing with the same aspect ratio and Reynolds numbers. However, our results differ from those given by Sheldahl [17] for a bidimensional NACA0012 airfoil. The main cause of this discrepancy is the appearance of effects in the trailing edge, e.g. wingtip vortex formation, which dominate the wing aerodynamic performance due to the low-aspect-ratio of the model, AR = 2. In addition, the tip vortex constrains the laminar separation bubble at the leading edge. This effect was reported in Yen [25]. For this reason, the drag coefficient induced by three-dimensional effects at null AoA is approximately five times greater than the value of CDmin for a 2D profile measured by Sheldahl [17].Regarding the ratio between drag coefficient and AoA, ΔCD/Δα, we observe an increment of its value up to the stall angle, so that the wing loses its aerodynamic effectiveness. Different slopes are found at each Reynolds number, increasing the values of the slope with the AoA up to the stall angle. These ratios are of great interest in the case of the lift coefficient, as it will be discussed below.
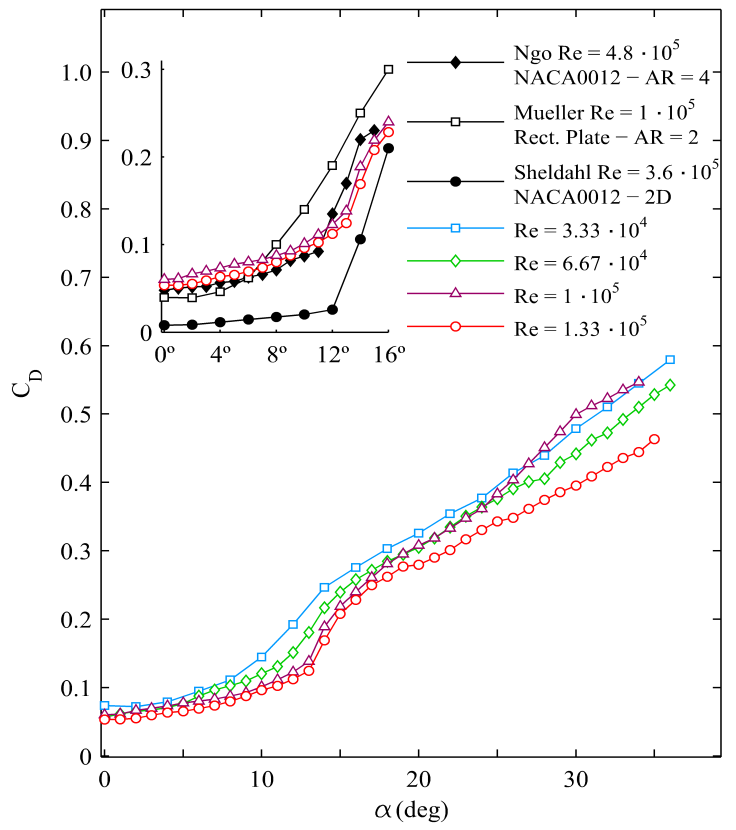 | Figure 3. CD vs α for all Reynolds numbers tested. The inset represents a zoom of CD values for low angles of attack and high Reynolds numbers, together with those reported by Ngo and Barlow [23], Mueller and Torres [6] and Sheldahl and Klimas [17] |
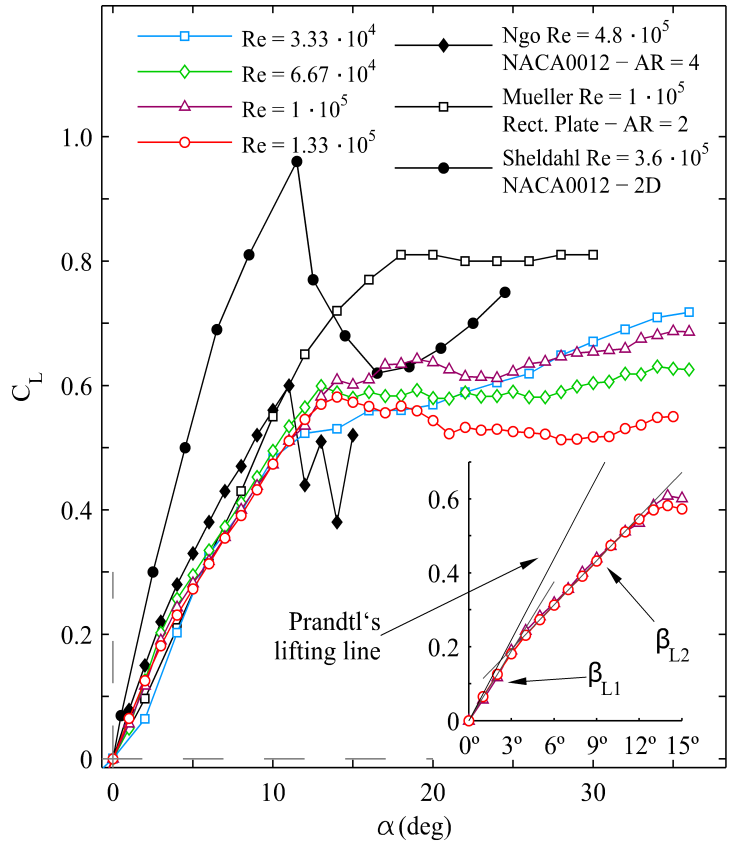 | Figure 4. CL vs α for all Reynolds numbers together with those reported by Ngo and Barlow [23], Mueller and Torres [6] and Sheldahl and Klimas [17]. The inset shows detail of βL1 and βL2 for the two highest Reynolds numbers in comparison to the result from Prandtl’s lifting line theory for symmetric, rectangular wing with no twist and finite span [26] |
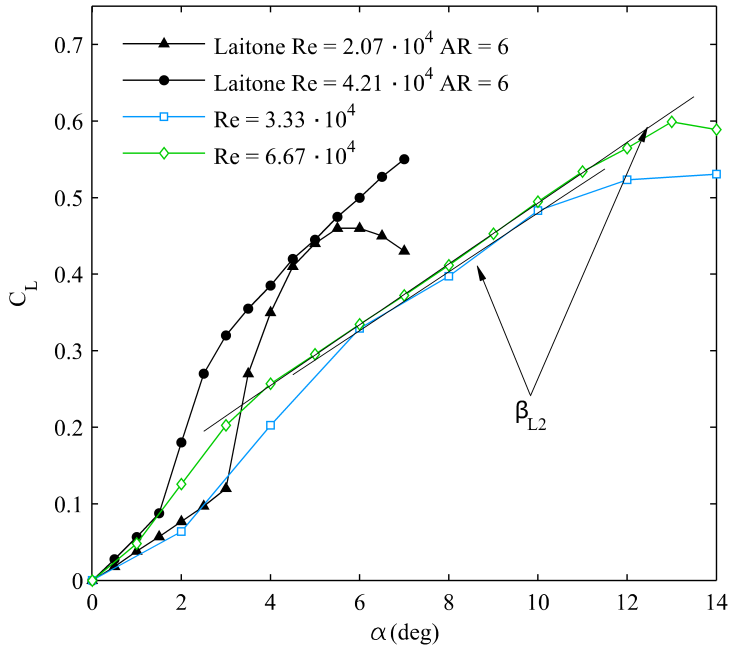 | Figure 5. CL vs αfor Rec = 3.33·104 and Rec = 6.67·104 with AoA values lower than the stall angle (AR = 2), together with Laitone’s data [22] (AR = 6, I = 0.02%) |
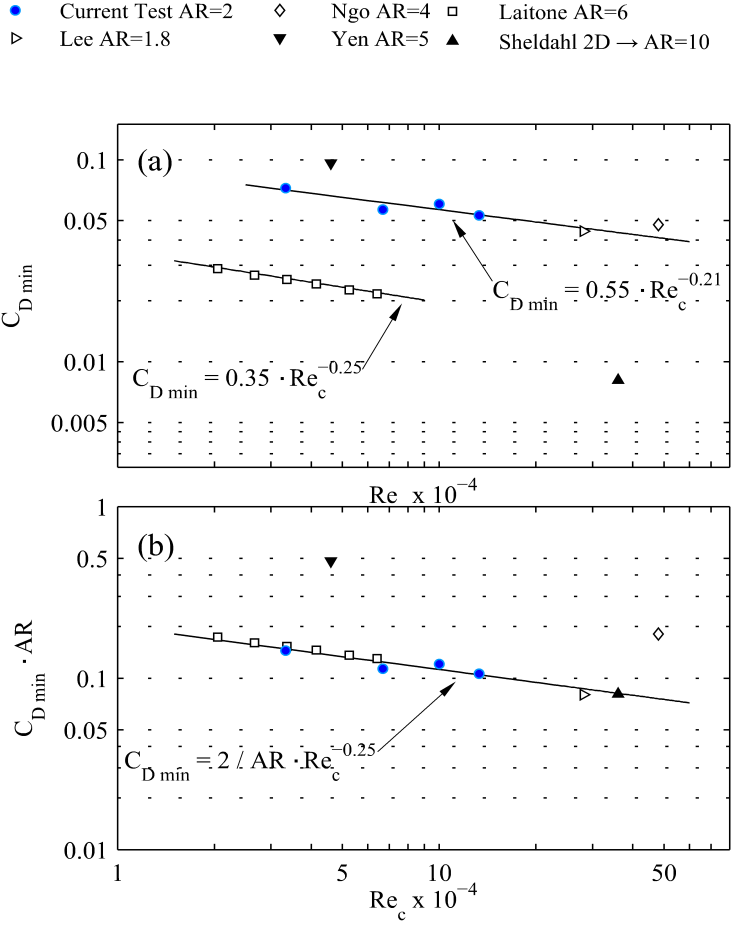 | Figure 6. (a) CDmin vs Rec for 3.33·104≤Rec≤1.33·105 and AR = 2 compared with the results of Ngo and Barlow [23], Yen and Huang [25], Laitone [22], Lee and Pereira [9] and Sheldahl and Klimas [17]. (b) CDmin · AR vs Rec for the universal NACA 0012 wings fitting law CDmin = 2/AR·Rec−0.25 |
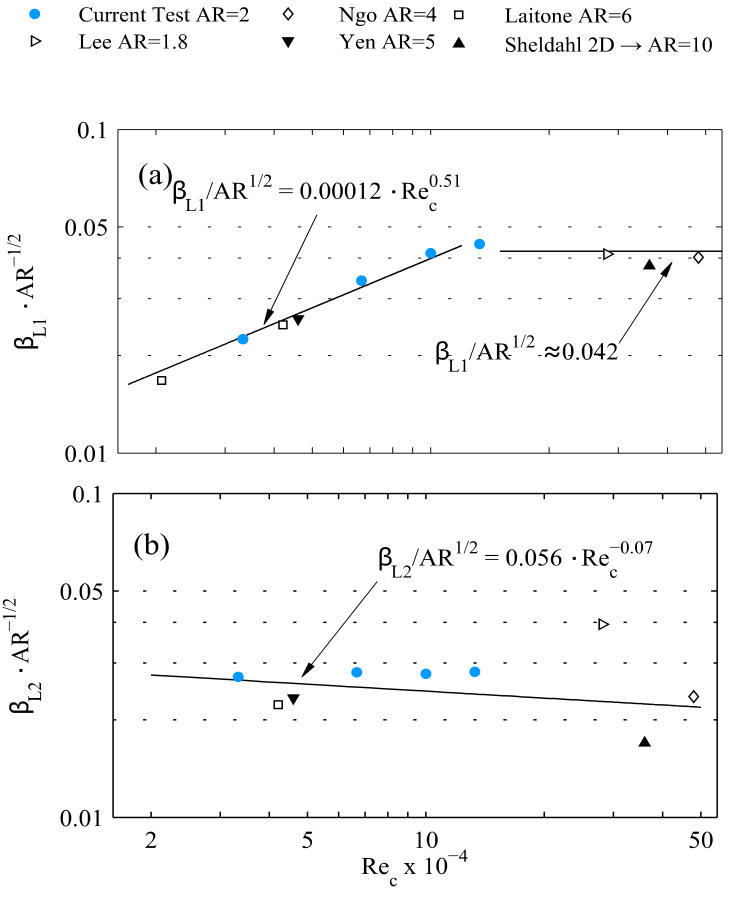 | Figure 7. Curve fitting for βL1 ·AR-0.5 vs Rec (a) and curve fitting for βL2·AR-0.5 vs Rec (a) for 3.33·104 ≤Rec ≤1.33·105 and AR = 2 (b) together with those results reported by Ngo and Barlow [23], Yen and Huang [25], Laitone [22] and Lee and Pereira [9] |
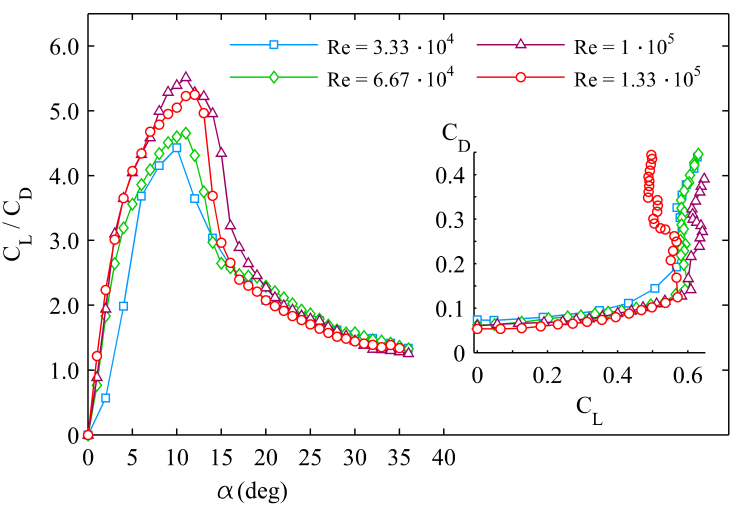 | Figure 8. Lift-Drag ratio CL/CD vs angle of attack α. The inset shows CD vs CL for all Reynolds numbers tested |
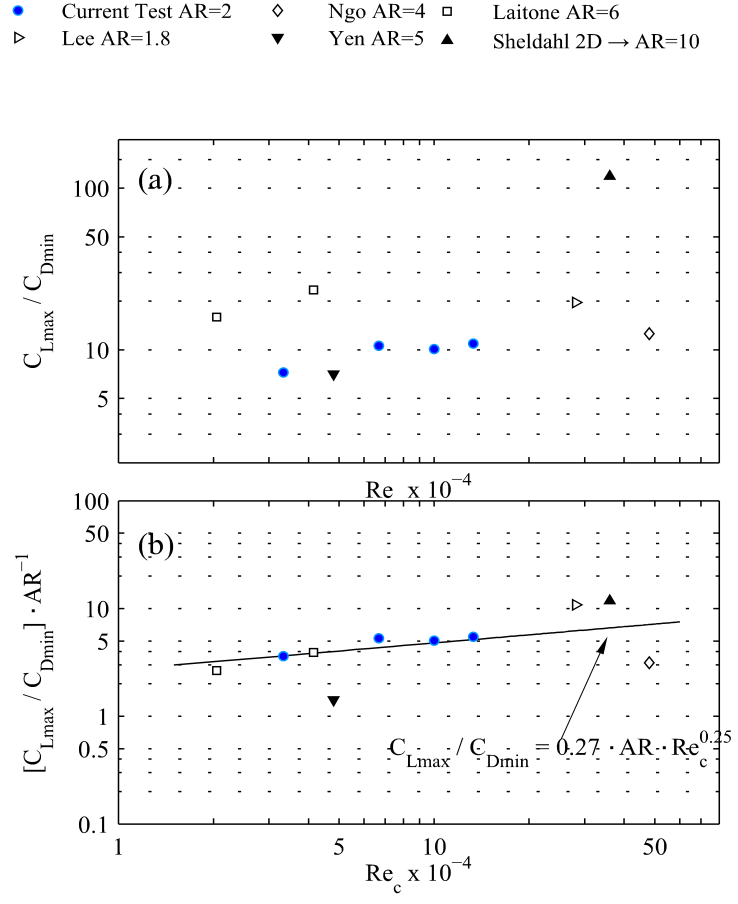 | Figure 9. (a) CLmax/CDmin vs Rec for 3.33·104 ≤ Rec ≤ 1.33·105 and AR = 2 compared with the results of Ngo and Barlow [23], Yen and Huang [25], Laitone [17], Lee and Pereira [9] and Sheldahl and Klimas [17]. (b) CLmax/CDmin·AR−1 versus Rec for the fitting law CLmax/CDmin=0.27·AR·Rec0.25 |
4. Conclusions
- The precise dynamic response of low-aspect-ratio NACA0012 airfoil (aspect ratio, AR = 2) has been characterized by means of a digital force sensor at low-to-moderate Reynolds numbers. We compute drag and lift coefficients through the temporal evolution of force measurements. We show in this experimental study that wingtip vortex generation and low-aspect-ratio are the main causes of the lift force reduction in comparison to the NACA0012 (bidimensional) infinite profile, being this reduction almost 40% for any value of the Reynolds number. In addition, the edge effect generates an induced drag force which provides a value six times greater than the (bidimensional) infinite profile. Finally, and regarding the aerodynamic characteristics, the critical (stall) angle, αstall, takes place at 12 degrees approximately, and this angle increases with the Reynolds number slightly.On the other hand, the relation between CDmin and Rec has been experimentally adjusted and verified with previous studies for any AR by the expression CDmin = 2/AR·Rec-0.25. Besides, we pay our attention on the lift coefficient, so we define the ratio between the increment of lift coefficient and the angle of attack, ΔCL/Δα, namely βL1 for 0º ≤ α ≤ 3º and βL2 for 0º ≤ α ≤ αstall. Our main finding of this experimental study is the general curve fittings for βL1 and βL2, and any value of AR. We find that βL1· AR-0.5 strongly depends on Rec up to Rec ≈ 1·105 (βL1·AR-0.5=0.00012·Rec0.51), being βL1·AR-0.5 almost constant for Rec greater than 1·105 (βL1·AR-0.5 ≈ 0.042). On the other hand, βL2·AR-0.5 is also constant for all Rec considered in this work (βL2·AR-0.5 = 0.056·Rec-0.07). In addition, we propose a general correlation for the relation CLmax/CDmin and any AR: CLmax/CDmin = 0.27·AR·Rec0.25. Finally, we do observe that the critical chord based Reynolds number Rec ≈ 1·105 at which βL1 saturates its value is connected to the change of the upward trend in the maximum value of the polar curve. More effort must be done regarding forced vibration response. This is a work in progress.
ACKNOWLEDGEMENTS
- This research has been supported by Proyecto Junta de Excelencia de la Junta de Andalucía, Grant number P11-TEP-7776.