-
Paper Information
- Paper Submission
-
Journal Information
- About This Journal
- Editorial Board
- Current Issue
- Archive
- Author Guidelines
- Contact Us
International Journal of Aerospace Sciences
p-ISSN: 2169-8872 e-ISSN: 2169-8899
2013; 2(4): 149-162
doi:10.5923/j.aerospace.20130204.01
Wall-Resolved Large Eddy Simulation over NACA0012 Airfoil
 Abstract
 Reference
 Full-Text PDF
 Full-text HTML
Yujing Lin 1, Mark Savill 1, Nagabhushana Rao Vadlamani 2, Richard Jefferson-Loveday 2
1Cranfield University, Cranfield, MK43 0AL, UK
2Cambridge University, Cambridge, CB3 0WA, UK
Correspondence to: Yujing Lin , Cranfield University, Cranfield, MK43 0AL, UK.
| Email: |  |
Copyright © 2012 Scientific & Academic Publishing. All Rights Reserved.
The work presented here forms part of a project on Large-Eddy Simulation (LES) of aeroengine aeroacoustic interactions. In this paper we concentrate on LES of near-field flow over an isolated NACA0012 airfoil at zero angle of attack with Rec=2e5. The predicted unsteady pressure/velocity field is used in an analytically-based scheme for far-field trailing edge noise prediction. A wall resolved implicit LES or so-callednumerical Large Eddy Simulation (NLES) approach is employed to resolve streak-like structure in the near-wall flow regions. The mean and RMS velocity and pressure profile on airfoil surface and in wake are validated against experimental data and computational results from other researchers. The results of the wall-resolved NLES method are very encouraging. The effects of grid-refinement and higher-order numerical scheme on the wall-resolved NLES approach are also discussed.
Keywords: Wall-Resolved Large Eddy Simulation, NACA0012 Airfoil, Trailing-Edge Noise Prediction
Cite this paper: Yujing Lin , Mark Savill , Nagabhushana Rao Vadlamani , Richard Jefferson-Loveday , Wall-Resolved Large Eddy Simulation over NACA0012 Airfoil, International Journal of Aerospace Sciences, Vol. 2 No. 4, 2013, pp. 149-162. doi: 10.5923/j.aerospace.20130204.01.
Article Outline
1. Introduction
- Aeroengine noise pollution is a pressing regulatory issue with a great demand for increased capacity at airports, stringent local restrictions on night-time flying, and heavy final penalties for infringement of day-time noise limits. Thus the understanding and control of engine noise is an absolutely crucial and central issue for industry. Broadband fan noise has been identified as the most significant engine contribution to noise. Furthermore, trailing-edge broadband noise is one of the most important components of the noise from fan blades and outlet guide vanes. It is generated due to the scatter of turbulent kinetic energy from the rotor turbulent boundary layer into acoustic energy at the edge. However, the sound generation mechanisms associated with broadband fan noise are poorly understood due to its general complexity and several distinct sources of fan noise, including rotor self-noise, rotor-tip/boundary layer interaction, and rotor-wake/OGV interaction[1, 2]. Noise generation on an isolated airfoil is representative of more complex cases such as airframe and high-lift device noise and turbomachinery noise in general. Even though airfoil noise has been studied extensively in the past, it still is a relevant topic for experimentaland numerical investigations. Yet, as isthe case with many fundamental aeroacoustic problems, not all aspects of noise generation have been fullyexplored and understood, such as noise associated with the vortex shedding from a blunt trailing edge, or boundary layer separation (laminar or turbulent) induced noise. In both cases, the narrowband peaks or tones associated with possible vortex shedding from the separated layer/blunt edge may be present in addition to broadband noise.Large-eddy simulation (LES), which aims to solve numerically the larger turbulent scale fluctuations in space and time while modeling the effect of more universal small turbulent scales using a subgrid-grade (SGS) model, is a promising approach for improving our understanding of fan noise generation and also providing data needed for the development of prediction methods. A dominant issue with LES-based methods is the interaction of discretization numerics with LES SGS models. For example, the analyses of Ghosal[3] and Chow and Moin[4] illustrate that for low-order schemes the numerical discretization can be as influential as the SGS model itself. In some cases, where excessive dissipation occurs, it can be helpful to omit the SGS model altogether. Following Pope[5], this is referred to as numerical large-eddy simulation (NLES), and hence the unresolved small eddied are accounted for by means of the numerical dissipation and no SGS model is employed such that the full (unfiltered) Navier-Stokes equations are solved.It should be noted that in some references[6, 7], this method is also called implicit LES (ILES).Another significant issue with LES methods is the grid-resolution requirements necessary in the near-wall regions of flow. These areas can possess small streak-like structures requiring very fine meshes of the order of (in non-dimensional wall units)
 ,
, and
and  [8]. As noted by Pope[6], LES results depend on both the numerical method used and mesh spacing.Our present work forms part of a project on the use of LES for broadband rotor-wake/OGV interaction noise prediction. The first stage of the project aims to assess the capability of a wall-resolved NLES approach of predicting the unsteady boundary layer flow near the trailing edge of airfoil and fan blade, andidentifying near-field noise sources. Then in the second stage the turbulence statistics from NLES downstream of the airfoil/fan blade trailing edge will be collected and input into an analytically-based scheme for far-field noise prediction.In this study, therefore, we focus on the near-field flow around an isolated NACA0012 airfoil with zero angle of attack at a chord-based Reynolds number of
  . The boundary layer flow transition to turbulence in the region close to the trailing edge has been investigated, where narrowband peaks and tones associated with vortex shedding superimposed onto the broadband noise induced by turbulent boundary layer. This type of simulation can significantly benefit from the use of a high-order method due to the high computational cost involved, and also requires low numerical dispersion and dissipation[9], therefore a wall-resolved NLES approachas implemented in a structured high-order curvilinear code BOFFSis used for numerical simulation. The NACA0012 airfoil case is chosen since extensive experimental and computational data are available for comparison[10-12], which particularly focuses on its boundary layer flow separation and turbulence transition, as well as the associated noise generation. The boundary layer profiles (mean velocity and turbulence intensity) are validated against experimentsin details. Such information is hardly published, despite the fact that the NACA0012 airfoil has been extensively studied in literature. It should be noted that the published eddy resolving simulations on NACA0012 airfoil mainly focus on detached eddy simulation (DES) with Reynolds number range of
  -
- . Shur et al[13] use standard DES to simulate a NACA0012 airfoil at an angle of attack of 60̊ creating a massively separated flow.Strelets[14] extended the NACA0012 work of Shur et al. This time the Menter SST based DES framework and also more sophisticated, flow based, control of numerical smoothing is used. Tucker[15] then carried out simulations on the same case using hybrid RANS-NLES. There are several other LES and DES studies of flow past different types of low-speed airfoils, with the range of Reynolds number
  from
from  to
to  (see Marsden et al [16] and references therein). Lighthill’s equation or Kirchhoff formulation was used to calculate the acoustic far-field afterwards[16]. All these simulations are based on hybrid RANS-LES framework to overcome the problem of high grid-resolution requirements in the near-wall regions in LES. As far as the authors are aware, there is no wall-resolved NLES approach employed on any airfoil cases in the archival literatures.The objectives of this study include: (1) to evaluate the capability of the wall-resolved NLES approach in BOFFS solver to capture the unsteady velocity and pressure field on NACA0012 airfoil, especially in the region close to the trailing edge; (2) to investigate the influence of grid-refinement and a higher-order numerical scheme on this type of simulation; (3) to provide input data of unsteady velocity/pressure fieldfor an analytically-based far-field noise prediction scheme.
2. Methodology
2.1. Numerical Method
- Simulations are performed using the structured curvilinear code BOFFS[8], which is a Navier Stokes flow solver based on the flux difference splitting (FDS) method[17], designed to test turbulence modeling strategies. Details of the numerical method are given in reference[8], hence only some of the key issues relevant to this study are highlighted here.For the artificial compressibility formulation, a time derivative of pressure is added to the continuity and a parameter β is introduced, giving
 | (1) |
 represents a pseudo-time which is unrelated to the real time t. Hence, the governing equations for unsteady RANS and LES can be written by combining Eq. (1) with the momentum equation for constant-density flows in the following form:
 | (2) |
 is a fluid velocity component, ρ is density, μ is dynamic viscosity, p is static pressure, t is time, and x is axial coordinate. In addition, an external scalar transport equation as followingis solved for temperature T:
 | (3) |
 is calculated using
  | (4) |
 , the eddy viscosity in a RANS simulation and
  , the subgrid-scale viscosity for LES simulation.
  is the Kronecker delta:
 | (5) |
 is expressed as:
 | (6) |
 controlling the numerical dissipation in the scheme. This can be considered essentially as
  | (7) |
 ,
, ,
, represents the interface flux, its central difference term and smoothing term, respectively. Here,
  may take on a value between 0 and 1. For
  , this leads to a central difference scheme, whereas a non-zero value will provide dissipation to help suppress any oscillations. For the simulations presented in this study, second-order central scheme with a third-order smoother and sixth-order central scheme with a seventh-order smoother are used. Time advancement is implicit using the artificial compressibility algorithm of Rogers &Kwak[19] which is based on Roe’s flux difference splitting scheme[17]. The artificial compressibility parameter
  is chosen to give the fastest convergence. For steady-state simulations, the pseudo-time derivative is discretized using a first-order backwards difference and the right-hand side is linearized about the pseudo-time level. For time accurate simulations, an extra real time derivative is added to the governing equations, and a Galerkin time discretization[20] is used. Hence at each physical time level, the equations are iterated in pseudo-time such that a zero divergence velocity field is obtained. Once achieved, the vectors are updated to the latest values.
2.2. Self-Adaptive Discretization (SDS) Scheme
- In an effort to minimize the smoothing contribution, an approach similar to Mary &Sagaut[21] and more recently Ciardi[22] is adopted. This works by taking a stencil of four nodes associated with interface flux
 and checking for wiggles in the primitive variables
  by looking for the coexistence of a maximum and a minimum along the stencil. If a wiggle is detected, the local value of is increased; otherwise, it is decreased according to Eq. (8).
 | (8) |
 correspond to the increment in
  , the maximum allowable
  , and the minimum allowable
  . A parameter
  also controls the number of updates per time step. To assess the characteristics of the various spatial discretization schemes, one test case, the development of a subcritical Tollmien-Schlichting (T-S) stability wave in a plane channel, is examined[23]. It is found that the SDS scheme has the effect of minimizing the numerical dissipation while maintaining solution stability. Below
 , it became difficult for solutions to converge.Moreover, the use of the SDS scheme is worthwhile for the more dissipative second-order scheme. There is very little benefit in the use of the higher sixth-order scheme. For the simulations presented here,
  ,
, ,
,  , and
, and  .Further investigation of this scheme is examined in[8] by assessing its performance for decaying homogeneous isotropic turbulence with and without a standard Smargorinsky SGS model. It is concluded that even with the SDS scheme, the use of a SGS model is too dissipative in the high-wave-number region unless a prohibitively low value of numerical smoothing is used. The required level of smoothing is not practical in terms of instability, and it is noted that it is likely to be worse on coarser meshes. For the scheme here, the strongest influence is dissipative (dispersion has been minimized). Hence to prevent excessive dissipation, SGS model is omitted. As in Eq. (4),
  , and the dissipation is provided by the numerical diffusion. Very fine grid spacing is used close to the wall to filter out naturally the smallest turbulent scales and to get the streak-like near-wall structures resolved. It should be noted that this wall-resolved NLES approach has been validated for a range of simple and complex flow cases[8, 23-24], which, however, mainly focus on free jet/jet impingement applications, including Grinstein and Fureby[25], Shur et al.[26], and Tucker[23, 24]. It hasn’t been employed for any fan blade/airfoil cases in the context of aeroacoustic computation.
2.3. NACA0012 Airfoil
- This study is focused on an isolated NACA0012 airfoil with zero angle of attack. The case setup is designed to match the experiments of Sagrado[10]. The airfoil has been placed at the exit of an open-circuit blower type wind tunnel with a rectangular cross section of 0.38m by 0.59m. The freestream turbulence intensity of the tunnel is 0.4%, allowing the investigation of the flow around the airfoil in a smooth inflow[10]. The NACA0012 airfoil used has a chord of 300mm and an aspect ratio of 1. Two different trailing edge (TE) thicknesses have been investigated in experiments[10] - a sharp TE with a thickness at the trailing edge of 0.76mm and a blunt TE produced by reducing the chord by 3mm such that the thickness at the trailing edge would be 1.6mm. According to Blake[27] and Sagrado[10], there is no evidence of vortex shedding in the case of a sharp TE whereas for a blunt edge, vortex shedding is noticeable, which has been identified as main contributor to narrowband noise and tones in airfoil trailing edge noise generation. In present numerical investigations, the NACA0012 airfoil with a chord of 297mm for a blunt TE is used. The freestream velocity is 10m/s, corresponding to Reynolds number
 .
.2.4. Mesh
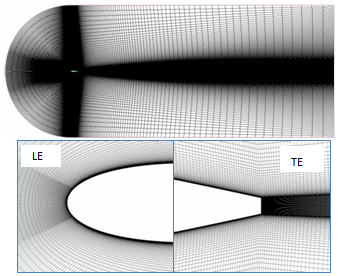 | Figure 1. Fine mesh in computational domain (top: whole domain; bottom: mesh details around airfoil LE & TE) |
 . The grid spacing is uniformly distributed in the spanwise direction corresponding to
  . The grid along streamwise direction corresponds to a spacing of
  , and is clustered towards airfoil LE and TE.The mesh is constructed from hexahedral elements with a total of 2.5million (shown as M later) nodes for the coarse mesh and 12M for the fine mesh. Significant refinement is performed along spanwise direction in the fine mesh with an increasing of grid lines from 40 to 130 accordingly. It is noted that the refined mesh is set to cover the full boundary layer, the trailing edge and the wake up to 6% chord length, which is the region where the measured experimental data is available. The spanwise plane of the fine mesh in the whole domain and the closer view near airfoil LE and TE are shown in Figure 1.In BOFFS solver application, multi-block grids are used allowing local area mesh refinement, particularly for meshing more complex geometries. The calculations on each block are separate in their own right, and data is transferred between each block during the iterative procedure until overall convergence is attained. Overlap-blocking is employed here where boundary information is exchanged between these overlapping grids via the interpolation of the flow variables. The decomposition of the domain into separate ‘pieces’ is also advantageous for parallel processing when blocks are of similar density[8].Parallel computing is necessary to present more expensive wall-resolved NLES calculations. Both MPI and OpenMP standards for parallel programming on distributed and shared memory systems are available in BOFFS solver[8].
2.5. Boundary Conditions
- At inflows, upstream inlet velocity
 , corresponding to
 , is specified while pressure is extrapolated from interior nodes. At outflow boundaries, velocity components are extrapolated and the static pressure is specified. Flow in spanwise directions is set to be periodic. The upper and lower flow boundaries of the domain are set to be symmetry. At the walls, a non-slip condition is specified and the pressure gradient set to be zero.
3. Results and Discussion
- The wall-resolved NLES approach as implemented in BOFFS is employed in this study. Simulations are carried out with two schemes - lower second-order scheme and higher sixth-order scheme based on two meshes - 2.5M coarse mesh and 12M fine mesh. First-order steady simulation is done first to provide initial flow conditions. Second-order unsteady calculation is thencarried out with an initial constant smoothing parameter
 to suppress severe solution divergence. Gradually,as the flow field becomes stable, the constant smoothing parameter is decreased and replaced by a varying
  as in Eq. (8). Sixth-order simulation is performed ultimately by taking the second-order solution as initial flow conditions. As the sixth-order scheme is less sensitive to the SDS scheme than the second-order scheme[24], a varying of
  with
with 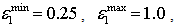 and
and  is usedto maintain stability and accuracy of solutions.Turbulence samples were collected after the initial turbulent flow field had settled down. The simulation time to gather turbulence statistics corresponds to approximately 7-8 flow through time based on freestream velocity and the airfoil chord length.LES over the NACA0012 airfoil based on the same domain was performed at
  by Li et al[11, 12] using Rolls-Royce compressible CFD code HYDRA. HYDRA is basically a density based finite volume approach and uses a mixed element unstructured mesh with a median dual control volume. A wall-adapting local eddy-viscosity (WALE) SGS model is utilized for LES. The compressible HYDRA solver uses a second-order accurate centered numerical scheme. The solution from HYDRA presented here is based on a 9M fine mesh.The comparisons between computational results from wall-resolved NLES using BOFFS and LES-SGS using HYDRA and experimental data[10] are presented and discussed in following sections to evaluate their suitability to predict the near-field flow over the NACA0012 airfoil in terms of boundary layer profiles (mean velocity and turbulence intensity). The effects of grid refinement and higher-order scheme of wall-resolved NLES on NACA0012 airfoil flow is also of interest.
 3.1. Flow Field Description
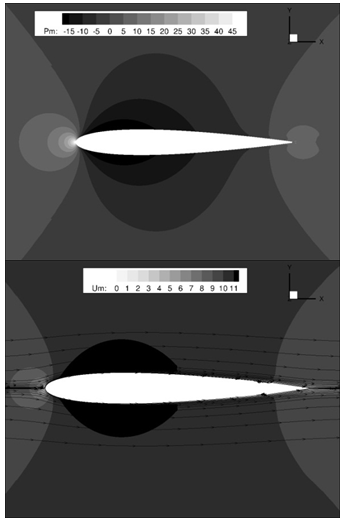 | Figure 2. Mean pressure (top) and mean streamwise velocity (bottom) profile @ mid-span plane |
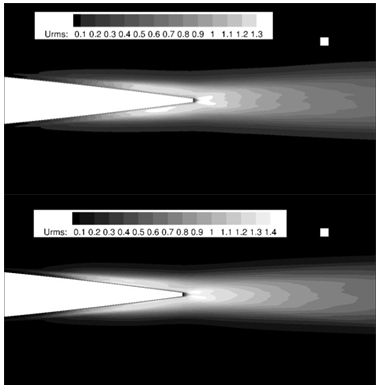 | Figure 3. Contours of RMS velocity @mid-span plane (top - fine mesh; bottom- coarse mesh) |
 | (9) |
 are the anti-symmetric and symmetric part of the velocity gradient respectively, that is,
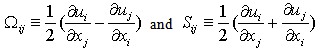 | (10) |
 and the rate of strain
 . In the core of a vortex,
  , since vorticity increases as the centre of the vortex is approached. Thus regions of positive Q-criterion correspond to vortical structures. The averaged iso-surface of Q-Criterion
  is shown in Figure 4. Here, Q-criterion is normalized by C2/U02 and its contour is coloured by mean static pressure. Again, both fine mesh (top) and coarse mesh (bottom) solutions from sixth-order schemeare presented and compared here. Clearly, towards the TE, the rollup of two-dimensional turbulent eddies can be observed due to boundary layer flow separation and turbulence transition. It progressively becomes three-dimensional when they impact the blunt trailing edge.With spanwise grid refinement, the turbulence vortical coherent structures are much better resolved.
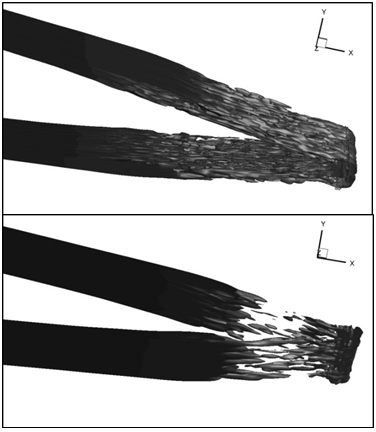 | Figure 4. Iso-surface of normalized Q-Criterion,  (top - fine mesh; bottom - coarse mesh) (top - fine mesh; bottom - coarse mesh) |
3.2. Mean and RMS Fields
- The distributions of streamwise mean velocity and RMS velocity at mid-span plane from wall-resolved NLES are collected and presented in Figure 5 and 6 at three wake locations x/C=1.01, 1.02 and 1.05. Here, BOFFS NLES solutions are presented in two groups: one is from second-order scheme and compared with second-order HYDRA LES-SGS solutions and experimental data; the other is from six-order scheme and compared with second-order scheme solutions and experimental data. The effect of mesh refinement is illustrated by comparing fine mesh and coarse mesh solutions in both groups. In the present analysis, streamwise mean velocity and RMS velocity are rescaled by experimental freestream velocity at the outlet. Figure 5 depicts the velocity profiles in wake.Due to the bigger thickness of the blunt TE, velocity profiles reach very small values of velocity at the position very near the edge (x/C=1.01), which is predicted very well by numerical simulations. Wall-resolved NLES solutions show very good agreement with experiments in terms of mean velocity profile at wake locations of x/C=1.01 and 1.02, showing better performance than HYDRA SGS-LES. However, at wake location x/C=1.05, both HYDRA LES and BOFFS NLES show large deviation from experimental data, and numerical computations overestimated the mean velocity values near the extended airfoil center line . In addition, the symmetry of the profiles in the wake confirms the alignment of the airfoil with the flow at zero angle of attack.Regarding the effect of mesh refinement, under a second-order scheme, the fine mesh shows better agreement with experiments than the coarse mesh at positions near the edge (x/C=1.01 and 1.02),due to better resolved turbulence structures around airfoil trailing edge, which has been identified to have significant influence on wake flow. Further downstream of TE (x/C=1.05), both the coarse meshand fine mesh over-estimated the minimum velocity values. The difference between the coarse mesh and the fine mesh becomes unnoticeable under higher six-order scheme. For the fine mesh, the influence of numerical schemes on NLES is negligible. It is expected that the advantage of higher-order scheme in accuracy is less obvious with mesh refinement. In Figure 6, the RMS velocity profile in the wake at three different positions is plotted. The turbulence intensity at the position very near the edge (x/C=1.01) shows two strong peaks with a sharp minimum between them. This may be related to the presence of a quasi-periodic unsteady vortex shedding due to the larger thickness of the blunt edge (1.6mm). The BOFFS NLES with a fine mesh under a sixth-order scheme can capture the strong peaks very well, but over-predicts the minimum value between them. At the other two locations, BOFFS NLES over-predictsboth the peaks and the minimum turbulence intensity values, but still gives results agreeing better with experiments than HYDRA SGS-LES.The effect of a higher order numerical scheme and mesh resolution on RMS velocity solutions is more significant than that on mean velocity in NLES, as shown in Figure 6. Under a lower second-order scheme, the fine mesh performs much better than the coarse mesh despite both over-predicting the peak and minimum turbulence intensity values. However, the effect of mesh resolution becomes smaller as a higher order scheme is used. For fixed mesh resolution (fine mesh), the higher-order scheme can give closer results than the lower-order scheme. In summary, mesh refinement along the spanwise direction appears to be more influential on mean and RMS velocity than the numerical scheme in a wall-resolved NLES approach; the higher-order scheme in BOFFS NLES has more significant effect on turbulence intensity profile than mean velocity profile.The boundary layer velocity and turbulence intensity (RMS velocity fluctuation) profile at 8 streamwise locations between x/C=0.45 and 0.98 have been presented and validated against experimental data, as shown in Figure 7 and 8. Again both velocities are re-scaled by experimental freestream velocity at the outlet boundary. The Y-axis represents radial distance from airfoil surface boundary. As noted above, mesh resolution is more influential than numerical scheme in the wall-resolved NLES approach, hence only the sixth-order scheme based on both fine and coarse meshes is used for comparison with HYDRA LES and experimental data. It should be noted there is only a slightly difference between streamwise and radial grid spacing between the fine and coarse meshes, hence any difference between the fine mesh and coarse mesh solutions is mainly contributed by spanwise mesh refinement.In experiments, the boundary layer flow is observed to separate at approximate location x/C=0.65, then re-attaches at location x/C=0.97, resulting in a short separation bubble. The maximum displacement area locates at x/C=0.86 to 0.88, and the transition region is located at x/C=0.86 to 0.90[10]. In wall-resolved NLES, the velocity and turbulence intensity profiles have been examined carefully and it is shown that on most of airfoil surface the boundary layer is laminar up to the point x/C-0.76 where it separates due to the mild APG, then it undergoes transition along the separated shear layer and reattaches rapidly upstream of the TE at point x/C=0.90 resulting in a shorter separation bubble compared to experimental findings. Like experimental observation, the transition takes place further downstream of the separation point, in the region of the maximum displacement x/C=0.80-0.84. According to Hatman and Wang[28], it is a typical laminar separation – short bubble transition mode, dominated by the Kelvin-Helmholtz (K-H) instability. Obviously, NLES delays the flow separation and consequently the boundary layer transition. This might be due to the smooth laminar inflow conditions in NLES, whereas in experiments, inflow has turbulence intensity of 0.4%. HYDRA LES captured flow separation at location of x/C=0.65, and then a stronger separated boundary layer flow with a much bigger displacement at downstream locations, until flow reattached at location x/C=0.96. These figures agree well with experimental data except for stronger reverse flow and bigger displacement.
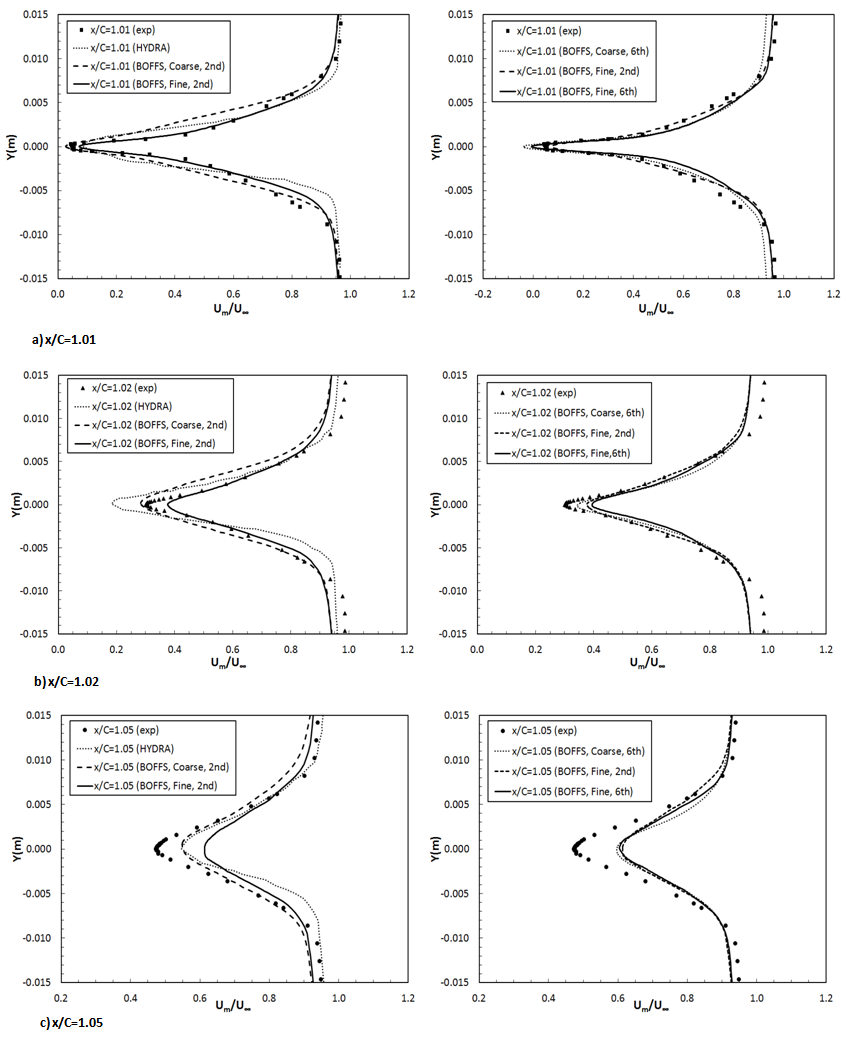 | Figure 5. Mean velocity profile at three wake locations – x/C=1.01, 1.02 and 1.05 |
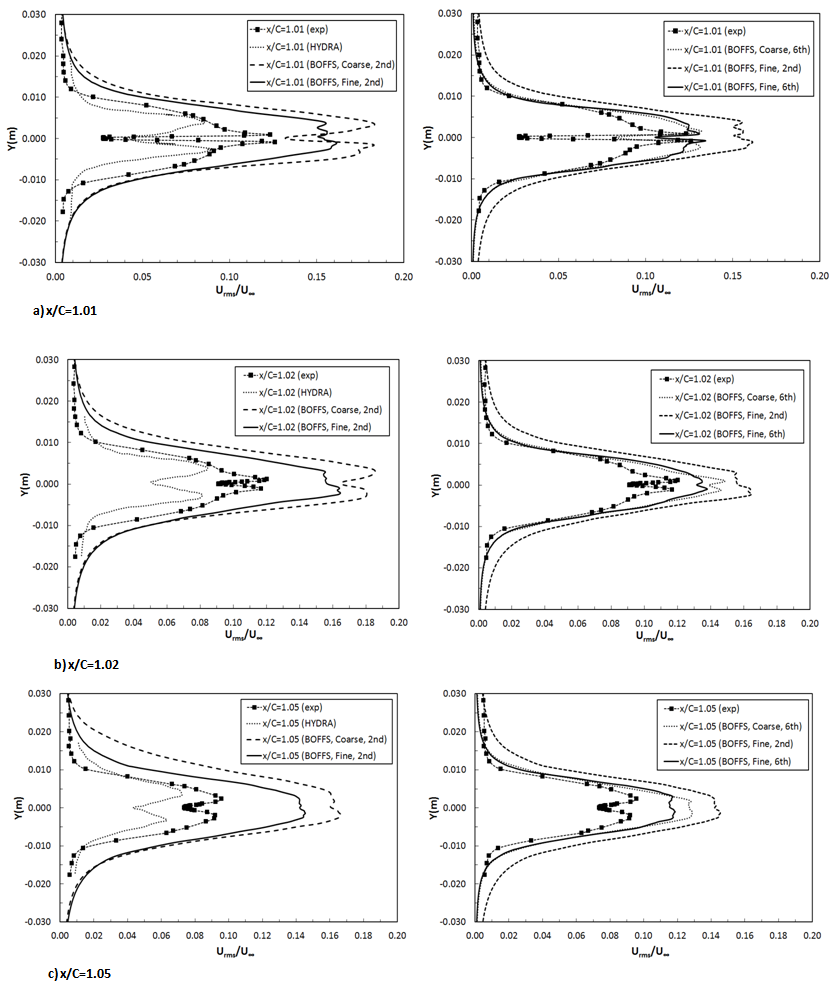 | Figure 6. RMS velocity profile at three wake locations – x/C=1.01, 1.02 and 1.05 |
 and root mean square of its fluctuation
  at cross-wire traverses locations (three points on airfoil surface – x/C=0.86, 0.90 and 0.98 and one location in wake x/C=1.01) are presented in Figure 9. The solutions from wall-resolved NLES with the sixth-order scheme based on both fine and coarse mesh and HYDRA LES are validated against experimental data. Generally speaking, the wall-resolved NLES approach is able to predict the wall-normal velocity profile and its RMS velocity well, except a little over-prediction on both velocity profiles near the wall. Mesh refinement along spanwise direction has negligible effect on wall-normal velocityprofile, but significantly influences RMS wall-normal velocity. The refined mesh gives much closer RMS velocity profiles. Wall-resolved NLES performs better than HYDRA LES in terms of wall-normal velocity profile prediction.
4. Conclusions
- An accurate numerical prediction for the near-field flow around a fan blade and its wake flow development is of outstanding importance for downstream broadband noise prediction. This has been identified as a significant contributor to modern high-bypass ratio (HBR) engine noise.In this study, a wall-resolved NLES approach, as implemented in a structured high-order curvilinear BOFFS solver, is employed to predict the near-field flow, particular boundary layer flow transition over an isolated NACA0012 airfoil with zero angle of attack at
 . The capability of NLES to capture the unsteady flow features and turbulence transition over the NACA0012 airfoil is assessed, and the boundary layer profile (mean velocity and turbulence intensity) is validated against experimental data. The influence of grid-refinement and a higher-order numerical scheme on the wall-resolved NLES approach is discussed.The comparisons between computational results and experimental data show that the wall-resolved NLES approach as implemented in BOFFS is able to predict the boundary layer flow profile around airfoil and the downstream wake flow quite accurately. The computational streamwise and wall normal velocity profile, as well as the RMS wall normal velocity show good agreement with experimental data, and better than those achieved previously with HYDRA SGS-LES. The predicted turbulence intensity in the boundary layer deviates from experimental data due to the laminar inflow conditions adopted in the NLES. As observed in experiments, the predicted boundary layer flow experiences separation, transition, reattachment and finally a fully turbulent flow near the airfoil TE, though NLES shows a delayed flow separation and consequently boundary layer transition. A short separation bubble is clearly observed with the BOFFS NLES. The transition is a typical laminar separation – short bubble transition mode, dominated by the Kelvin-Helmholtz (K-H) instability. The turbulent vortical structure near airfoil TE is captured clearly with a refined spanwise mesh.
 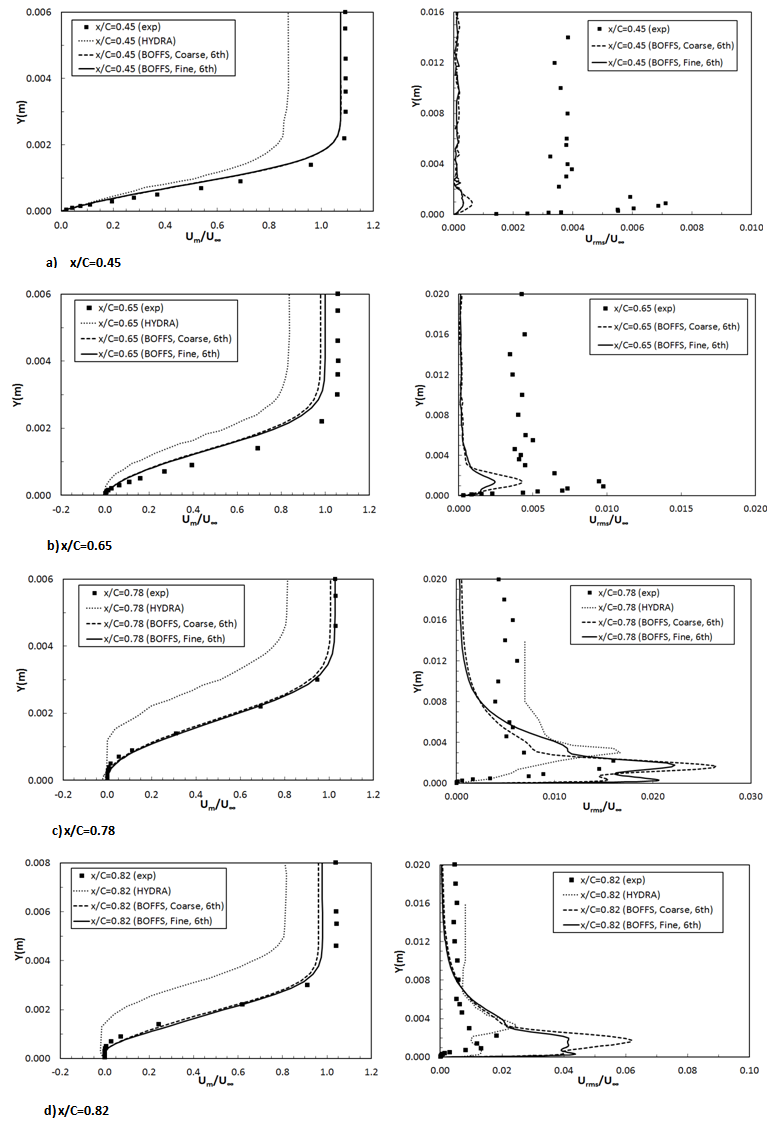 | Figure 7. Mean velocity and RMS velocity profiles at streamwise locations between x/C=0.45 and 0.82 |
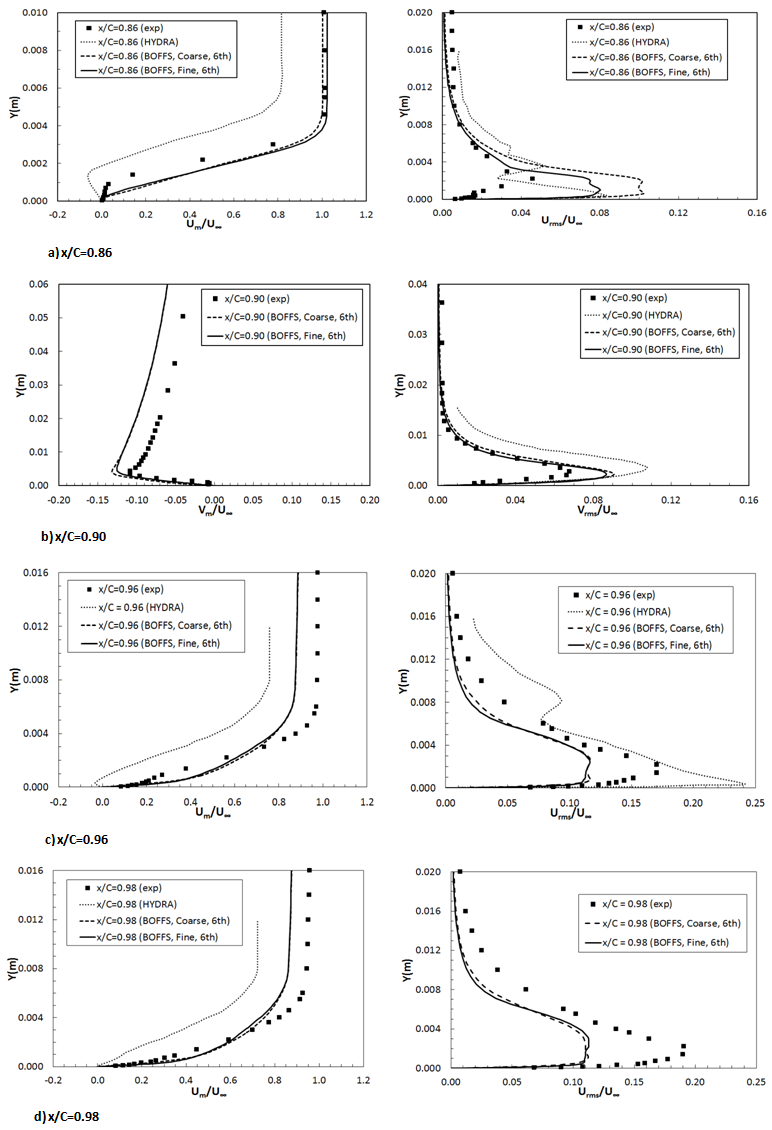 | Figure 8. Mean velocity and RMS velocity profiles at streamwise locations between x/C=0.86 and 0.98 |
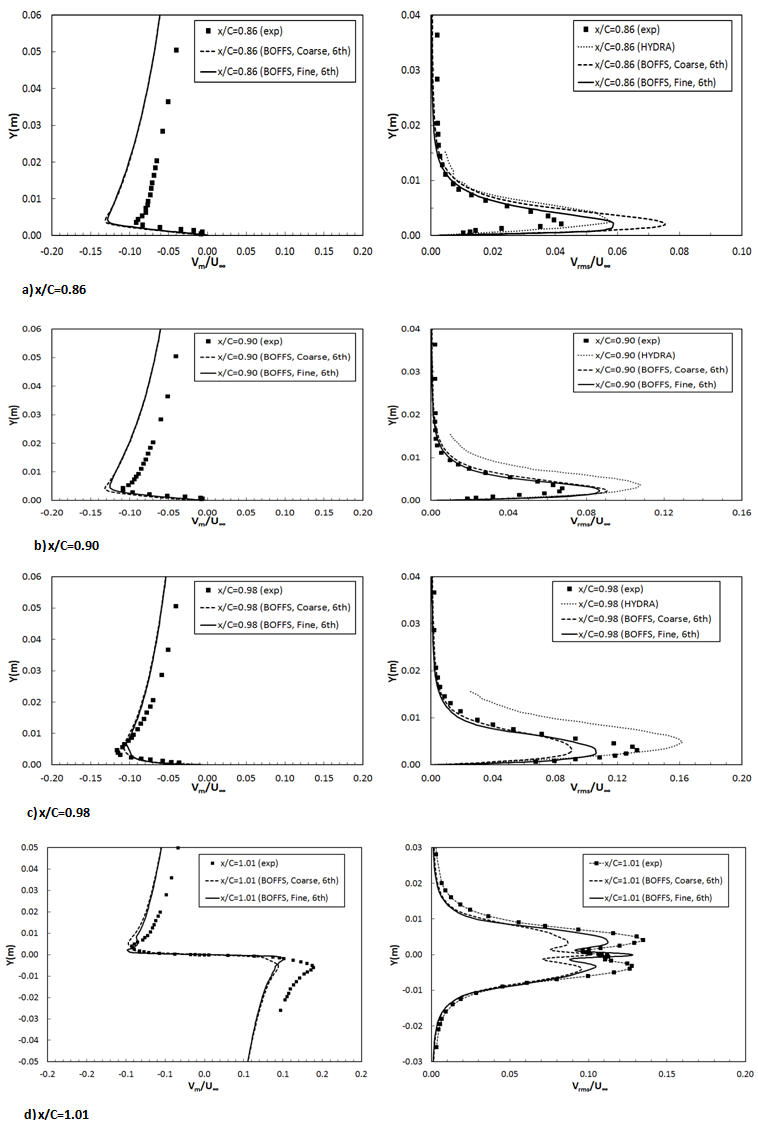 | Figure 9. Mean and RMS wall-normal velocitiesat locations between x/C=0.86 and 1.01 |
ACKNOWLEDGMENTS
- The author gratefully acknowledges the UK Engineering and Physical Sciences Research Council (EPSRC), who granted the research in this paper (QR/I01022X). The computer time was provided through the Cranfield High Performance Computing Facilities (HPCF). The authors would like to thank Prof. Tucker, Dr. R. J. Jefferson - Loveday, Y. Yang, and A. Al-Shabab for providing the BOFFS solver and technicalsupport. The authors are also greatly indebted to Dr. Tom Hynes for supplying the experimental data.