Luca De Filippis, Giorgio Guglieri, Claudia Ricco, Daniele Sartori
Department of Mechanical and Aerospace Engineering, Politecnico di Torino, Torino, 10129, Italy
Correspondence to: Giorgio Guglieri, Department of Mechanical and Aerospace Engineering, Politecnico di Torino, Torino, 10129, Italy.
| Email: |  |
Copyright © 2012 Scientific & Academic Publishing. All Rights Reserved.
Abstract
Space environment is inherently hostile and dangerous for astronauts. Since extra-vehicular activity (EVA) should be limited or assisted as much as possible, the significant role of robotic systems is of notable relevance. Tele-navigation of ground rovers in hostile and unknown environments is one of the applicable problems for modern planetary exploration missions. Pilots involved in these missions should be supported with intelligent and adaptive Human-Machine Interfaces (HMIs) able to guarantee a high level of situation awareness and an affordable mental workload. This paper aims to illustrate the approach used to design, test and assess a Remote Control Station (RCS) for ground missions. The RCS is used to remotely operate a 4-wheel drive scaled vehicle, representing a mini-rover for space exploration. The complete system includes the control station and the vehicle, all based on off-the-shelf components. The rover is used as a tool to assess operator’s situation awareness provided through the Graphic User Interface (GUI). This research activity is part of the project STEPS – a research project co-financed by Piedmont Region.
Keywords:
Human Robot Interaction, Human-Machine Interface, Graphic User Interface, Remote, Control Station, Situation Awareness, Tele-operation, Tele-navigation, Planetary Robotics
Cite this paper: Luca De Filippis, Giorgio Guglieri, Claudia Ricco, Daniele Sartori, Remote Control Station Design and Testing for Tele-Operated Space-Missions, International Journal of Aerospace Sciences, Vol. 2 No. 3, 2013, pp. 92-105. doi: 10.5923/j.aerospace.20130203.03.
1. Introduction
Tele-operation and tele-navigation[12] have allowed exploration of inhospitable environments, inaccessible or dangerous to humans. However, vehicle tele-control is generally problematic for users new to remote piloting and handling. Loss of situation awareness due to poor training, excessive mental workload and inaccurate interface design could bring to failure conditions and critical events such as collisions with undetected obstacles. Even when vehicles with autonomous capabilities and expert human supervisors are the mission agents, factors such as poor communications, malicious hazards and operator workload may still compromise the task achievement. Tele-operation projects the intelligence of the human operator in a displaced site, typically by means of a robotic system. Generally, tele-operated robotic systems mainly consist of a human operator, a Human-Machine Interface (HMI) and a remote robotic sub-system[10]. Human operator directly interacts with the HMI using interaction devices to control the remote robotic subsystem.Humans are characterized by every property that engineers and computer scientists dislike. They are substantially complex and their processes at every level are typically chaotic, unstable, non-linear, non- stationary, non-Gaussian, asynchronous, noisy and unpredictable. Nevertheless, operators still play a crucial role in missions where human agent interactions are required. The complexity of the human mind guarantees performance and adaptation capabilities incomparable with present autonomous robotic agents. Then human supervisory control further ensure that robot and mission run properly without endangering safety and task compliance. It is therefore vital that interfaces and dialogue functions of a HMI would ensure that operator situation awareness is full in all circumstances. In accordance with the mission requirements and complexity, operators will deal with nominal conditions and unexpected events. Furthermore, the human agent has to take decisions and perform actions that fall outside the framework of the regular procedures and directly influence the safety and availability of the installation. This means that the HMI should not be limited to the exchange of information between humans and machines but rather should be designed to interact with the operator ensuring safety and improving performance.Situation Awareness (SA) is the perception of environmental elements with respect to time and space, the comprehension of their meaning, and the projection of their status after some variable has changed. SA involves being aware of what is occurring in the vicinity to comprehend how information, events and one's own actions will impact goals and objectives; both immediately and in the near future. It has been hypothesized as a process that is separate from, but mutually dependent with other cognitive processes, such as: attention, perception, working memory, and long- term memory[8], taking place sometime prior to decision making and performance[6],[7]. Lacking SA or having inadequate SA has been identified as one of the primary factors in accidents due to human error. Thus, SA is especially important in work domains where the information flow can be quite high and poor decisions may lead to serious consequences. Several methods to measure SA are described in ergonomic textbooks andjournals[1],[9],[5],[6]. Seven major techniques have been identified and briefly described in[14]:SA requirements analysis: Endsley introduced this procedure in 1993[4] and it is still one of the most utilized and reliable techniques to measure SA. These set of analyses are based on interviews with Subject Matter Experts (SMEs), goal-directed task analysis and specific questionnaires.• Freeze probe techniques: The Situation Awareness Global Assessment Technique (SAGAT) is one of the most important freeze probe techniques[3] for many aerospace applications. While the task in running the simulation is randomly frozen and a SA-related questionnaire is provided to the user, the on-line nature of these techniques is their main advantage. Conversely, the task interruption is sometimes seen as a distraction.• Real-time probe techniques: These differ from freeze-probe techniques since the simulation is not frozen during the user interview. SMEs select specific questions that are administered to the user at the correct point of the task while the simulation is carrying on. Real-time probe techniques were developed to cope with the intrusion issues due to task freezing. However, specific questions can still trigger the attention towards relevant elements of the simulation and altering the test.• Self-rating techniques: These techniques are easy, cost effective and non-intrusive methods that allow the users to self-evaluate their SA, guided by specific questionnaires. Different approaches were developed by SMEs,collaborating with psychologists to tailor this approach on specific applications. Nonetheless, intrinsic uncertainties linked with self-rating evaluations affect sensitivity of this approach.• Observer-rating techniques: In these procedures SMEs evaluate users SA while they are performing the test. A five point rating scale (1=Very poor, 5 =Very good) and an additional ‘not applicable’ category can be implemented for each observable SA related behavior of the tester. The main advantage of this technique is its non-intrusive nature. However, extracting the right set of parameters observed during the test for the purpose of rating SA is not trivial.• Performance measures: In some tests it is possible to measure the user performance while he/she is accomplishing with the task and accordingly evaluate his/her own SA. If the test prescribes to drive a ground robot from A to B avoiding collisions, it is possible to measure the number of failures to extract the user SA. Judgment regarding the link between performances on the task and SA is not easily done. As a matter of fact, good performances accomplishment with the test do not guarantee adequate SA of the user during the test and vice versa.• Process Indices: In these techniques SA is evaluated studying the processes the user choos to acquire SA during the task. Tracking operator eye movements[13], enables the possibility to extract where his/her attention is fixed during the task and in turn, the elements that contribute to his/her own SA. In Verbal Protocol Analysis (VPA) the user is asked to express his/her thoughts while he/she is performing the task. Recording and analyzing this verbal stream enables the extraction of cognitive processes linked to SA.Cognitive-states measurement is an essential ingredient of Human Factors Testing and Evaluation[2]. Cognitive states, such as: mental workload, tiredness and pain, are subjective psychological experiences, and their temporary presence or absence cannot be readily quantified by objective means. Nevertheless, the aforementioned cognitive states can be operationally defined in terms of indirect measures (such as verbal reports) or through objectively measurable behavioral and psycho-physiological indices. Psychological and cognitive processes act on human perceptual-attitude (i.e. the attitude that leads to perception of stimuli and in turn promote SA) privileging more individual and social learning expectations than objective characteristics of the stimulus. According to this line of thought, the constitutive role of the perceiver than the percept is emphasized. Taking into account Gestalt-psychology principals that stress the importance of objective data in the process of perception (Gestalt psychology identifies in a set of “good-shape” rules the characteristics of an effectively-perceived object), perception of the emotional experience and individual motivation must be considered. Furthermore, motives and emotional states of the subject (both temporary and constant) have the effect of selectively raising the subject to objects related to his/her inclinations or aversions. In other words, the attitude perception is closely tied to the individual perception of life and to his/her personality as a whole in its conscious and unconscious aspects. Identical stimuli thus resulting in indifferent percepts as a function of cognitive and emotional expectations; what matters are ultimately the subject's expectations, his/her past experiences, emotions to the stimulus or its way of being in interaction with the world.Researchers continue to debate the nature of attention and its effect on the overall cognitive process[11]. Open problems are: a) Interaction with the attributes of objects and events being attended to, b) Whether it reflects the interaction of individually constrained cognitive resources, c) If attention can be considered the most appropriate theoretical model for cognitive workload. Mental workload is often seen as the quantity of cognitive or attention resource spent at a given point in time. SA can be regarded as the content of this resource, a subjective state that is afforded by the object or objects of one's attention. However there is not unanimous agreement in the psychological community on the underlying cognitive mechanisms responsible for the subjective state or on the parameters that can best evaluate the level of workload experienced or the SA possessed by an individual[2].
2. Present Work
In the present paper, the design and testing process of a RCS for a small ground rover is described. Two main subsystems compose the RCS: a) the Graphic User Interface (GUI) designed to improve the user SA while he/she is remotely controlling the rover, b) the input devices needed to control the rover. The robot controlled through the RCS is a small-size ground-vehicle electric powered and equipped with visual and ultrasonic sensors. The full system is developed to investigate new intelligent agents and HMIs able to support SA of a ground-rover pilot involved in planetary exploration missions. Subsequently, a new methodology to evaluate SA, obtained by fusing existing techniques and attempting to exploit advantages coming from different approaches is described. Relevance is given to the users piloting tests aimed at assessing the GUI capability in providing adequate situation awareness. A combined self-rating and observer-rating technique is applied during the test. Then SA requirements analysis is derived on the basis of “on the field” measures, providing suggestions and addresses for further design improvements.
3. System Layout
The Robotic Layer (RL) represented by the rover and the Graphic User Interface / Control Layer (GUI/CL) represented by the RCS are the main components of the system (also including the Human Agent).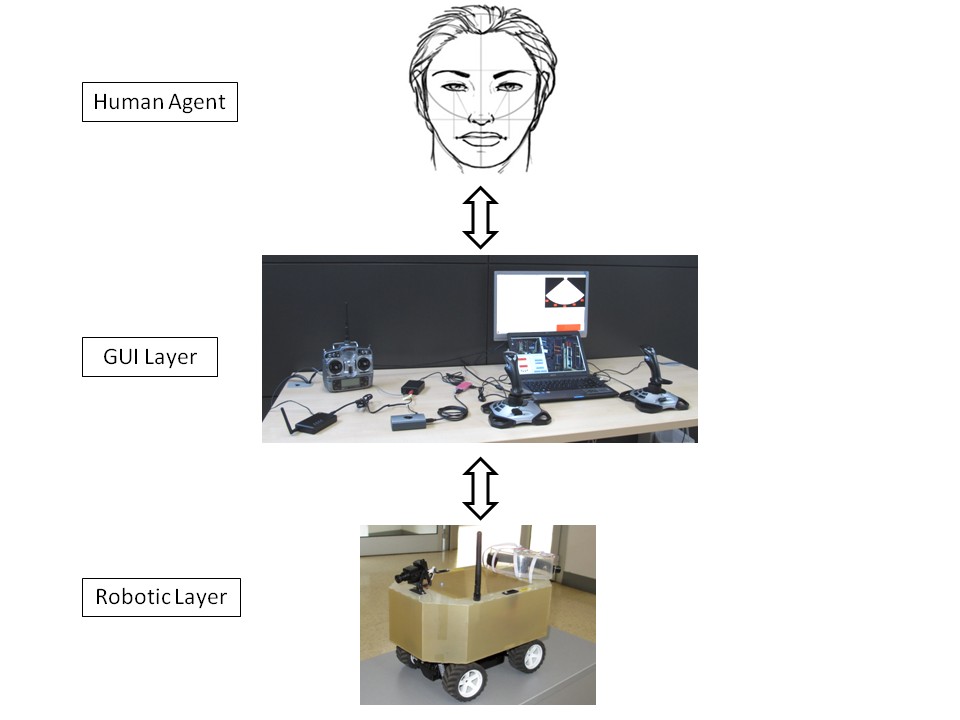 | Figure 1. The architecture of the system (components) |
The rover is a remotely controlled electric vehicle with a fiberglass body (the size is 30 cm in length and 20 cm in both width and height).A 420 lines CCD video camera is on the top front of the body and a pan-tilt system allows the user to orient the camera with +30°/-20° tilt and ±90° pan. On the rear side, an array of four ultrasonic sensors with 20° each of angular view is located. The rover is then equipped with a SiRF III GPS receiver able to track up to 20 satellites and with accuracy of 10 m (longitude-latitude). A 500 mW, 2.4 GHz transmitter sends video and telemetry (using digital data encoding broadcasted on the audio channel) to the RCS. The video signal comes from the camera while the audio includes the ultrasonic and GPS (in NMEA string format) data. Two NIMH (7.2 V, 2400 mA) batteries provide voltage supply for rover drive/steering and sensors (Figure 1).The RCS laptop runs the software to manage input/output signals from/to the rover and the GUI. The GUI is split on two screens: the 14” laptop screen and an additional 19” screen placed above the notebook. Two right-hand joysticks are used respectively to pilot the rover (throttle and steering) and to orient the camera (pan and tilt). The use of head trackers for cam control was checked in preliminary tests and found inappropriate. Video signal, ultrasonic sensors information and GPS position data are captured by a 2.4 GHz portable receiver. The analog video is sent to the frame grabber for digitalization, while the audio signal (containing NMEA strings and rear-obstacle distances), passes through a customized digital board and it is decoded using a Frequency Shift Keying (FSK) chip decoder. The same board converts joystick commands into proper Pulse Position Modulation (PPM) radio-transmitter signals. Figure 2 illustrates physical interconnections and data flow among the devices.The GUI has been implemented in C# (C sharp) computer language. Three libraries compose theGUI (Figure 3):• WPfApplication_RCS: This application is made of 24 files that manage the main GUI tasks including graphic windows and maps illustration, elaboration of GPS and ultrasonic sensors data, piloting of the rover, path planning and autonomous navigation.• WPFMediaKit: This kit is a library generally utilized to build DirectShow and MediaFoundation controls in WPF (Windows Presentation Foundation) and it also handles the video stream.• FerroLibrary: This library is developed in Visual Basic and handles the GPS link, ultrasonic sensors data and rover commands.
4. GUI Design
The GUI design process has been divided into three steps. Some preliminary concepts have been outlined trying to match mission requirements and budget limitations. Then, the RCS functional requirements (FRs) have been drawn up in order to describe every necessary function. Finally, GUI concepts and layout specifications according with the functional requirements were defined.A wide amount of the pilot SA, while driving the rover, is built on the perception of the environment. Sensor information and graphics are joined to provide to the pilot the correct feeling of space and time relative to the remote vehicle. As the visual perception is the most important stimulus to guarantee sufficient SA, a correct camera layout has to be envisaged. Other pieces of information are also needed to improve the pilot SA and in turn to reinforce the decision-making process. Moreover, the camera has been combined with an array of ultrasonic proximity sensors, utilized to detect the objects surrounding the rover, improving collision avoidance. The way to represent the information provided by these sensors has been studied with aims to design graphics able to trigger quick and effective pilot reactions. On the other hand, display of coordinates for the rover’s current position within the mission area is a vital aspect in tele-navigation, particularly when the rover is operated in hostile environments. Rover and target positions, speed indication and relative displacement from/to a desired path or waypoint sequence need dedicated and sufficient space in the interface, representing key features for navigation. Additionally the operator requires a set of data related to the rover status that in turn provides SA on the vehicle operability in normal conditions and in case of subsystems malfunction.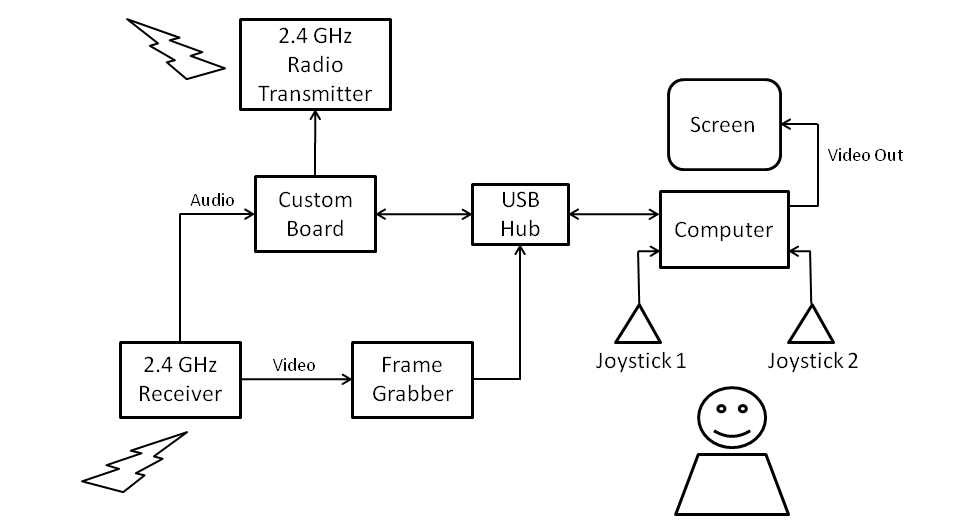 | Figure 2. RCS architecture (data flow for the ground control segment) |
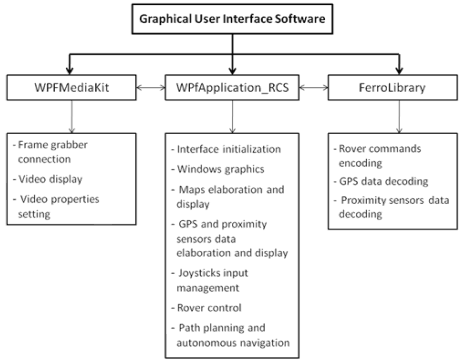 | Figure 3. RCS software main functions |
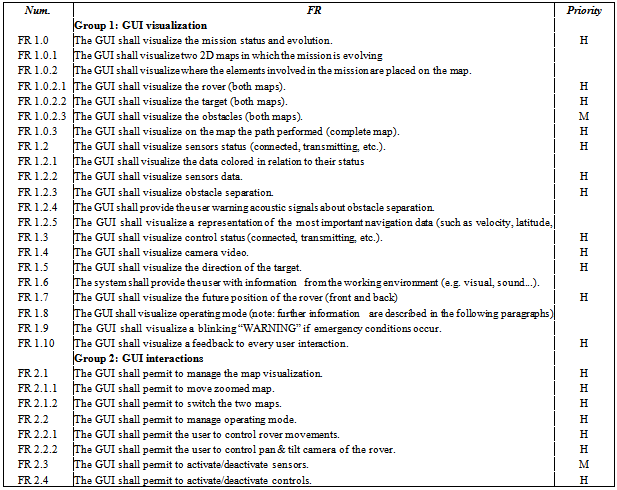
Table 1. GUI FR extract for visualization and interaction requirements
 |
| |
|
The first design process has been performed listing the GUI FRs according to two rules: FRs should be verifiable and words of ambiguous interpretation should be avoided (Table 1). Priorities have been assigned using a pre-defined approach:• H = high (the scenario is not possible without it);• M = medium (the scenario may lose some key features);• L = low (it is pleasant to have).The FRs definition allows expressing in details the key features of the interface, providing to the designer a hierarchical vision of the functions accomplished with the GUI.With the second design phase FRs have been translated into the interface main structure and elements. The GUI has been divided in two screens globally composed by eight blocks. The first screen (Figure 4) supports the rover navigation while the second (Figure 5) is dedicated to information needed to operate the vehicle.A considerable part of Screen-1 is dedicated to the maps of the mission area. A smaller and detailed portion of the area around the rover is represented on the right in Figure 4 while the global mission area is shown on the up-left section of the screen (in the predefined GUI configuration). Two set of graphic interface tools are placed under the global map (on the bottom-left corner in Figure 4). The first provides information about the sensors status (GPS and ultrasonic range sensors) and the second indicates the rover operative mode.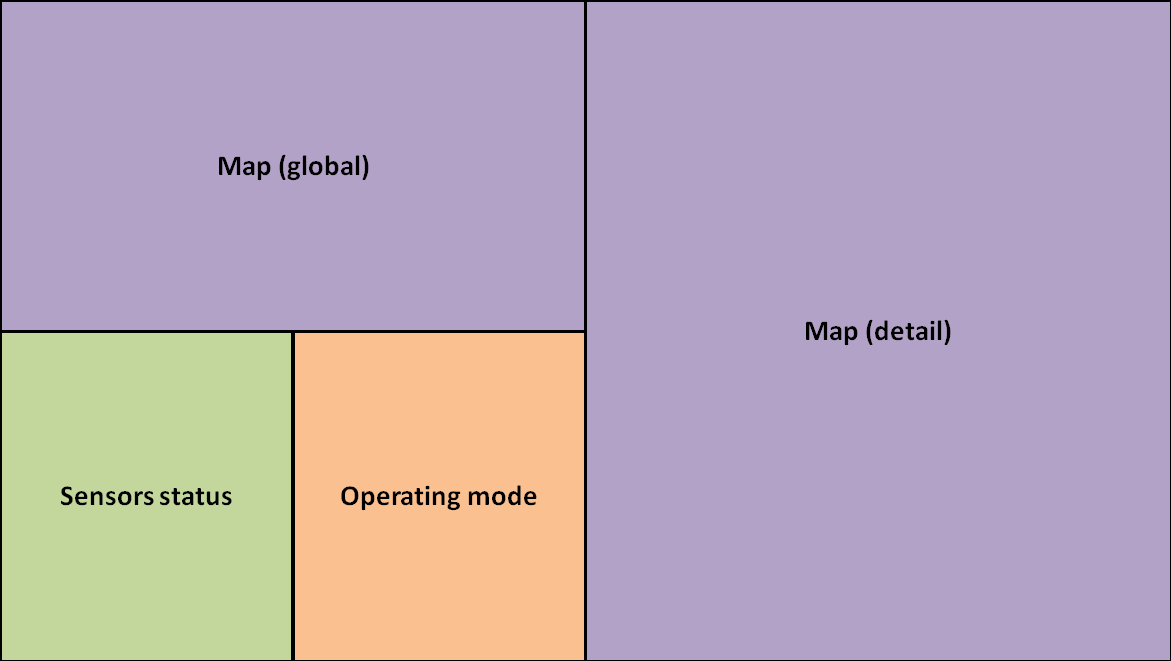 | Figure 4. Screen-1 layout |
Screen-2 mainly addresses pilot tele-navigation. The video stream from the camera is on the left while the right side of the screen collects the collision avoidance graphic tool (i.e. the graphic representation of the ultrasonic-sensors data) and the speed indicator. Finally the bottom bar on Screen-2 collects other sets of data (Figure 5).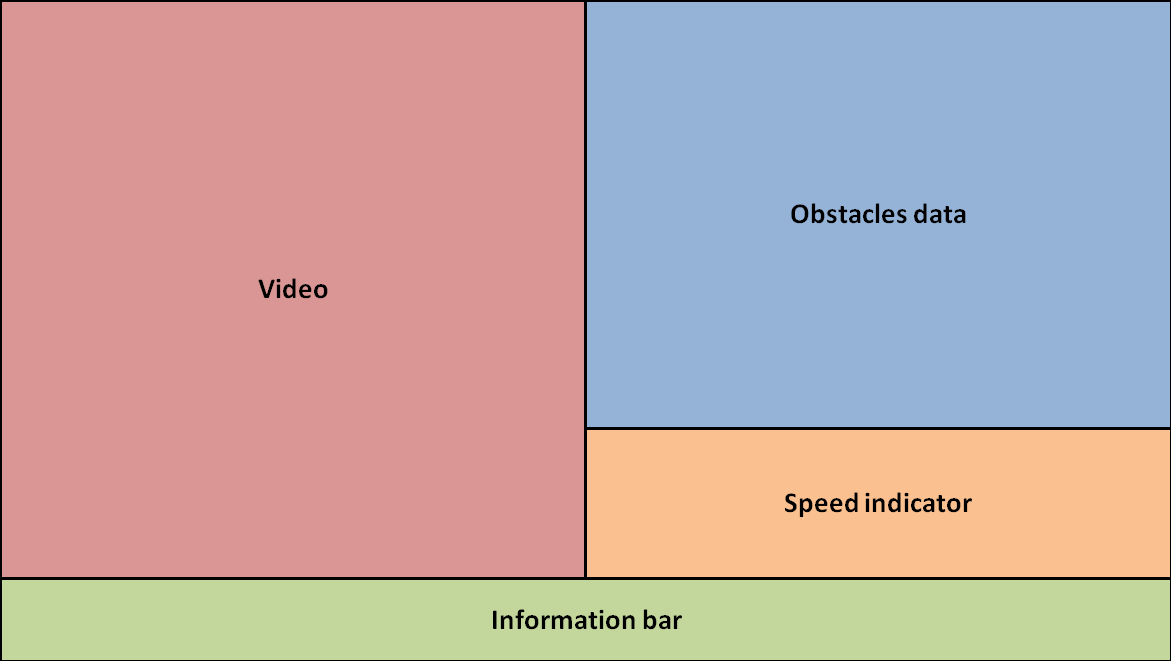 | Figure 5. Screen-2 layout |
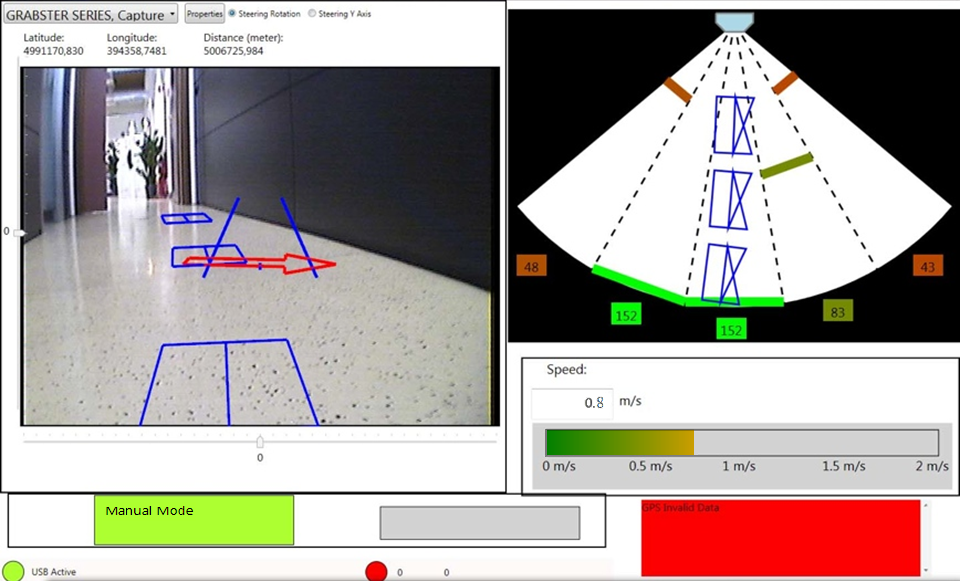
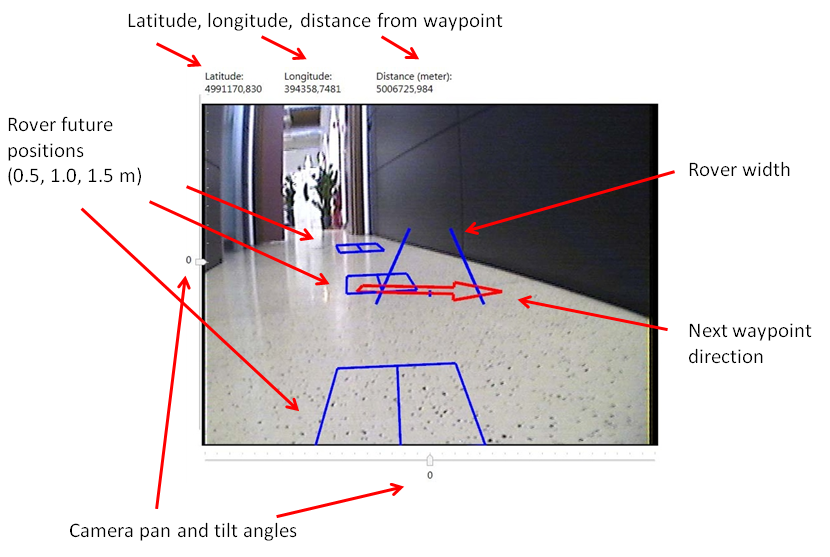
The main structure of the GUI have been refined with other elements needed to support the pilot’s SA. A dedicated button (the yellow arrow in Figure 6) has been introduced to revert the two maps on Screen-1. The maps have been introduced to represent the rover position to the pilot but also to provide a tool to interact with the navigation system in order to define waypoint sequences that compose the desired rover path. As a matter of fact travelling through the map geo-referenced coordinates appear near the mouse pointer, then new waypoints (red circles in Figure 6) are defined clicking on the map. The rover path already planned by the user is represented with black circles, while the rover current position and heading are rendered by an orange dot with a blue arrow in the direction of motion. The operating modes are selected through five buttons and they are divided in three subgroups: Navigation, Camera Point of View (PoV) and Exploration. Under Navigation, the Move-Camera button allows the user to move the camera (initially locked) while piloting the rover. The Autonomous button triggers the autonomous navigation mode when a path has been defined. If Follow-Steering is selected in the Camera PoV section, the camera rotates autonomously at the same angle as the wheels. If the Follow-Direction option is selected, the camera is instead pointed towards the future direction of the rover (aiming at 1 m distance). Finally, the Only-Camera button is utilizied to move the camera when the rover is still and the piloting control is locked. If one of these functions is turned on, the button turns orange and it goes back to the original color when the function is off. The Sensor-Status frame has two indicators respectively for GPS and ultrasonic sensors. The green color means that the corresponding sensor is working properly, while the red one indicates that the sensor is not supplying the correct set of information.To improve the pilot awareness about the rover’s current and future position and displacement, the video stream on Screen-2 is overlaid with three graphic functional tools: A red arrow that points to the next waypoint of the desired path and two blue lines indicating the rover width and three rectangles forecasting the rover future position at 0.5, 1.0 and 1.5 meters from the current one (Figure 7). The rectangles slide on the screen according to the steering angle marking on the ground the future rover path of over a 1.5 m in the horizontal direction. On the left and under the video frame, two indicators (numerical and scrolling-arrow) show the camera attitude through the pan and tilt angles with respect to the nominal orientation. The rover position and the distance from the next waypoint is represented in the upper corner of the video frame (Figure 8).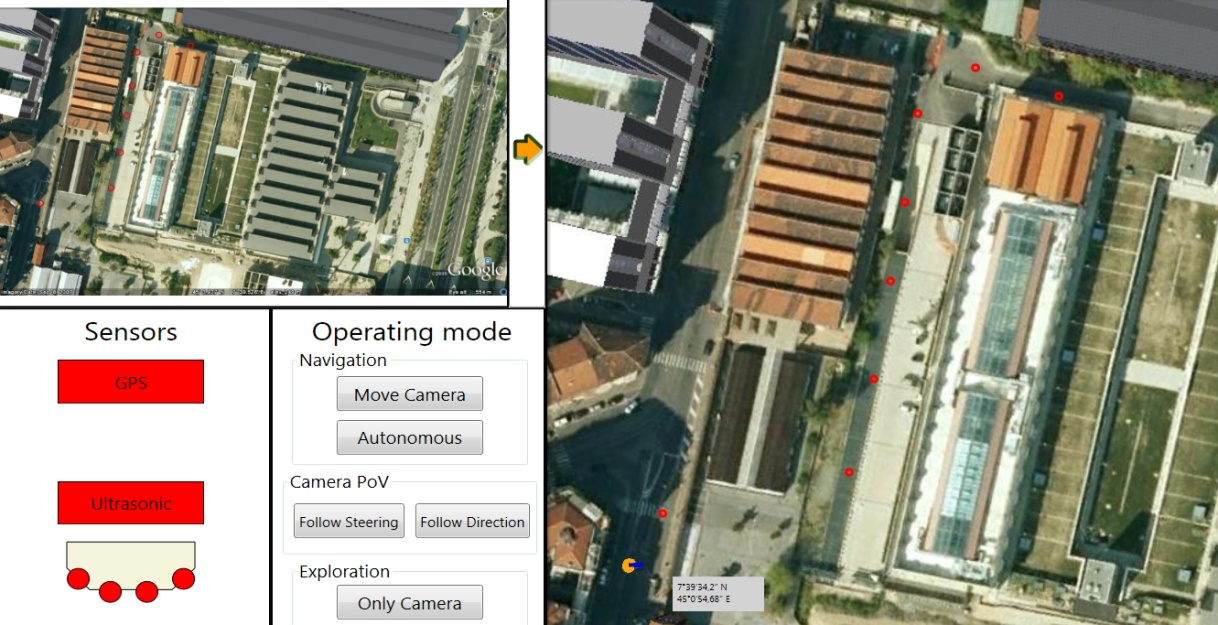 | Figure 6. Screen-1 implementation |
 | Figure 7. Screen-2 implementation |
 | Figure 8. The video stream |
 | Figure 9. Proximity sensors signals representation |
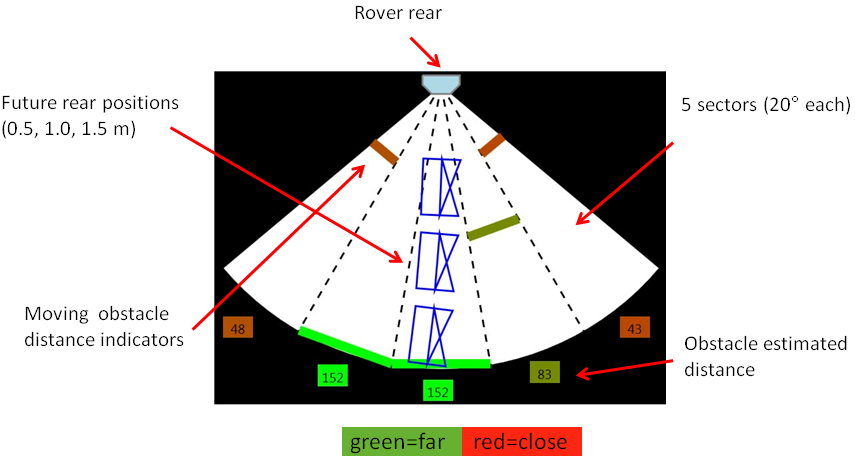
The collision avoidance graphic tool is next to the video (right side) and it is linked to the ultrasonic sensors placed in the rear part of the vehicle. It indicates the proximity of obstacles behind the rover, where the camera cannot be panned. Despite the fact that a preferable position would be under the video frame, the screen slender aspect ratio enforces this specific location to maintain an acceptable size and readability of both the graphic tools. The sensing system is an array of four ultrasonic sensors whose detection beam is overlapping to create five sections, each covering a 20° angle. For each of the slices, a sliding bar represents the obstacle distance, ranging from 0.00 m to 1.50 m (no obstacle detected). The bar changes color according to the distance. Red color stands for contact, green for free space and all the colors in between vary accordingly. A colored square with the estimated distance is under each section. Three blue rectangles representing the rover’s future positions overlay, sliding in the same way as in the video frame (Figure 9). Acoustic alarms (beeps) were also implemented to warn the pilot for proximity to rear obstacles or other malfunctions.The speed indicator displays the data in coherent units and on a colored bar with tick marks positioned under the collision avoidance graphic tool. The color ranges from green for 0 m/s up to orange for 1 m/s (note that this is the maximum speed allowed for the rover). The bottom bar of Screen-2 collects indications about the sensors data stream (GPS and ultrasonic sensors), in addition to the current operating mode and the USB connection to external devices.
5. Testing Activity
The SA-assessment has been performed through a methodology obtained by exploiting the features of known and solid techniques. As a matter of fact, a user questionnaire to self-rate SA has been defined by SMEs and a psychologist working collaboratively to improve the test reliability. Furthermore, an observer questionnaire has been developed with aims to provide an external and more objective view on the user performance during the tests. Finally, all the results have been analyzed by a different team of SMEs and a psychologist in order to assess the SA requirements.The tests have been performed by few testers who have never seen the GUI layout and the RCSuntil the actual test day. The testers were asked to operate the rover with the accomplishment of two tasks in mind:• A navigation trial along a butterfly pattern path (Figure 10),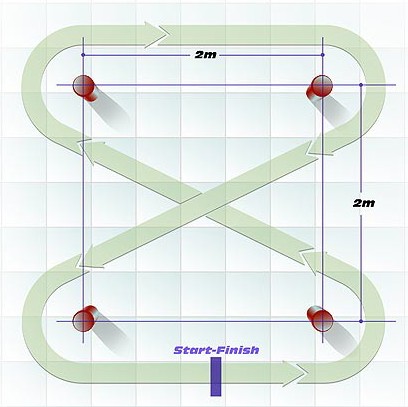 | Figure 10. The test-1 butterfly pattern path |
• A recovery maneuver (in and out of a trap).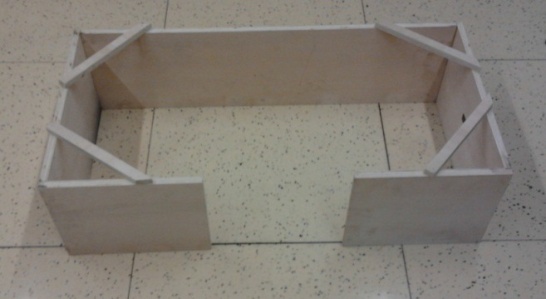 | Figure 11. The test-2 trap |
The butterfly path is defined just with the turning points (orange skittles in Figure 12). No guideline has been drawn on the floor, just an external square boundary has been marked out to suggest the maximum turning radius admitted around the skittles.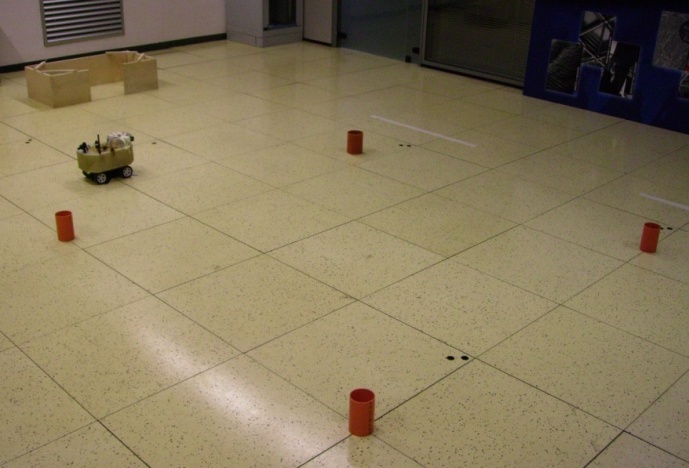 | Figure 12. The butterfly path defined with 4 skittles |
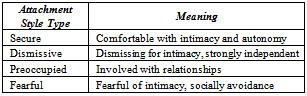
The trap task is a pretty indeed demanding exercise. The trap has been placed at the end of the butterfly path and consists of a box (Figure 11) 90 cm long, 50 cm wide and 30 cm high. On one of the longer sides a 30 cm entrance has been placed. The user is expected to enter and exit the trap moving forward and backward. Because of the reduced box dimensions compared to the rover size (20 x 30 cm as a projected form), the user must carefully maneuver inside the trap.A few minutes before the test is initiated, each user is provided with the means to observe the path and the trap. During the test a failure of the navigation system has been simulated. This compromises of the reception of GPS data and in turn a freezing rover position on the map. This forces the user to only rely himself/herself on the visual and audio information provided with the interface. The two tasks are then performed three times, once for each camera control mode: a) manual control with joystick, b) camera follows rover steering, c) camera follows rover direction. Each test is completed when the vehicle returns to the start point.The six chosen users have not been involved in the design process of the system and they have been selected according to age (25-45 years) and experience (video-gaming or radio controlled recreational vehicles piloting). People belonging to the 25-34 years interval have been marked as 1, while the group from 35 to 45 years as 2. Basic knowledge of radio-controlled models or gaming simulators was required, but no training was provided for the users. They received an overview about the RCS and the GUI, while the tasks and the details about the three camera modes were fully described. The users performed the test independently and they did not get in contact with each other during and after the tests. Since the number of users involved were limited, there was not enough ground to initiate statistical analysis with respect to the results. This is acceptable as the primary purpose of the test was the SA-assessment technique.Before the test, a psychological questionnaire was submitted to the users to set their attachment style. As a matter of fact, this was partially done to investigate the attachment style influence on the task performances. The four attachment styles reported in Table 2 were considered and 2 users resulted dismissive while 4 were outlined as secure.Table 2. Attachment styles
 |
| |
|
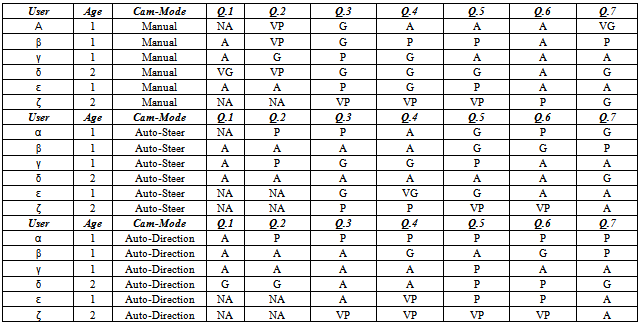
Secure attachment reveals warm and confident interactions in relationships. These subjects have positive views of themselves and their respective partners, and they feel comfortable both with intimacy and independence. Dismissive attachment style presents lower attitude for emotional involvement. Usually, these subjects have experimented in many situations the difficulty of approaching the attachment figure. They have learned gradually to leave their experiences behind and to focus on a “lifeless-world” rather than on other people. These subjects behave as if others (intended as a person with significant affective level) do not exist, i.e. in their experience the correct development of “connection-type” based on mutual trust is non-existent. Considering the cognitive level, this attachment style behaves with a certain degree of autonomy, since they cannot identify any type of invalidation by the others.At the end of every test, personal-feedback on SA has been evaluated through the filling out process of the following questionnaire:• Q.1: Was the content of the operating mode panel perfectly understandable?• Q.2: How exhaustive was the information about failure occurring in the system?• Q.3: Was screen 1 correctly supporting the remote handling of the rover and providing adequate situation awareness?• Q.4: What was your perception about the vehicle’s position, speed and acceleration?• Q.5: What was your perception about separation from the obstacles?• Q.6: What was your perception about the rover’s future positions (both rear and front)?• Q.7: How satisfactory was the delay between the given command and user interface implementation?The possible answers in this questionnaire were as follows: not applicable (NA), very poor (VP), poor (P), average (A), good (G), very good (VG). Results for all tasks have been summarized in Table 3.Table 3. Self-rating results
 |
| |
|
Table 4. Observer-rating results
 |
| |
|
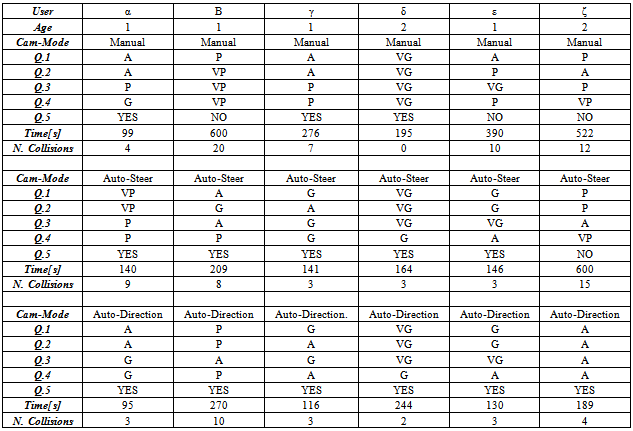
Each test was monitored by an observer (i.e. an SME involved in the RCS design). After each test the observer completed the following questionnaire assessing the user performance:• Q.1: User detection of vehicle position and speed.• Q.2: User detection of vehicle distance from obstacles.• Q.3: User ability to drive with minimum cross-track error or drive straight.• Q.4: User ability to handle obstacle avoidance (trap).• Q.5: Trial completed (return to start in less than 5 minutes).Additionally, test duration and the number of collisions were also recorded. These parameters were used to assess the user mental workload and SA provided with HMI (Table 4).A trial run with a two seconds video-delay (similarly to the communication delay between Earth and Moon) was also performed by an expert-user (incidentally the observer). In this case, the expert refers to user who masters the RCS system perfectly (the tester was not involved in any other previous experiments). The tester completed the task in less than five minutes with some collisions with the trap walls. However, the user was substantially unable to drive with a minimum cross-track error. In addition, the user’s workload was quite unacceptable (as described by the user’s comments). As a consequence, the importance of providing the user with a real time synchronous video should be emphasized.
6. Analysis of Results and Comments
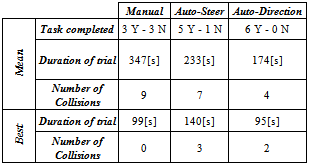
An external team of two analysts, including a psychologist, finally elaborated on the questionnaires. Initially, it is possible to define a link between the attachment style and the performance accomplished during the tests. Data recorded by the observer indicates that testers with dismissive attachment style caused a lower mean number of collisions (3 against 8) and completed the test faster (180 seconds compared to 270 seconds) than testers with secure attachment style. This can be explained because dismissive testers present a lower attitude for emotional involvement and manage to better handle the stress induced by workload.Answers to the observer questionnaire suggested the camera mode that seemed more suitable for piloting the rover. Table 5 summarizes the results including the mean and best achievements. An improvement in the performance is clearly visible when the camera orientation is assisted. The auto-direction mode is preferable as it reduces the mean achievement time and the mean number of collisions.Table 5. Camera mode analysis
 |
| |
|
Table 6. Overall HMI evaluation
 |
| |
|
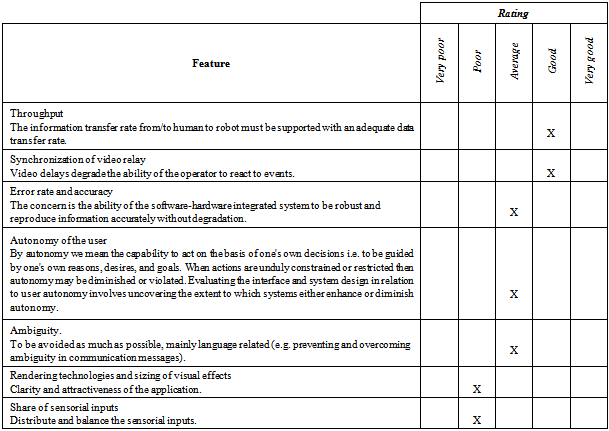
Difficulties in completing the tasks with manual mode are due to the mental workload linked with the divided attention between rover steering and camera pointing. Only three users were able to complete the task in the manual mode, and according to the observer ratings these were the most experienced testers (recreational drivers). These results were supported by the self-rating answers where theauto-direction mode has always been preferred.Some observations of the GUI layout analyzed the user ratings, where improvements for the current layout were suggested. The users found it difficult to evaluate the rover width and its lateral surroundings. Then collision avoidance graphic tool was suggested to be moved under the video in order to increase the SA and the focus attention span. The lack of training caused the users to underestimate some RCS graphic tools, such as the rover’s future position indicators. Other factors, like the joystick power and steering, were used with a lack of confidence and hence a re-mapping of the joysticks have been suggested.Finally, the team of analysts produced an additional evaluation table (see Table 6) to assess the overall quality of HMI design (using the detect, understand and respond approach as a reference).
7. Concluding Remarks
The purpose of the current research activity was the assessment of the design concepts implemented in a Remote Control Station (tech-demo RCS) used for the tele - navigation of a 4-wheel drive scaled vehicle (equivalent to a mini-rover used for planetary exploration) equipped with wireless proximity devices, navigation sensors and video broadcast. The enhancement of the SA for the user (remote pilot) is the focus of the design process.A user-experience low cost physical prototype of the complete system including the control station and the vehicle (based on off-the-shelf components) was experimented and tested for hardware and software integration.• The following functions were implemented and successfully tested:• pan-tilt video cam control for the primary video channel by tracking of both hand, vehicle’s steering, vehicle’s direction and head displacements (abandoned);• map display and navigation (based on GPS and motion track estimated from incremental odometry);• obstacle detection alarm (based on proximity sensors);• manual remote radio-frequency control (controlled by joysticks);• link with a supervisory executive layer (external to RCS);• short range autonomous drive (waypoint-to-waypoint navigation).The use of head trackers for cam control was checked in preliminary tests and found inappropriate.A Graphic User Interface based on an open source re-usable re-configurable software library was developed in C# programming language. The software library was tested and verified for implementation stability.The user test performed to assess the advantages and drawbacks of the RCS system were extremely productive, providing hints and guidelines as a result of the testing activity.Improving the GUI arrangement: The Graphic user interface is the core part of the RCS system because it is the informative “kern” where user inputs and system outputs are matching with the purpose of providing the user with the adequate situation awareness. A few elements in the interface need to be better displayed and/or redefined. In detail:• Screen 1 should be wider allowing a more intuitive access of the graphic elements displayed by• the GUI. The new layout should be more intuitive for providing a more effective localization of the information (see figure below). The video from the rover cam should be displayed at the top (information coming from the front of the rover). The obstacle sensors panel should be visualized at the bottom, as this is information coming from the rear of the rover. The speed indicator is arranged with the same direction of the throttle (equivalent vector). The colored elements (red, green and blue) should indicate the current system status appearing only when required.• The operating mode panel should have an unambiguous design (eventually using animations or active icons).• The faults of the system (and/or traps) should be displayed in a way to avoid user’s erroneous readings (enhance his knowledge of the vehicle current status and future states).Enhance the balance of the sensorial information; To provide the user with an adequate level of SA (vehicle’s status). It is extremely important to efficiently use the human senses and to avoid overloading the user’s sensory channels. According to testers' comments, the GUI should better manage the information screened. Mainly, the critical elements in this case are: The information concerning obstacle separation and the information regarding faults alarm. For the first item, a possible solution is to shift or share the information with a second unused channel. Currently, a beep sound is implemented to give the user the perception of the obstacle, but the results were not enthusiastic according to users’ opinions. A stereo sound could help to overcome the limitation, in order to use a second sensory channel to detect more efficiently the obstacles’ relative positions. For the second element, the GUI should display system faults only when a failure actually occurs or possibly utilize animations that can capture the user’s attention. In this way, the user can concentrate on what has happened and on understanding the system status and vehicle’s handling limitations.Provide real-time information: It is very important to enforce real-time information to the user. A separate set of experiments was performed with delayed video broadcast and the user was unable to complete the assigned task with an adequate performance rating. The current RCS system works fairly well with regards to this issue. However, the system could still become more efficient:• Optimization of software: It is very important to handle the CPU of the host computer appropriately. In the case that the code is too complex, delays could possibly degrade the synchronization or the continuity of video and data stream broadcasted from the rover.• Use robust communication: To avoid that external disturbances or interferences can degrade the system communications hardware upgrade should take place along with software protocols).Improve remote controller settings: To allow the user to drive safely with the possibility to carry out the control of the vehicle without the need to wiggle or fidget:• Reduce minimum wheel speed in-rush: The current value of 0.5 m/s is too high because the user cannot execute good command tracking when the close range is reduced. The value could be assessed between 0,20-0.30 m/s.• Reduce the remote controller null-action: The handling of the vehicle should not be compromised by an extended range of control insensitivity for small stick displacements.• Shift the cam assembly backwards and upwards (to be tested): Following this procedure, the cam field of view could also include the profile of the vehicle, enhancing the perception of steering (cam would be behind the center of rotation) and the lateral clearance from obstacles.Once the interface is upgraded, the system should be re-tested by a larger number of expert users with a coherent grade of system training.The users should be able to carry out more difficult tasks, including relevant system failures and/or emergency maneuvers. The transition from autonomous navigation to manual control should be also investigated (from computer – in - command to pilot-in-command).Advanced tests could be addressed to compare and tune the command settings. As an example to evaluate if it is better to steer the wheels through a rotation along the joystick x-axis (roll) or better yet through a rotation along the z-axis (yaw).A demonstrative procedure for the analysis of user trials based on subjective and objective ratings of the operator’s SA was assessed. This procedure is based on the acquisition of ratings from a set of users (testers) and a team of observers. The analysis of the procedure, adopted for the acquisition and elaboration of data (tester and observer evaluations), suggests that the following concepts should be enforced in future experiments of similar endeavors:• The observer should not interact with the project team and he/she should not be related or in contact neither with the testers nor with the designers;• A possible method to physically separate the observer from the test field could be the submission of registered movies or data streams after the test run;• A complementary observer or a team of observers could enhance the validity of the objective performance ratings;• The testers should not be observed by anyone during the filling of test forms or influenced by either external factors or persons in the definition of ratings (to prevent the leveling to “average” of ratings);• The tester must be completely anonymous and the assessment of his/her performance must not be traced or associated with any of the test users;• The tester should be “emotionally” free to operate the rover during the trial (no constriction of the tendency to fail, to abort or to repeat a subtask as many times as required);• The test should be performed in absolute silence (without external comments on the performance of the tester);• The ratings provided by the different testers should be weighted for their ability or level of experience (using a scaling multiplier).
ACKNOWLEDGMENTS
The authors wish to acknowledge the invaluable technical support given by Mr. Manuele Bommarito and Mr. Danilo Mazza.
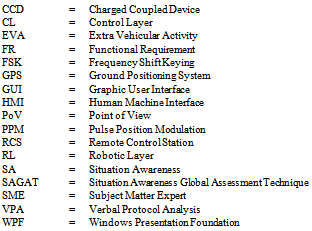
Acronyms
References
| [1] | AGARD (1990). Situational Awareness in Aerospace Operations. AGARD CP-478. |
| [2] | Charlton, S., G. and O’Brien, T., G. (2002). Handbook of Human Factors Testing and Evaluation. Lawrence Erlbaum Associates Publishers, Mahwah, USA. |
| [3] | Endsley, M. R. (1988). Situation Awareness Global Assessment Technique (SAGAT). Proceedings of the National Aerospace and Electronics Conference (NAECON), IEEE, New York, USA, 789-795. |
| [4] | Endsley, M. R. (1993). A Survey of Situation Awareness Requirements in Air-to-Air Combat Fighters. International Journal of Aviation Psychology, 3(2), 157-168. |
| [5] | Endsley, M. R. (1995a). Measurement of situation awareness in dynamic systems. Human Factors, 37(1), 65–84. |
| [6] | Endsley, M. R. (1995b). Toward a theory of situation awareness in dynamic systems. Human Factors, 37(1), 32–64. |
| [7] | Endsley, M. R. (1996). Situation Awareness Measurement in Test and Evaluation. in T. G. O'Brien and S. G. Charlton (Eds.), Handbook of Human Factors Testing & Evaluation, Lawrence Erlbaum Associates Publishers, Mahwah, USA, 159-180. |
| [8] | Endsley, M. R., (2000). Direct measurement of situation awareness: Validity and use of SAGAT. Situation awareness analysis and measurement. Lawrence Erlbaum Associates Publishers, Mahwah, USA. |
| [9] | Endsley, M. R., Sollenberger, R. and Stein, E. (2000). Situation awareness: A comparison of measures. Proceedings of the Human Performance, Situation Awareness and Automation: User-Centered Design for the New Millennium, Savannah, USA. |
| [10] | Fong, T., Thorpe, C. and Baur, C. (2001). Advanced Interfaces for Vehicle Tele-operation: Collaborative Control, Sensor Fusion Displays, and Remote Driving Tools. Journal Autonomous Robots 11(1), 77-85. |
| [11] | Kantowitz, B. H. (1985). Channels and stages in human information processing: A limited analysis of theory and methodology. Journal of Mathematical Psychology 29 (2), 135–174. |
| [12] | Siegwart, R. and Nourbakhsh, I. (2004). Introduction to Autonomous Mobile Robots, Bradford Book, MIT Press, Cambridge, USA. |
| [13] | Smolensky, M. W. (1993). Toward the physiological measurement of situation awareness: The case for eye movement measurements. Proceedings of the Human Factors and Ergonomics Society, 37th Annual Meeting, Human Factors and Ergonomics Society, Santa Monica, USA. |
| [14] | Stanton, N., A., Salmon, P., M., Walker, G., H. and Green, D. (2006). Situation Awareness Measurement: A Review of Applicability for C4i Environments. Applied Ergonomics Press, 37(2), Pergamon Press, Oxford, United Kingdom, 225-238. |
 Abstract
 Reference
 Full-Text PDF
 Full-text HTML