-
Paper Information
- Paper Submission
-
Journal Information
- About This Journal
- Editorial Board
- Current Issue
- Archive
- Author Guidelines
- Contact Us
International Journal of Aerospace Sciences
2012; 1(2): 8-15
doi: 10.5923/j.aerospace.20120102.01
Facts of Piezo Impedance Technique in Crack Propagation Studies for an Engineering Structure
 Abstract
 Reference
 Full-Text PDF
 Full-Text HTML
Venu Gopal Madhav Annamdas
Division of Engineering Mechanics, School of Mechanical and Aerospace Engineering, Nanyang Technological University, 639798, Singapore
Correspondence to: Venu Gopal Madhav Annamdas , Division of Engineering Mechanics, School of Mechanical and Aerospace Engineering, Nanyang Technological University, 639798, Singapore.
| Email: |  |
Copyright © 2012 Scientific & Academic Publishing. All Rights Reserved.
In the last two decades, consciousness of structural health monitoring (SHM) has increased many folds especially after witnessing some aerospace/ aircraft failures. Subsequently many SHM techniques have emerged for crack detections. This paper presents one such technique to monitor a crack using piezoelectric transducer (PZT) via electromechanical impedance (EMI) technique. The basic principle of EMI is to record electromechanical (EM) admittance signatures resulted from the actuations of PZT (bonded on structure to be monitored) in the presence of electric field. Any deviations in these signatures during the monitoring study indicate disturbance/ damage/ crack (for a healthy structure) or increase in severity (if crack/damage is already present). In practice, the occurrence of ‘crack’ and its ‘propagating direction’ are equally important. In this paper, basic crack propagation studies on two metallic beam specimens using EMI are presented. Two PZT transducers, one each was bonded on each specimen. First a small crack was induced at different locations on both specimens, it was allowed to propagate in steps (cracks approaching PZT in one specimen and departing in another). Signatures were acquired for un-cracked and cracked propagation stages. Root mean square deviation index was used to demonstrate the experimental observations related to identification of crack propagating directions. Numerical modal analysis was carried out to understand the shifts in modal frequencies during crack propagation. The existence of crack was successfully predicted by EMI but the propagation of crack was not readily obtained. Hence a signature analysis was carried out to predict the propagation direction. It has been a practice to highlight positive sides of any technology, but limitations of EMI are also discussed in this paper and hence the study is expected to be useful for new and existing researchers in the area of EMI based SHM.
Keywords: Monitoring, Damage, Root Mean Square Deviation, Electromechanical Impedance (EMI), Crack, Steel, Propagation
Article Outline
1. Introduction
- Consciousness of structural health monitoring (SHM) of either metals or non metals has increased many folds in the recent times. Subsequently many SHM techniques have emerged to monitor the condition of structure to find out crack / instability at earlier stage of occurrence. The most common SHM techniques are visual inspection, low frequency vibration techniques, statistical structural response techniques, localized non destructive evaluation (NDE) techniques. However, the recent advent of smart materials based sensors has given rise to new classification of SHM i.e smart materials based monitoring techniques. There are many smart sensors like fiber optics (FOS), polyvinylidene fluoride (PVDF), micro fiber composites (MFCs), piezo-electric polymers and ceramics, electro-rheological (ER) fluids, magnetostrictive materials and shape memory alloys (SMA). But the piezoceramic transducers (PZTs) and MFCs, which are ‘sensors and actuators’ are accepted as key contributors in noise and vibration control[1- 3]. Its application in electromechanical impedance (EMI) technique[4] is also accepted as one of the latest monitoring tool for engineering structures[5-10]. In the EMI technique, the PZT or MFC transducer is either surface bonded on or embedded inside the host structure. The governing principle is that the transducer actuates harmonically in the presence of electric field to produce a structural response, which is known as electromechanical (EM) ‘admittance signature’. The EM admittance signature is a function of the stiffness, mass, damping of the host structure[4], the length, width, thickness, orientation[11], mass[12–13] of the transducer, and the adhesive[14]. The ‘changes’ in the EM ‘admittance signature’, which is the inverse measure of mechanical impedance of the structure are indicative of the presence of structural ‘damage’. In the past decade, many researchers have developed EMI models to describe the interaction between the transducer and the host structure for SHM. Subsequently many experimental studies were conducted to verify these models. This present study provides one such study were the experiments were compared with numerical and statistical based methods. The objective addressed in this paper is to monitor progressive crack (on surface of metallic beam specimens) such that the dimension of the crack increases in steps.Two PZT transducers, one each on a beam were bonded at one end on the surface using epoxy adhesive. These transducers were connected to impedance analyzer. First a small crack was induced at different locations on both beams, it was allowed to propagate in steps (cracks approaching PZT on one beam and departing on another). Signatures were acquired throughout the monitoring period (for increasing severity of crack); say if 10 signatures were obtained for 10 stages of crack severity increments, they were compared with all its preceding stage signatures. That is, 10th signature is compared with 1 to 9 signatures, 9th is compared with 1 to 8 and so on. Numerical modal analysis for crack propagation was carried out to understand the shifts in modal frequencies. Additionally, statistical based root mean square deviation (RMSD) index was used to demonstrate the crack propagation direction. Furthermore facts related to this investigation were clearly presented.
2. Background of EMI Technique
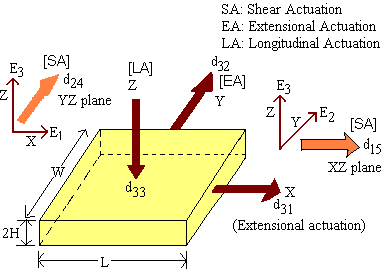
- In general, the actuation mechanism[15] of the PZTs in the presence of electric fields can be divided into extensional (along X and Y directions), longitudinal (along Z direction) and shear actuations (along XZ and YZ planes). Where
 ,
,  and
and  represent the electric fields along X, Y and Z directions as shown in Figure 1. The PZT in the presence of
  and
and  produces shear actuations (
 ,
, ), and in the presence of produces extensional actuations (
 ,
, ) and longitudinal actuation (
 ). Note that
  is the strain displacement coefficient, related to the normal strains in the presence of
 , and the subscript j denotes either the X, Y or Z direction.
  and
and  are the strain displacement coefficients related to shear strains in the XZ and YZ planes developed due to the fields
  and
and  respectively. However for EMI techniques, only electric field
  is applied along Z direction, thus the PZT produces only extensional and longitudinal actuations. As a result of these, the vibrations along the length, width and thickness of the PZT are produced[7]. Thus, when PZT is surface bonded on or embedded inside any host structure results in these actuations. The actuations imparted on the structure are forced vibrations. However, the structure tries to resist these vibrations resulting in a reaction to applied force. As stated earlier, PZT is both actuator and sensor. Hence it measures the inverse of this reaction force of the structure in-terms of its admittance which is inverse of impedance (is a ratio of reaction force over the velocity output). The admittance (
 ) is a complex term, and can be divided into real (conductance) and imaginary (susceptance) parts as given below
  | (1) |
 | Figure 1. Actuations of PZT |
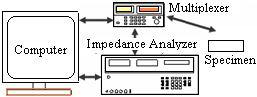 | Figure 2. Schematic diagram of the experimental setup |
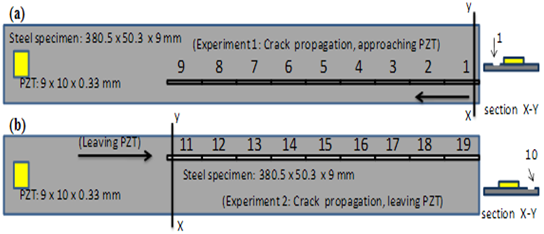 | Figure 3. Specimens (a) crack approaching PZT (b) crack leaving PZT |
3. Experimental Investigations
3.1. Experimental Setup
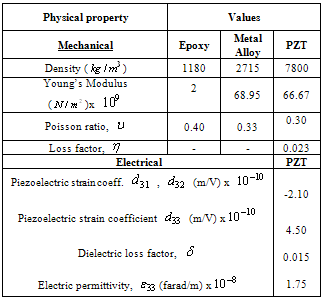
- The experimental setup (Figure 2) used for acquiring admittance signatures consisted of a Hewlett Packard 4192A impedance analyzer, a 3499A/B switching box (multiplexer), specimens and a personal computer. Two identical beams, made of metal alloy (Table 1) of dimensions 380.5 x 50.3 x 9 mm were used as the specimens in this study. Two identical PZTs of dimension 9 x 10 x 0.35 mm were surface bonded on these specimens at 10.5 mm away from one of the edges as shown in Figure 3. PZTs were wired to the impedance analyzer through the switch box, and actuated with a sinusoidal 1V RMS electric supply. The experimental EM admittance signatures i.e conductances were then acquired for the desired frequency ranges. Thus, the specimens through the PZTs, are connected to the analyzer via the multiplexer. These PZTs diagnose the crack propagation on the surface of specimens.The properties of the specimens, PZTs and the epoxy adhesive used to bond these PZTs on the beams are listed in Table 1. Beams rested freely on a foam bed and a ‘free-free’ boundary condition was assumed to prevail in the experimental study. Two experiments (Experiment 1 and Experiment 2) were conducted with the specimen as follows.
|
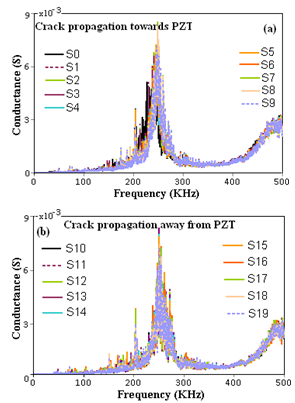 | Figure 4. Signatures of all stages (a) experiment 1 (b) experiment 2 |
4. Statistical Investigations
4.1. Root Mean Square Deviation (RMSD) Index
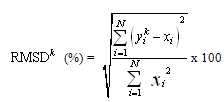
- There are few pattern recognition techniques such as ‘signature assurance criteria’ and ‘adaptive template matching’ to quantify changes in acceleration signatures[20] in addition to the RMSD indices[21-24] for comparisons between signatures of two different states. RMSD has been widely accepted and used for estimation of amount of variation between any two signatures. It is defined as
 | (1) |
 and
and  (i = 1,2,3…N) are signatures obtained from the PZT bonded to the structure before and after the damage (kth) is incurred, respectively. Where i=1, 2, 3...N indicates the frequencies where the value of admittance was collected. The RMSD is a comparable index of initial signature (
 ) with later stage signatures
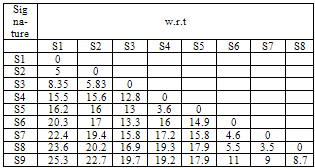
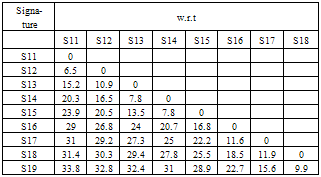
  (k = 1, 2,3 …). In the present study the RMSD index was adopted to evaluate the conductance signatures obtained from the ‘PZT-specimen’ system. For this purpose, two types of RMSD values were evaluated for each crack magnitude. The first one (type -1) was the deviation of the signature of a particular cracked state (say S1 and S11 for experiments 1 and 2, respectively) with respect to (w.r.t) the baseline signature (S0 and S10 for experiments 1 and 2, respectively). The second (type-2) was the quantitative deviation of the signature w.r.t the signature of the immediate state (i.e the deviations of signatures S2 to S9 w.r.t S1; S3 to S9 w.r.t S2; S4 to S9 w.r.t S3 and so on). The type-2 can be termed as ‘subsequent-state-index’. If
  and
and  are the signatures obtained for the state of the specimen at (k-1) th and kth crack magnitudes, respectively, then the subsequent-state-index for the state at kth crack magnitude is given by replacing
  by
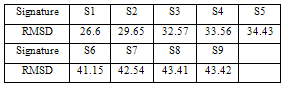
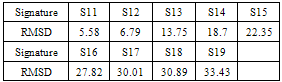
by  in Equation 1. Tables 2 and 3 list the quantitative deviations of signatures (S1 to S9) w.r.t S0 (no crack), i.e type 1 RMSD for experiment 1, and deviations of signatures (S11 to S19) w.r.t S10 (no crack) for experiment 2. From the tables, it can be seen that as the crack severity or propagation length increases, the RMSD value increases for both the experiments. From Figure 4 and Tables 2-3, it is understood that EMI method is effective in predicting the severity of damage but the propagation direction could not be established. Thus this is one limitation of EMI technique. From careful examination of Figure 4, it was observed that there is lack of repeatability of signatures. If both specimens are identical, baseline signatures of both specimens, S0 and S10 should be identical. However, small deviations in magnitudes of signatures were observed (which may not be obvious from figure), which implies that even though the two specimens are identical, the baseline signatures (S0 for experiment 1 and S10 for experiment 2) are not the same and hence the PZT did not yield identical signatures. This is because of many reasons for example the specimens may not be ‘exactly’ identical or the bonding positions of PZT may not be ‘exactly’ identical on the beams resulting in variations of baseline signatures. Thus, it can be stated that EMI technique will not yield unique signatures even if there is slight variations in bonding positions of transducer or if specimen is not exactly identical. Thus, the transducer is very sensitive and subsequently, it may not be possible to replicate (produce same) signatures in practical cases were structures are larger /complicated than the experiments undertaken in the present study. In general, if crack is near the PZT i.e say S11 (crack 20 mm), the statistical deviation (RMSD) w.r.t signature S10 (no crack, experiment 2) should be more than RMSD of crack, far from the PZT i.e S1 (crack 20mm) w.r.t signature S0 (no crack, experiment 1). But the obtained RMSD values are respectively 5.58 % and 26.6 %, which is in contrast. This is another limitation of EMI technique. Tables 2 and 3 shows that as the crack severity increases, the RMSD values also increases indicating that PZT is relatively smarter in assessing the severity of the crack for a considered specimen if the PZT location does not alters throughout the experimental period. To further study the behaviour, type 2 RMSD study was carried-out as given in Tables 4 and 5 for experiments 1 and 2, respectively. One more drawback in this EMI technique is that the crack propagation directions (with respect to PZT) in both cases of experiments are opposite but still the Type 1 RMSD values show similar increments as crack severity increases (Tables 2-3). Type 2 RMSD yielded decreasing values as we go towards right (increasing severity) as given in Tables 4 and 5 for both experiments. Again, it is difficult to differentiate the propagation direction. Thus, even this statistical investigation (types 1-2) also failed to understand the propagation direction even though it was able to predict the severity of crack. So, numerical study was carried-out as shown in next section to check if at least this can give any further information about crack propagation direction.
|
|
|
|
5. Numerical Investigation
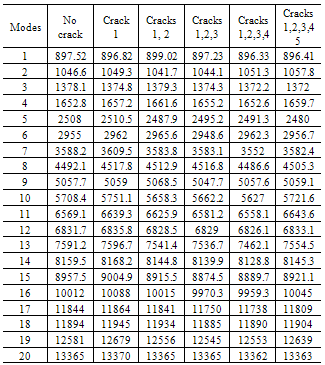
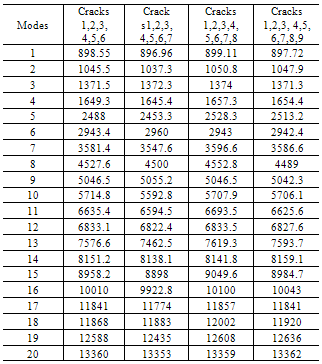
- A numerical modal analysis was carried out using ANSYS[25] for both identical specimens. In the modal analysis (with appropriate meshing size) four types of mode shapes namely, axial, flexural, movement in XZ and twisting in XYZ space were observed, where X, Y and Z represent directions along length, width and thickness of the beam.For both types of crack propagations, the shifts in modal frequencies (of first 20) were found to be similar and thus it was difficult to find out the propagation direction even in numerical investigation. Figure 5 shows the modelling and model frequency distribution graphs of two types of crack propagations (i.e for experiment 1 and 2). There exists no difference between Figures 5 (c) and (d). The modal frequencies of first twenty mode shapes of the experiment 1 are listed in Tables 6 and 7. The model frequencies for experiment 2 are similar to experiment 1.
6. Merits & Demerits of EMI Technique
- The (1) experimental study, the (2) RMSD indices and the (3) modal analysis have not been able to predict the direction of crack propagation. i.e., no trends were observed in the (1) experimental signatures and (3) modal analysis, where as ‘increasing trends’ of (2) RMSD were observed for both directions of crack propagation (towards and away from PZT), this questions the applicability of EMI to study crack propagation using wide range of excitation frequency even though the RMSD increases as magnitude of crack increases.
|
|
6.1. Signature Analysis
- A closer study of peaks and valley of the signatures of Figure 4 was carried out (as shown in Figure 6). That is, in Figure 4(a-b) a peak was found at frequency range of 23-24 KHz, which resulted in decrease in signature magnitude as the crack propagated towards, and increases as crack propagated away from PZT. So it is possible to predict the propagation direction by inspection of peaks and valleys, which is another advantage of EMI technique. However, the search was random and hence it cannot be generalized. The frequency range of 23-24 KHz is so narrow to be considered as logically correct. However the present study indicates that EMI technique is still in the infant stage without many practical applications[26], even though it has potential and sensitivity for prediction of cracks etc. So, future studies are compulsory to implement EMI technique in SHM applications for real practice. Hence future research should concentrate on narrow frequency range studies (example: 50- 100 KHZ, 100-150 KHZ and so on) within a wide range of frequency band to understand various issues like (a) multiple cracks, (b) axial loading pattern and (c) transverse loading patterns (d) fatigue etc on structures to be monitored. In addition to this, the electric supply to the transducer in practical applications is difficult[26] as there can be multiple PZT transducers with several electric supply wires. Hence a way of energy harvesting to the PZT transducers[27, 28] should be considered. Thus there are several factors which should be considered before considering EMI techniques to actual practice[26].
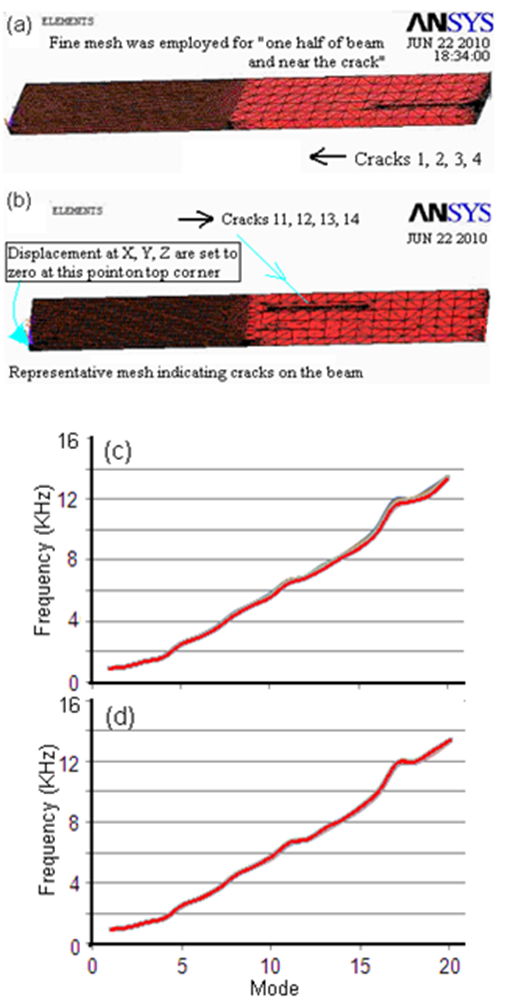 | Figure 5. Modelling and model frequency distribution graphs (a) Representative meshing of 4 cracks (b) Frequency distribution graph for all cracks propagating towards left (c) Representative meshing (d) Frequency distribution graph for all cracks propagating towards right |
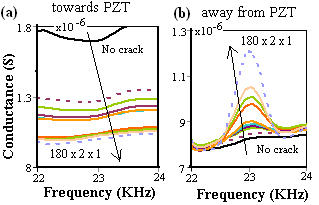 | Figure 6. Conductance signatures (a) Experiment 1 (2) Experiment 2 |
7. Conclusions
- Consciousness of SHM of either metals or non metals has increased many folds in the recent couple of decades. Subsequently many SHM techniques have emerged to monitor the condition of structure to find out damage/ instability at earlier stage of occurrence. However, the EMI technique which is a recently developed classification of SHM can provide a promising monitoring solution for many engineering structures if its limitations as presented in this study are addressed. Detection of any crack, generated in the sensing zone of PZT at earlier state of its occurrence using EMI technique is possible. Even its magnitude can be predicted but its direction of propagation cannot be predicted with logic (however a signature analysis can be carried out into the narrow frequency ranges to predict the direction of crack propagation). This paper presented a study of progressive crack i.e crack propagation towards and away from PZT. RMSD index was found to increase continuously for the considered frequency range as crack magnitude increased in both experiments. However, in practice, the occurrence of ‘crack’ and its ‘propagating directions’ are equally important. In this study, the crack propagation direction was not properly predicted even though ‘peak study of signatures’ i.e signature analysis had shown that the frequency range of 22 to 24 KHz was able to clearly differentiate two directions of crack propagations. But the fact is that the frequency range is too narrow, and the search to find this range was random. Hence future studies should continue to improve EMI technology for crack propagation studies and practical applications. This paper is expected to be useful for new researchers planning to work in the area of EMI technique as the experiments presented here are very basic and important. This paper also clearly presents that the existing researchers in this area should concentrate on addressing issues like multiple crack detection etc before actually applying in practice.
ACKNOWLEDGEMENTS
- The author would like to acknowledge his best friend Prof. Bhagwan Sri Krishna for his inspiration throughout the preparation of this article.