-
Paper Information
- Paper Submission
-
Journal Information
- About This Journal
- Editorial Board
- Current Issue
- Archive
- Author Guidelines
- Contact Us
Advances in Computing
p-ISSN: 2163-2944 e-ISSN: 2163-2979
2023; 13(1): 1-8
doi:10.5923/j.ac.20231301.01
Received: Jan. 2, 2023; Accepted: Jan. 13, 2023; Published: Jan. 16, 2023

Predicting Electrical Energy Consumption for Commercial Buildings Using Data Science: A Case Study of the University of Zambia
 Abstract
 Reference
 Full-Text PDF
 Full-text HTML
Michelo Mtolo, Grayson Himunzowa
Department of Electrical and Electronics Engineering, University of Zambia, Lusaka, Zambia
Correspondence to: Michelo Mtolo, Department of Electrical and Electronics Engineering, University of Zambia, Lusaka, Zambia.
| Email: |  |
Copyright © 2023 The Author(s). Published by Scientific & Academic Publishing.
This work is licensed under the Creative Commons Attribution International License (CC BY).
http://creativecommons.org/licenses/by/4.0/

This study investigates and analyses the prevailing energy consumption challenge and practices at the University of Zambia. For this reason, Data Science was proposed in this study. An orange toolkit which is a data Visualisation, Machine learning and data mining toolkit from Anaconda open-source distribution software and Microsoft power BI were used to achieve the objective and answer the research questions of this study. The process involved data collection of energy consumption from a specified target area which was the University of Zambia through the office of the Residence Engineer, raw energy consumption datasets were collected for 10 years from 2009 to 2019 in form of Microsoft Excel and stored using Microsoft OneDrive software, the data was thoroughly cleaned, understood and analysed, then based on that, a model was developed in Orange toolkit using Linear regression as a machine learning tool to give us the predictions, with the main data split into test and training data, the model was able to analyse the data and do the prediction of energy consumption for the year 2020, later data visualisation was achieved through Microsoft power BI software, hence completing the Data Science cycle and meeting the research objectives. Results show total monthly energy consumption for 2020 based on the historical data and other changing factors, with an accuracy of 92.4% test on training data and 77.4% test on test data against the actual 2020 data. The research has identified expected energy consumption through predictive analysis at the University of Zambia, proper energy management is a matter of concern at the University of Zambia.
Keywords: Data Science, Energy Consumption, Machine Learning, Linear Regression, Training Data, Test Data
Cite this paper: Michelo Mtolo, Grayson Himunzowa, Predicting Electrical Energy Consumption for Commercial Buildings Using Data Science: A Case Study of the University of Zambia, Advances in Computing, Vol. 13 No. 1, 2023, pp. 1-8. doi: 10.5923/j.ac.20231301.01.
Article Outline
1. Introduction
- As to date smart meters are being deployed in millions of buildings, providing bidirectional communication between the utility companies and energy consumers, which has given rise to the generation of extensive volumes of data with high velocity and veracity attributes. Such data have a time-series notion, typically consisting of energy usage measurements of component appliances over a time interval [1]. This data stored in computers can be used to predict energy consumption for consumer companies to optimise energy use and forecasting demand. This is possible nowadays due to the advent of data science, capable of taking these large volumes of time series data and facilitates decision through the transformation of meaningful information. This has revolutionised utility providers for learning customers energy consumption behaviour, making it possible to predict electrical energy consumption for the future. Utility companies are constantly working towards determining the best methods to improve profit and reduce costs by introducing programs, such as demand response and demand-side management, that best align with the consumer's energy consumption behaviour. Despite having a marginal success in achieving the goals of such programs, sustainable results are yet to be accomplished [2].It is challenging to understand consumers behaviour individually and tailor strategies that suggest energy-saving plans. Furthermore, the relationship between the parameters affecting energy consumption patterns and human behaviour is non-static [2]. Consumer behaviour is dependent on weather and seasons which has a variable impact on energy consumption decisions. Thereby, actively engaging consumers in personalised energy management by facilitating well-timed feedback on energy consumption and the related cost is key to steering suitable energy saving schemes or programs [3]. Therefore, designing models that are capable of analysing energy time series from smart meters which are capable of intelligently forecasting energy usage is very critical.Data science builds systems and algorithms to discover knowledge, detect patterns, and generate useful insights and predictions from large-scale data [4]. The purpose of this study is to develop a model for predicting electrical energy consumption using data science. The University of Zambia Great East Road Campus was used as a case study where historical electrical energy data was collected. The study carried field evaluation of the energy consumption by taking historical data sets for 10 years (from 2009 to 2019). The data were collected through the residence engineer’s office in form of excel documents. Historical data sets gathered were analysed and enumerated. An orange toolkit which data science toolkit from Anaconda open-source distribution software was used to achieve the objectives and answer the research questions of this study.
2. Literature Review
2.1. Data Science
- Data science is an inter-disciplinary field that uses algorithms, processes, scientific methods, and systems to extract knowledge and insights from many structural and unstructured data. This allows efficiency, in managing costs, identifying new business opportunities, and results in boosting market advantage as compared to the old traditional method which used excel documents to manage different types of data [5].To define data science and improve data science project management, begins with its life cycle. The first stage in the data science pipeline involves business understanding where you ask relevant questions and define objectives for the problem to be tackled. The next stage is data mining where you gather the data necessary for the project. Followed by data cleaning, a stage constituting fixing the inconsistencies within the data. Next is an equally critical stage which is mainly the exploration of data. Here data scientists form a hypothesis from analysing the observed data. Next is feature engineering where the data scientist selects more meaningful and constructive data from the raw data. Predictive modelling is the next stage where data. scientist train machine learning models, evaluate their performance and use them to make predictions. The last stage is data visualisation where the data scientist communicates the findings with key stakeholders using plots and interactive visualisations [5].
2.2. Application of Data Science in Commercial Buildings Electrical Energy Management
- Data science techniques have been frequently used to support and improve the basic aspects of energy efficiency and management. Accordingly, this section focuses on applications of Data Science that can do the following: predicting the electrical energy demand required for the efficient operation of a building, analysing the economic and commercial impact of user electrical energy consumption, detecting, and preventing electrical energy fraud.
3. Methodology
3.1. Research Approach
- This research was conducted in a highly technical space and drew participation from the University of Zambia. The study used quantitative methods and took the form of a case study of the University of Zambia.
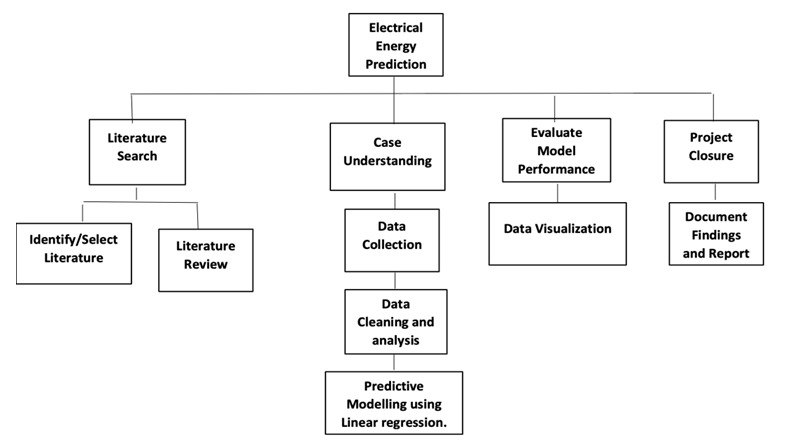 | Figure 1. Research approach |
3.2. Research Tools
- To test provide responses to the questions, it is necessary that we observe the behaviour of data when exposed to scientifically proven systems. This will help to obtain empirical evidence that can be relied upon and plausible. There are many simulations software tools available to formulate predictive model. For the purposes of this study, three (3) tools were identified suitable for this study. The identified are Anaconda open-source distribution software (Edition 2020), Orange Data Science Toolkit (Edition 2020), and Microsoft Power BI (Edition 2020).
3.3. Data Collection Methods and Instruments
- Data collection of this research involved collecting the university’s historical electrical energy consumption data for a period of ten years from 2009 to 2019. The historical data were Zambia Electrical Supply Corporation monthly statements which amounted to 120 months was collected from the resident engineer’s office. Historical university status from 2009 to 2019, historical exam status from 2009 to 2019, historical season status from 2009 to 2019, historical school activities from 2009 to 2019 and lastly student’s population from 2009 to 2019 were collected using Microsoft excel and stored using Microsoft OneDrive software. The primary data was historical electrical energy consumption data. The literature in chapter two will be used as well to help deduce the gathered facts and conclude the study.
3.4. Data Cleaning and Analysis
- The data collected was cleaned and analysed in this way, the historical university status, was categorised in two scenarios: university closed or university open. The historical exam status was also taken into consideration and categorised in three scenarios, namely: no exam, midterm exam and end term exam. The historical season status was also categorised in four scenarios, namely: Autumn, winter, summer, and rain season. The historical school activity categorised in five scenarios, namely: arrival of students, classes, study break, term break and vacation. Lastly the student population was categorised as full-time students and part time students. This data is critical to provide accurate total electrical consumption predictions. This was done in Microsoft excel document.
3.5. Model Design and Experimentation
- Linear regression was the machine learning algorithm used in this model because of its efficiency in building machine learning projects, scientifically proven and reliably predict the future and it being a long-established statistical procedure hence well understood and can be trained very quickly [6]. The model has six sections that are critical in its operation, these are: main data (where you feed processed and analysed energy dataset), another training set( where you feed energy dates to be predicted, 2020 energy consumption), get test data (2018-2019 energy data sets, to validate the model), get training data(Energy data from 2010-2017, this is to build the model), target settings (Which variables are critical in the data to be predicted) and rank section (To check the accuracy of the Model).
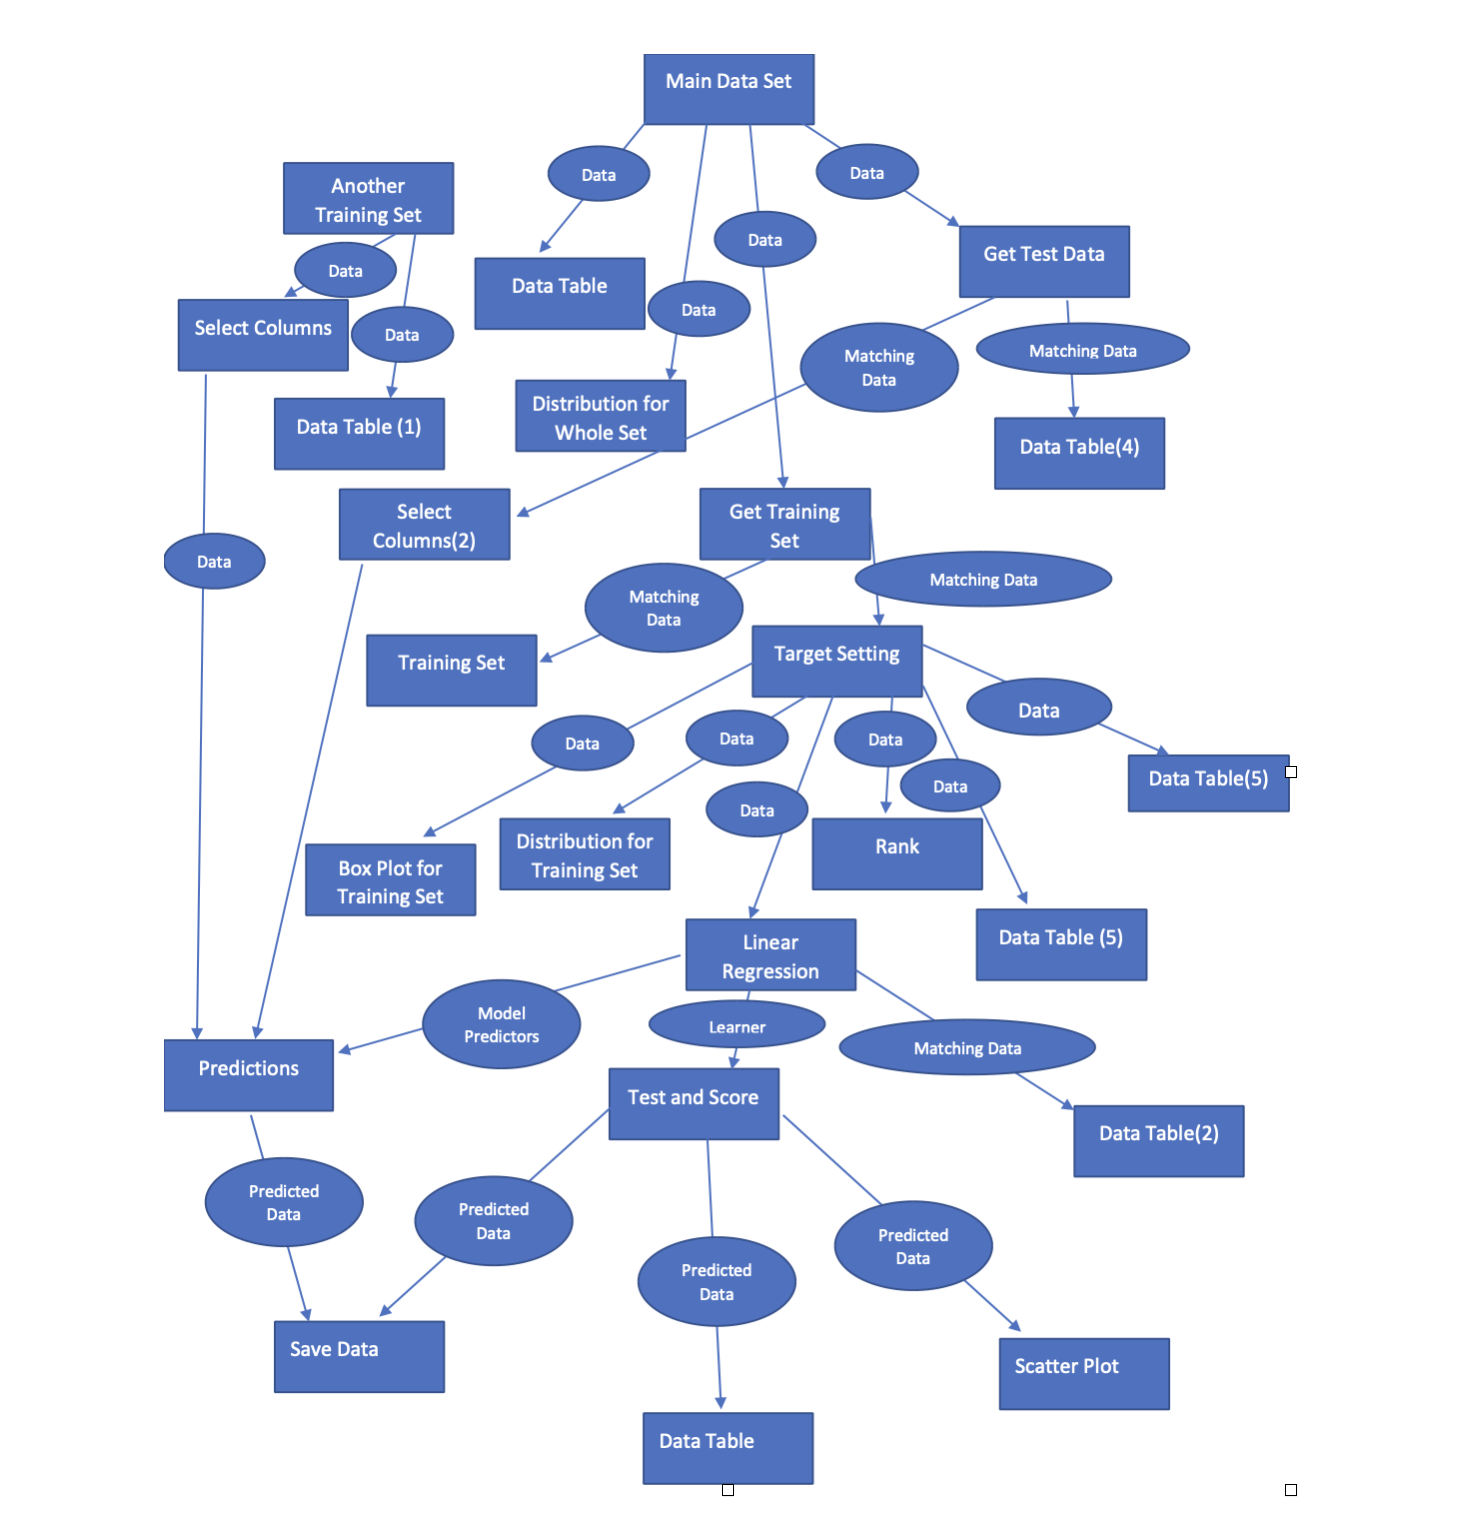 | Figure 2. Model Design and Experimentation |
3.6. Equations
- The linear regression is used in the model consisting of a predictor variable and a dependent variable related linearly to each other. In case the data involves more than one Independent variable, then linear regression is called multiple linear regression models. The below given equation is used in this research.Multiple linear regression: Y = a + b1X1 + b2X2 + b3X3 + ... + btXt + uWhere: Y = the variable that you are trying to predict (dependent variable). X = the variable that you are using to predict Y (independent variable). a = the intercept. b = the slope. u = the regression residual [7].
4. Findings
- The results analysis presents the results generated from the model. There are nine results that are discussed in this part, these are results accuracy, model Predicted electrical consumption data, Microsoft Power BI Visualised: predicted electrical consumption by season status, predicted electrical consumption by exam status, predicted electrical consumption by school activity, predicted electrical consumption by student population, predicted electrical consumption by month and lastly predicted total electrical consumption for the year 2020.
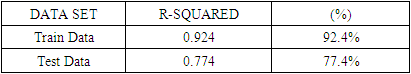
4.1. Results Accuracy
- The results accuracy was evaluated in Test and Score widget. Test and Score widget can be used to view your desired learning algorithms accuracy [8]. Mean Squared Error (MSE) of an estimator measures the average of the squares of the errors that is, the average squared difference between the estimated values and the actual value [9]. Root Mean Square Error (RMSE) is a frequently used measure of the differences between values (sample or population values) predicted by a model, or an estimator and the values observed [10]. Mean Absolute Error (MAE) is a measure of errors between paired observations expressing the same phenomenon [11]. Coefficient of determination score varies between 0 and 100% or 0 and 1. It is the proportion of the variance in the dependent variable that is predictable from the independent variable [12].
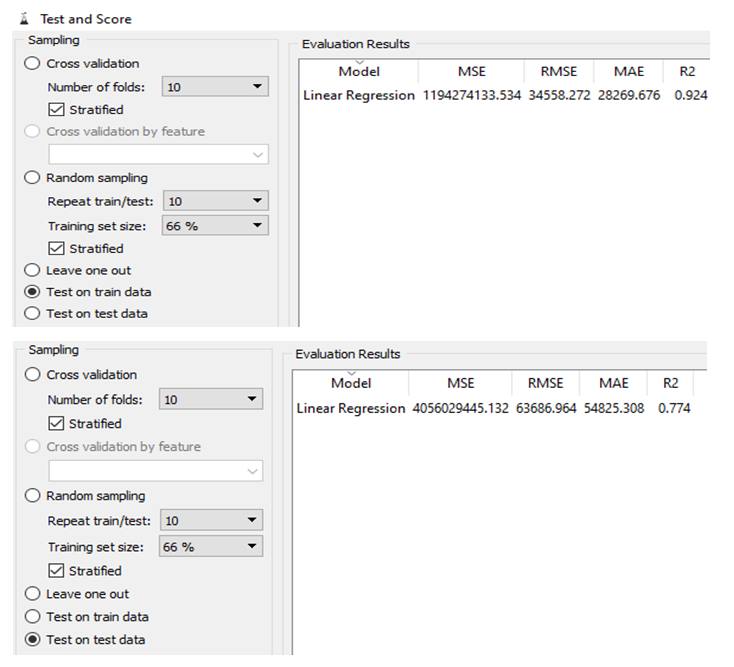 | Figure 3. Test and Score Report |
|
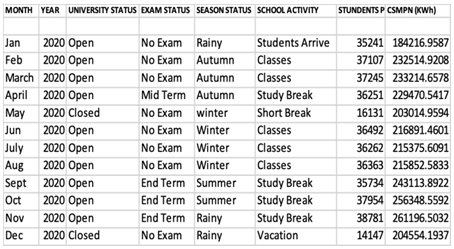
4.2. Predicted Electrical Consumption Data from model
- In table 2 below, the 2020 predicted electrical consumption data is presented which is based on exam status, university status, season status, season activity and student population.
|
5. Discussions of Results
5.1. Predicted Electrical Consumption Data by Season Status
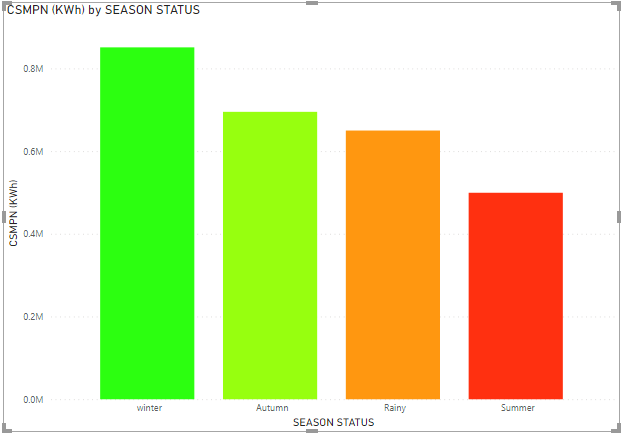 | Figure 4. Data by Season Status |
5.2. Predicted Electrical Consumption Data by Exam Status
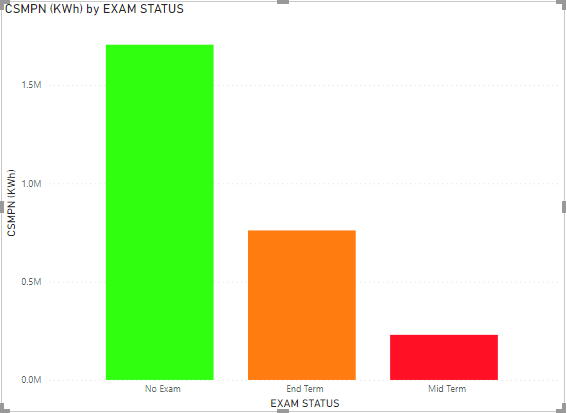 | Figure 5. Data by Season Exam status |
5.3. Predicted Electrical Consumption Data by School Activity
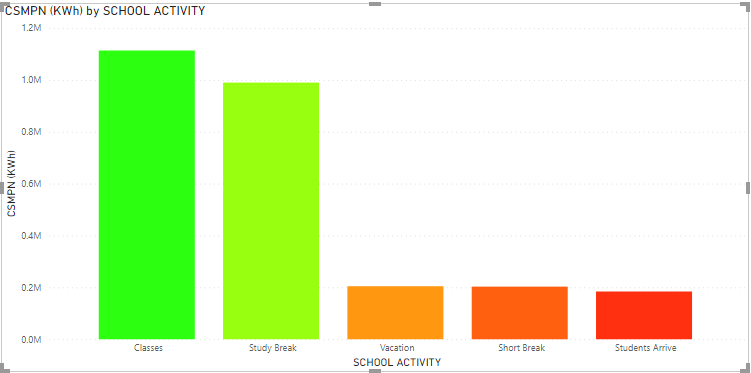 | Figure 6. Data by Season School Activity |
5.4. Predicted Electrical Consumption Data by Student Population
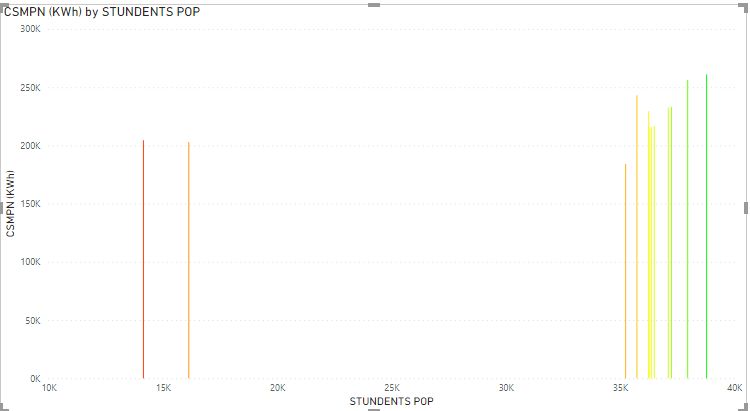 | Figure 7. Data by Season Student Population |
5.5. Predicted Electrical Consumption Data by Month
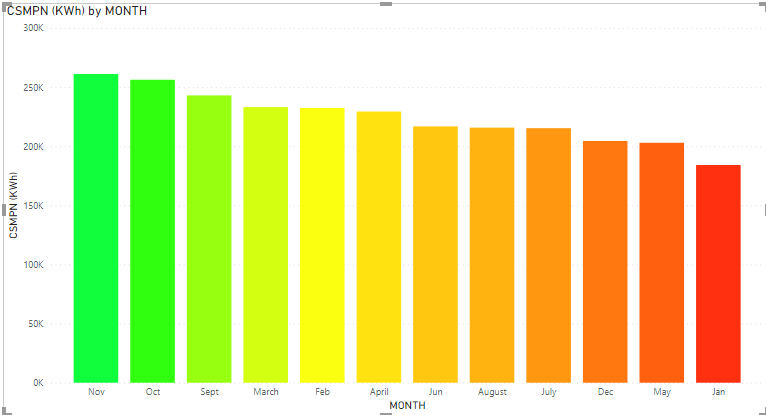 | Figure 8. Data by Month |
6. Conclusions and Recommendations
- This study has predicted electrical energy consumption using data science at the University of Zambia. Linear regression the suitable machine learning algorithm used in the formulated model achieved a higher accuracy in the prediction of 92.4% on train data and 77.4% on test data, this concentrated on the following eight (8) predicted areas.Based on predicted data for 2020 obtained and the observations of this study and others, this research recommends the use of Data Science to predict electrical energy consumption in higher learning institutions. Microsoft Power BI provides clearer, and data driven visualisations and shown in chapter 4 of this study. In summary this study makes the following recommendations. The machine learning algorithm for the Data Science prediction model must be carefully selected to meet the objective based on the raw data. This study recommends that the software selected such as Microsoft Excel spread sheet, One Drive and Power BI work well in the Data Science life cycle. To achieve a higher accuracy with Data Science predictions more raw data is required. It is also recommended Anaconda open-source distribution software and orange tool kit latest versions should be installed on a computer with minimum 8GB RAM and core I5.This work focused on total electrical energy consumption prediction at the university of Zambia. In future this work could be extended in other sectors such as the mines, agriculture health and finance sector where electrical energy consumption is high. Furthermore, future studies could look at better machine learning algorithms in detail and consider them in predicting electrical energy consumption.
ACKNOWLEDGEMENTS
- I wish to express my sincere gratitude to God for giving me special grace to accomplish this work. This whole study was not without challenges yet at no time did I doubt his presence in the storm. Secondly, I would like to thank my Research Supervisor, Dr. Grayson Himunzowa for his unfading support and guidance throughout my study and research period. I would like to thank my father, Mr. Raban Mtolo and mother, Mrs Pimpa Mtolo for unwaveringly supporting my study.