Komolafe E. O. 1, Awoyelu I. O. 1, Ojetade J. O. 2
1Department of Computer Science and Engineering, Obafemi Awolowo University, Ile-Ife, Nigeria
2Department of Soil Science, Obafemi Awolowo University, Ile-Ife, Nigeria
Correspondence to: Awoyelu I. O. , Department of Computer Science and Engineering, Obafemi Awolowo University, Ile-Ife, Nigeria.
| Email: |  |
Copyright © 2019 The Author(s). Published by Scientific & Academic Publishing.
This work is licensed under the Creative Commons Attribution International License (CC BY).
http://creativecommons.org/licenses/by/4.0/

Abstract
The use of machine learning algorithms to discover knowledge and important relationships in a dataset is a promising trend in recent technological advancement. Machine learning has been gaining grounds in different fields, one of which is Agriculture. Thus, this study presents a predictive model for analysing and extracting important information from available data about how suitable a land is for cultivating cassava. Secondary data that contains result of several land mapping activities, were obtained from the Institute of Agriculture, Research and Training (IAR&T), Ibadan. The collected data was preprocessed and converted to .csv format that can be recognised by WEKA simulator. 10-fold cross validation was used for training and testing. The classification mining rule was generated using J48 algorithm in Decision tree. The decision tree were generated using ‘If-then’ construct models that were used to classify a land to be suitable or not suitable for cultivating cassava.. The classification model had an accuracy of 87.5% and 12.5% for correctly and incorrectly classified instances respectively. The classification model is a potential tool that can be used by extension workers to identify and recommend to farmers, the appropriate land to cultivate cassava.
Keywords:
Cassava cultivation, Machine learning, Mining algorithm, Land suitability, Decision tree
Cite this paper: Komolafe E. O. , Awoyelu I. O. , Ojetade J. O. , Predictive Modeling for Land Suitability Assessment for Cassava Cultivation, Advances in Computing, Vol. 9 No. 1, 2019, pp. 21-31. doi: 10.5923/j.ac.20190901.02.
1. Introduction
Land suitability assessment describes a process of forecasting land usage potentials based on its attributes [1]. It involves the discovery of land performance for a paticular purpose. A scientific process is used to determine assesment of land so as determine the advantages and disadvantages of a given agricultural land [2]. The knowledge of soil limitation arises from land assessment reports which intends to give a solution to such limitations before, or during cropping period. Hence, soil as a main channel for cultivation needs to be assessed scientifically with some other environmental factors that dictates the quality for the utilization type. In this technological era, the use of computing and scientific learning techniques to solve human problems is now a vital of the human life [3]. The advancement of computing more recently machine learning has proven to be a rewarding area towards providing solutions to problems in different fields [4]. In this study, the application of machine learning in the field of agriculture is considered. Predictive modelling is an expression given to a group of mathematical techniques with a specific aim of determining the logical relationship between the known, unknown and several variables that are independent to the prediction so as to measure the future values of such predictors. The logical relationship between these variables is used to forecast into the value of the target variables [5]. In agriculture, predictive modelling uses algorithms and models that are dynamic to collate data from several sources, with foundational knowledge on the physical, chemical and physiological processes that describes the growth and production of crops so as to verify certain outcomes such as crop yield [6].Cultivation of cassava reached some level of importance as it has positively impacted the local community by serving as a source of food and agro-employment opportunities. For more that ten years, Nigeria has been the biggest producer of cassava in the whole world with a production capacity of about 35 million tonnes [7]. Cassava production limitations are caused by restricting factors such as wrong farmland selection, inability to identify good soil for farming, unavailability of nutrients requirement database that constitute each crop [8]. Consequently, as a result of all theses listed factors, there has not been a reasonable output of cassava production, which gives rise to the need for determining land suitability for cassava cultivation. Existing studies revealed that the inability to identify suitable land is responsible for low yield of cassava. Several machine learning algorithms have been used to determine the suitability of land, however, most of this previous works focused on soil and climatic factors independently and this had led to inappropriate land use plan for cassava cultivation. There is, therefore, the need for a model that combines these factors dependently for better assessment of the land suitability. This paper focusses on bridging the gap in the existing literatures by considering both soil and climatic factors together as a whole to determine the suitability of land for cassava cultivation.This paper is limited to the prediction of the suitability of land for cassava cultivation as related to the factors identified as the condition for its growth.The production of cassava is very vital to the economy of the nation as it serves as it serves as one of the crop for food security and agro-based industrialization. Cassava has so many benefits both locally and industrially. As a result of its high percentage of carbohydrate, it is a suitable raw material for production of ethanol, starch, adhesives, bio-fuels, glucose syrup among others. It can also be processed locally in form of garri, chips, flour to make bread as many others. Although, Nigeria has been the biggest producer of cassava in the whole world for more than a decade, but the production no longer meets the demand of existing processors. Since the yield of the crop is not relative to its demand; this study stands to identify suitable land for cassava which will provide better yield with minimum or no improvement.
2. Existing Works
The genesis of sustainable management is having enough knowledge on resources of a land. Another factor to consider is the how suitable a land is for a crop cultivation [9]. When a farmland is used inappropriately, this causes inappropriate exploitation of natural resources, land resources destruction, poverty and other social problems [10]. The activities carried out by people on a land vary in several land mapping units as well as the management styles on areas that differ within a land utilization. For instance, the type of land utilization may involve mixed farming with arable farming and the other parts allocated for grazing. This differences may arise from land variation from the specifications of the management, or in both cases. This study focuses on determining the appropriate land for the the cultivation of cassava.
2.1. Cassava Cultivation
Cassava (Manihot esculenta crantz), is a perennial subshrub or shrub, it is the third largest carbohydrate food source in the tropical region, after rice and maize [11]. It is a starchy tuber that is majorly produced in regions that are tropical around the world. It supplies the body with carbohydrate which is at least twenty-five percent higher than maize and rice, this makes it a very vital unprocessed material for the production glucose syrup, ethanol, bio-fuels, starch, adhesives and others [12]. The potential for cassava for food security is very high and it also helps to improve the livelihood. It can be processed locally in form of garri, bread, fufu, cassava chips and so on.In the last decade, the largest producer of cassava is Nigeria with a production of approximately 35 million tonnes [13]. The increase in cassava's benefit has placed it on the government's and the international development agencies priority as an important crop for securing food production. However, Nigeria's production of cassava is mostly driven by continuous expansion of the land rather than increase in crop yield. While the quantity of production and harvested area have increased at a steady rate over the years, yield increased at a small rate.
2.2. Land Suitability Assessment
Land suitability assessment plays a vital role in reducing farming threat. It helps to identify how a land mapping unit matches the requirement of the land utilization type. Land suitability assessment is the application of scientific methods to verify the features of a land for a specific purpose. The knowledge of land suitability is very important in other to determine the resources that is needed for best practices on an agricultural land. This knowledge determines the factors limiting agricultural production and assists those that need to make decision on a land to design a crop management style that can reduce these limitations so as to increase crop yield [14]. In identifying the possible areas to develop agriculture, accurate and balanced data are required to evaluate the suitability of a land.
2.3. Application of Machine Learning in Land Suitablity Assessment
The use of support vector machine (SVM) algorithm for land suitability was discussed in the work of [15]. The study analyzed the land suitability of rainfed wheat production in Kouhin Region in Iran. A total of one hundred and twenty (120) soil samples from thirty-two (32) different soils, ten fatures of the soil profile were implemented on non-linear class boundaries, Matlab 8.2 was used to simulate and evaluate the support vector machine model. [16] introduced Artificial Neural Network (ANN) in predicting how suitable a crop is from the soil features. The features used are soil type, PH value, magnesium, nitrogen, iron, phosphate, calcium, potassium, temperature, humidity, rainfall e.t.c. It was experimented using Matlab. The researchers acknowledged the potentials in using ANN to predict crop suitability from soil data collected. [14] used machine learning to classify land suitability for cultivating wheat. The dataset used in the study were collected from Shavur plain north of Khuzestan province, south western Iran. The land suitability were grouped as not-suitable, highly suitable, marginally suitable and moderately suitable. It was implemented using RotForest, Adaboost and Bagging algorithms. The result showed that Adaboost had the best performance when compared with other algorithms. The study was limited because the classification features were based on suitable and not-suitable. [17] worked on the prediction of appropriate planting month for early crop. Weather conditions that affected maize growth were identified and J48 algorithm was used to learn IF-THEN rules that constituted the model. The algorithm resulted in a success rate of 76.875%. [18] used decsion tree to predict soil fertility class. Data set was collected from a soil testing lab in India. The dataset had 10 features. Decision tree algorithms: J48, NBTree and simple CART, were used for the prediction. J48 algorithm had the highest accuracy when compared with simple CART and NBTree classifiers, this is because J48 algorithm is better for prediction when decision tree is used. [19] applied machine learning algorithm to develop a predictive model for evaluating soil suitability for cassava cultivation. The data used were existing data from literatures. Classification was carred out using J48 algorithm of decision tree. The chemical properties of a soil were considered as features. J48 algorithm had an accuracy of 76.5% which showed that, it is good model for classification of land suitability. However, they indicated that some other parameters of soil such as depth, texture, base saturation and climatic condition could improve the prediction of land suitability for cassava cultivation.From existing literatures, most of the research works have focused on the properties of the soil while some focused on the qualities of the soil independently. This study extends the classification to consider land (soil) qualities using the FAO framework for classification. Although, [19] developed a classification model using J48 algorithm and used the properties f a soil as input for cassava cultivation; their classification did not include other factors that can influence the prediction of suitable land for cassava, such as depth, texture, base-saturation and climatic condition. For this study, J48 algorithm was used to develop the land suitability model.
3. Methodology Framework of the Study
This study involved the use of machine learning algorithms for the prediction of land suitability assessment for cassava cultivation, using data collected from the Institute of Agricultural Research and Training (IAR&T), Ibadan, a major agricultural research institute in Nigeria. The data contained two-hundred and fifty-two records (252). Figure 1 shows the diagram of the methodology framework which was applied in the development of land suitability assessment model. The framework shows the phases involved in the development of the model, which include the data preprocessing, data transformation; after which the transformed data were split into training and testing data, which were then used as input for prediction model. 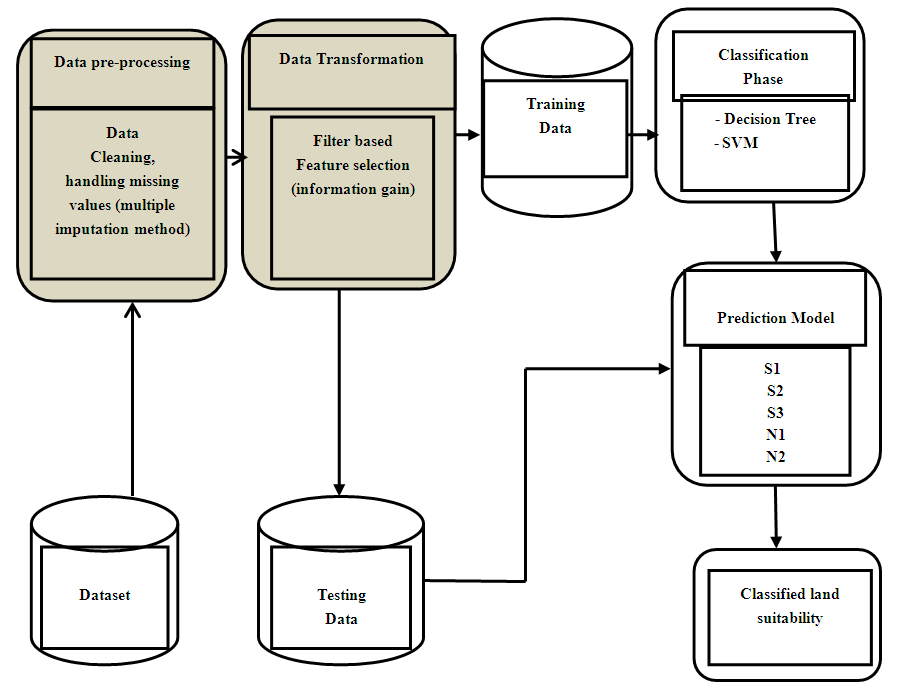 | Figure 1. Framework of Developed Model |
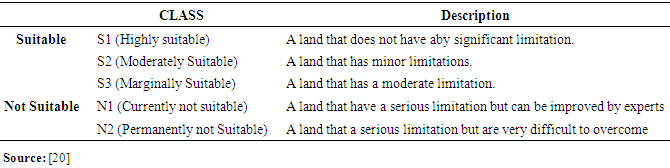
Table 1 shows the order and description of the suitability classes. The dataset collected from the research institute formed the basis of the historical dataset, which contains various records of predictive parameters. Feature selection methods were used to identify relevant features among the data collected. The historical dataset containing the reduced feature was stratified into two groups which are the training and testing datasets. The training and testing datasets were fed to the machine learning algorithms developed using 10-fold cross validation to validate the model. The performance result of the supervised machine learning algorithms were used to determine the most efficient model for predicting land suitability.Table 1. Order and Description of Suitability Classes
 |
| |
|
3.1. Data Identification and Collection
This section highlights the process involved in identifying the data. Each feature was identified and properly selected.
3.1.1. Identification of Variables
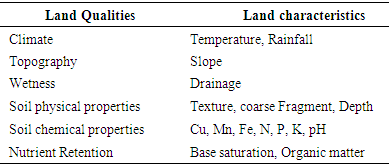
A number of features were selected to be either important or not important features in predicting a land for potential cultivation of cassava. The features identified are similar to those observed soil science experts. These people termed “experts” are experienced people in the soil science and crop production, and information is disseminated correctly. These experts include postgraduate students, lecturers and researchers from the research institute. The features that were identified as factors were divided into six sets which include nutrient retention, climate, soil chemical characteristics, topography, soil physical characterstics and wetness. These features selected are depicted in Table 2. The features are annual rainfall, temperature, slope, drainage, texture, coarse fragment, base saturation, pH, organic matter, depth, nitrogen (N), phosphorus (P), potassium (K), manganese (Mn), copper (Cu) and iron (Fe).Table 2. Identified variables for Cassava Cultivation
 |
| |
|
3.1.2. Variable Description
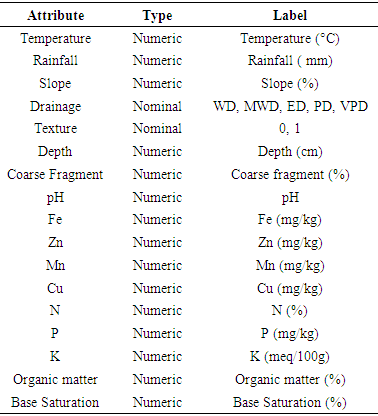
Prior to the pre-processing of the identified variable, it is important to label the variables in order to make the dataset easier to read and interpret. It also provides description of the identified attributes used in this study. Table 3 depicts the description of the variables and the unit measurables. These variables are climate, topography, soil physical properties, soil chemical properties and nutrient retention. These variables are explained one after the other.Table 3. Variable Description and Unit Measure
 |
| |
|
Climate: This quality of a land has two features that is used to represent it. They are temperature and Rainfall. The temperature is represented as “Temp” and the rainfall as “Rain”. They are measured in degree Celsius (°C) and millimeter (mm) respectively. Topography: This quality of a land has only a feature which is the slope and it is measured in percentage (%). It describes the landform upon which the crop is cultivated.Wetness: This quality of a land is used to indicate likely seasonal aeration constraint. Drainage is the land feature that is used to describe this quality for this study. Drainage: It is a nominal variable and it is made up of 5 values which are; well-drained (WD), moderately well drained (MWD), excessively or imperfectly drained (ED), poorly drained (PD) and very poorly drained (VPD).Soil physical properties: The soil physical properties are known to influence the root development. The properties considered and used are texture, depth and coarse fragment. The coarse fragment is measured in %, while depth is measured in cm.Soil Chemical Properties: is a quality of that land that is characterized by the chemical features of the soil. They are measured using the level of chemicals in the soil. This chemicals include Copper, Magnesium, Iron, Nitrogen, Phosphorus, Pottassium and the PH value.Nutrient Retention: This describes the ability of the soil to retain nutrient that is needed for the growth. The characteristics considered are base saturation and organic matter.
3.1.3. Data Collection of Variables Identified
The data used for the study was obtained from the Institute of Agriculture, Research and Training (IAR&T) Ibadan, a research station of OAU. The data were stored manually in the archive of the Department of Soil Science of the institute. A total of two hundred and fifty-two (252) records were contained in the data obtained. The data stored is a collection of several reports of land mapping activities carried out at several locations from different regions in the country. After the data was collected, it was then entered into Microsoft Excel Spreadsheet for easy processing. Figure 2 shows a screen shot of the record that has been entered into the excel spreadsheet. For the simplicity of classification, the target classes (output variable) were determined using 5 labels namely S1, S2, S3, N1 and N2. The target classes were assigned to each record to quantify the degree of suitability. Some of the records that were not originally classified were then classified by the soil scientist in other to ensure uniformity and easy processing.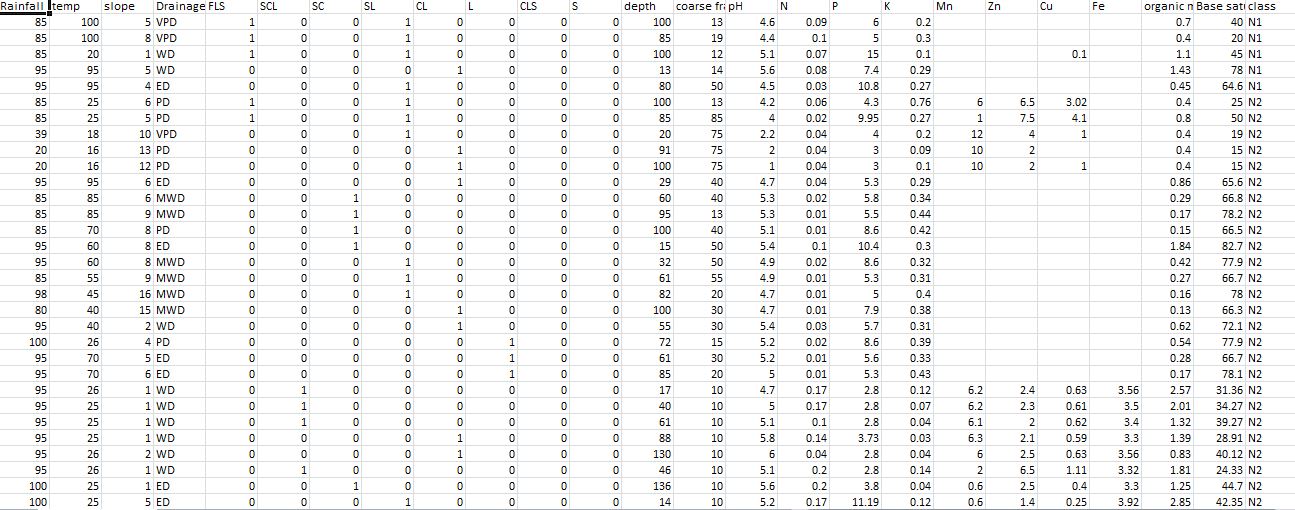 | Figure 2. Screenshot of the Sample Dataset |
3.2. Data Pre-processing
Data Pre-processing is a vital technique used in data mining process. Preprocessing data helps to change raw data into a understanble from so as to remove noise, missing values, and inconstitency. The pre-processed data helps to ensure positive behavior of the model. Missing values and important features are identified. They are discussed in the following sub-section.
3.2.1. Missing Values Handling
Following the data collection, some of the records in the dataset were found to contain missing values. The features that have missing values are Mn (96), Cu (60), Zn (96) and Fe (117). As a result of the negative effect of what heavy missing value can have on the accuracy of the prediction, the featuress with missing values above 50% of the entire data set were removed. Thus Fe was deleted from the data set, therefore reducing the attributes to sixteen. In this study, multiple imputation method was used to populate the missing values in the data set. The decision of using mean imputation method in the study is based on the percentage of missing values in the data set (>5%) and its overall effectiveness in improving the accuracy of classification algorithms.
3.2.2. Data Transformation
This is a very vital part of data pre- processing. It involves converting raw data into a format that is readable to the software. The study adopted Waikato Environment for Knowledge Analysis (WEKA) software for simulation and the file type understandable by the Software is either Comma Separated Values (CSV) or Attribute Relation File Format (ARFF). The data which were entered into the Microsoft spread sheet were then saved as a CSV file which is compatible with WEKA software.
3.2.3. Identification of Relevant Features
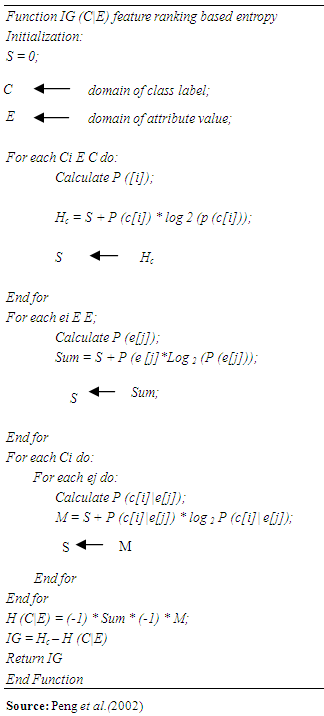
Identifying the important features for land suitability assessment is one important phase in data pre-processing. It involves selecting of important features. Identifying relevant variables that will improve the machine learning algorithm performance so as to reduce the model complexity. The implementation of feature selection was done in two ways: the spliiting algorithm was performed and the filter-based feature selection was also performed. In implementing the filter-based feature selection, the information gain method was used to measure the feature’s information gain in adherance to it's class. While for the decision tree algorithm, the attributes that were selected during the splitting and selected as the node and sub-node, were then identified as the relevant features and used as the attribute for the development of the model. The algorithm is presented in Algorithm 1.Algorithm 1. Filter Based Feature Selection Algorithm
 |
| |
|
Information gain feature selectionInformation gain feature selection was implemented using the information gain operator to calculate the weight, which calculates the importance of the features using the information gain and split criteria in assigning weights respectively. The columns are then ranked based on their feature weights; however the columns with the poor weights can be ignored. Information gain (IG) is used to measure the total amount of information about a class prediction. It is measured in bits.In other words, it helps to measure the reduction that is expected in entropy. Entropy is measure of uncertainty on any feature. Entropy is defined in Equation 1: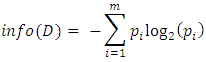 | (1) |
D is a sample of the dataset,  defines D's proportion which is dependent on class C (C =1,…,n), m is the possible outcomes from the dataset.
  entropy value is between 1 and 0.
  defines the information to group a tuple in D, it could also be defined as the entropy of D. After all this have been calculated, the expected information needed to group a tuple based on feature A partitioning is calculated.. This is specified as in Equation 2.
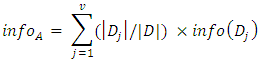 | (2) |
where  is part of D that contains a unique value for A while v is how many unique values are in A. Information gain measurement is the difference between the prior entropy and posterior entropy of the classes. This is as specified in Equation 3.
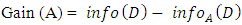 | (3) |
3.3. Formulation of Predictive Model
After identifying important features and pre-processing of data for land suitability assessment, the formulation of a predictive model was carried out using the recognized features. The classification is multiclass classification i.e. the classification that have more than two target variables as opposed to binary classification, which has just two target variables. This study is concerned with multi-classification. The models were developed using two supervised machine learning algorithms: Support Vector Machine (SVM) and J48 algorithm in decision tree.
3.3.1. Decision Tree Model
Decision trees are used in classification because of the attributes of understanding and visualization. Users of decision tree that do not have technical background about the model can follow the output of the decision tree and conveniently follow the decision flow. Chi-Square Automatic Interaction Detector (CHAID) decision tree, Classification and Regression Trees (CART), Iterative Dichotomiser 3 (ID3), C4.5 are the most popularly used decision tree. For this study, the WEKA implementation of C4.5 decision trees algorithm was used which is the J48 algorithm. The algorithm was continued on each subset of attributes never used before in order to construct a tree with each non-terminal node that represents the identified feature (land characteristics) where the dataset was split and the terminal nodes representing the class labels (suitability class) of the final branch. Assuming that X (e.g. Drainage) is an attribute and t ɛ T represents the set of labels assigned to X (e.g. labels assigned to Drainage are well drained, moderately drained, excessively drained, poorly drained and very-poorly drained). The Information Gain (IG) and Split Criteria used for the tree construction by the C4.5 is as shown in equation 4.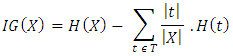 | (4) |
where: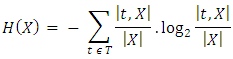 | (5) |
 | (6) |
Two (2) predictive models were developed. The developed models are: Decision tree without feature selection, decision tree + filter-based feature selection.
3.4. Simulation of Predictive Model for Land Suitability Assessment
Simulation is used to study the behaviour of a model so as to help in decsion making in order to implement such model for real life use. It plays a major role in science, technological advancement and industrial growth. The WEKA version 3.8.1 software was used as the simulation environment for developing the predictive model. WEKA works well with both numeral and nominal values. The explorer interfaces were selected in order to pre-process and classify the land suitability data set. The process began by loading the CSV file into WEKA explorer. The pre-process panel checked for errors in the CSV file loaded, if no error was found, it proceeds to the classify panel to select the classification algorithm to be used.
3.4.1. Model training and Evaluation Process
In other to develop the predictive model for land suitability, the collected dataset were used to formulate the model using the two supervised machine learning algorithms- Decision Tree and SVM. The Land suitability dataset were grouped into two sets: the first part for training and the other part for testing. The datset for training helped to formulate the predictive model while the dataset for testing helped to validate the predictive model. The error rate helps to calculate the perfromance of our classifier as it has been used in literature. Each instance of the classifier is predicted i.e. the land mapping activity containing factors that determine its suitability. The the prediction is correct that is a success while if the prediction is wrong, it is counted as an error. The proportion of errors made over the instances of the dataset is the error rate and it helps to calcuate the overall perfomance of the model. If there is a high error rate on the training dataset then it is a bad indicator for future performance of the predictive model; this is because the classifier was trained on the same training dataset. The performance of a trained classifier model can only be predicted using a new set of data that was not used in training so as to assess the error rate on the dataset, this dataset for testing is known as the test dataset which represent a sample problem that the training data intends to solve. It is of utmost importance that the dataset to be used for testing is not used for any part of the training dataset as machine learnings consumes the training dataset to understand the testing dataset.
3.4.2. Model Evaluation
The holdout method which allows a part of the dataset to be used as the testing dataset and another part be used as for the training was used in this study. Stratification, otherwise called stratified holdout for the purpose of this study, is important to endeavour that the sampling of the dataset is done in way that guarantees that each group is properly represented in the training and testing datasets. Although, stratification may provide a way to safeguard against the trainig and testing dataset to uneven represented, another way to reduce the biasness is to continously repeat the process with several samples randomly. For each of the iteration, a specific number is selected from the dataset for training and testing. Therefore, this study employed the the cross-validation approach, which involves grouping the datasets into a specific number of folds. The group used for testing was selected with the remaining k – 1 partitions used for training. The error rate at each iteration was stored and the mean of the error rates were recorded. The10-fold cross validation method was used in this study, it involves splitting the whole dataset into ten partitions. Figure 3 illustrates a 10-fold cross validation. The experiment began by dividing the data set into 10 folds, such that we had two hundred and fifty-two records and it was divided into twenty-five (25) and twenty-six (26) in each ten folds. For each of the folds, the records were selected with replacement in order to ensure that each of the record samples were represented in each of the folds. A total of ten runs were performed on the samples, for each run, the first twenty-five sample which is 10 percent of the whole data set, were used for testing while the remaining 90 percent were used for training. 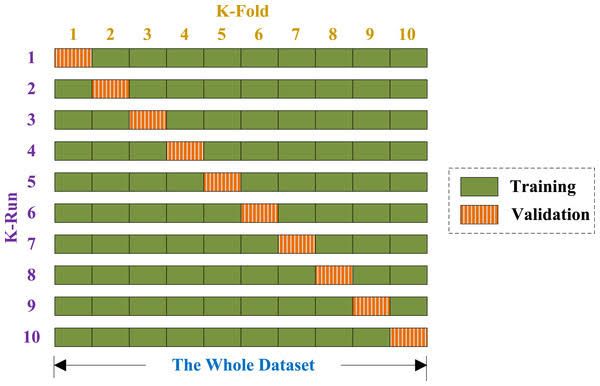 | Figure 3. 10-fold Cross-validation Process |
For the second run, the second twenty-five samples, which is also 10 percent were used for testing while remaining 90 percent which includes the first fold and the remaining eight folds were used for training. This process continued until it got to the tenth run and all the error rates were calculated.
3.5. Performance Evaluation Metrics
An evaluation metric is a tool used to measure the model performance. Accuracy, sensitivity and specificity were used to evaluate the model performance. In order to determine the performance of the model, four parameters of a confusion matrix would be used to measure the model performance.. These are: true positive (TP), true negative (TN), false positive (FP) and false negative (FN). Accuracy is a measure of the correctly classified instances of land suitability over the total number of land suitability. It can be mathematically expressed as in Equation 7.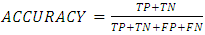 | (7) |
Sensitivity which is also known as true positive rate or recall is the measure of actual positive instances that were correctly identified. In this study, it measures the percentage of suitable land that are correctly identified as having the requirement for suitability. It can be expressed as in Equation 8.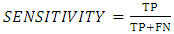 | (8) |
Specificity which is also known as true negative rate is a measure of the actual negative instances that would predicted as not positive. It can be expressed mathematically as in Equation 9.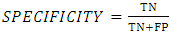 | (9) |
where:True positive (TP) is the number of positive instances classified as positive;True negative (TN) is the number of negative instances classified as negative;False positive (FP) is the number of negative instances classified as positive andFalse negative (FN) is the number of positive instances classified as negative.
4. Result and Discussion
In developing the predictive model, WEKA version 3.8.1 software was employed for the testing, training and simulation. WEKA works well with both numeral and numeric values. The J48 algorithm of decision tree was used for the generation of the rules.
4.1. Model Construction for J48 Decision Tree
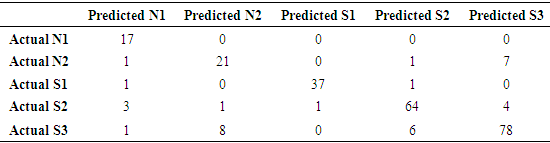
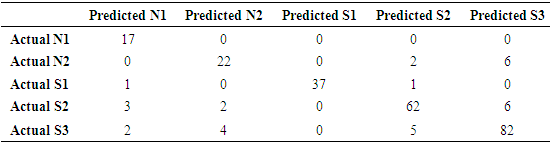
The dataset used for the study was initially preprocessed and converted to csv. Then the preprocessed data was trained. The reason for doing was to put the features of the dataset in an acceptable format for WEKA to classify. A filtering algorithm was used to preprocessed the dataset so as to remove unnecessary information, it was used to change the format of the data and selcet relavant attributes. Figure 4 shows the result of the preprocessed data. After the the pre-processing, J48 algorithm was used for the classification. J48 has been found to be very effective. It works by dividing the data item into different levels starting from the root node to the leaf node. The process continues until it gets to the terminal node, each non-leaf node signifies a decision on the data. Out of two-hundred and fifty-two instances, 220 instances (i.e. 87.30%) were found to be correctly classified while 32 instances (i.e.12.70%) were incorrectly classified. The results obtained are as shown in Table 4 and Table 5. Table 4 gives the number of correctly classified and incorrectly classified instance without feature selection while Table 5 gives instances correctly and incorrectly classified with feature extraction. The Decision Tree Models are presented in Figure 5 and Figure 6. Figure 5 is the decision tree with no feature selection while Figure 6 is the Decision Tree with filter-based feature selection.Table 4. Confusion Matrix for Decision Tree with 23 Attributes
 |
| |
|
Table 5. Confusion Matrix for Decision Tree with 16 Attributes
 |
| |
|
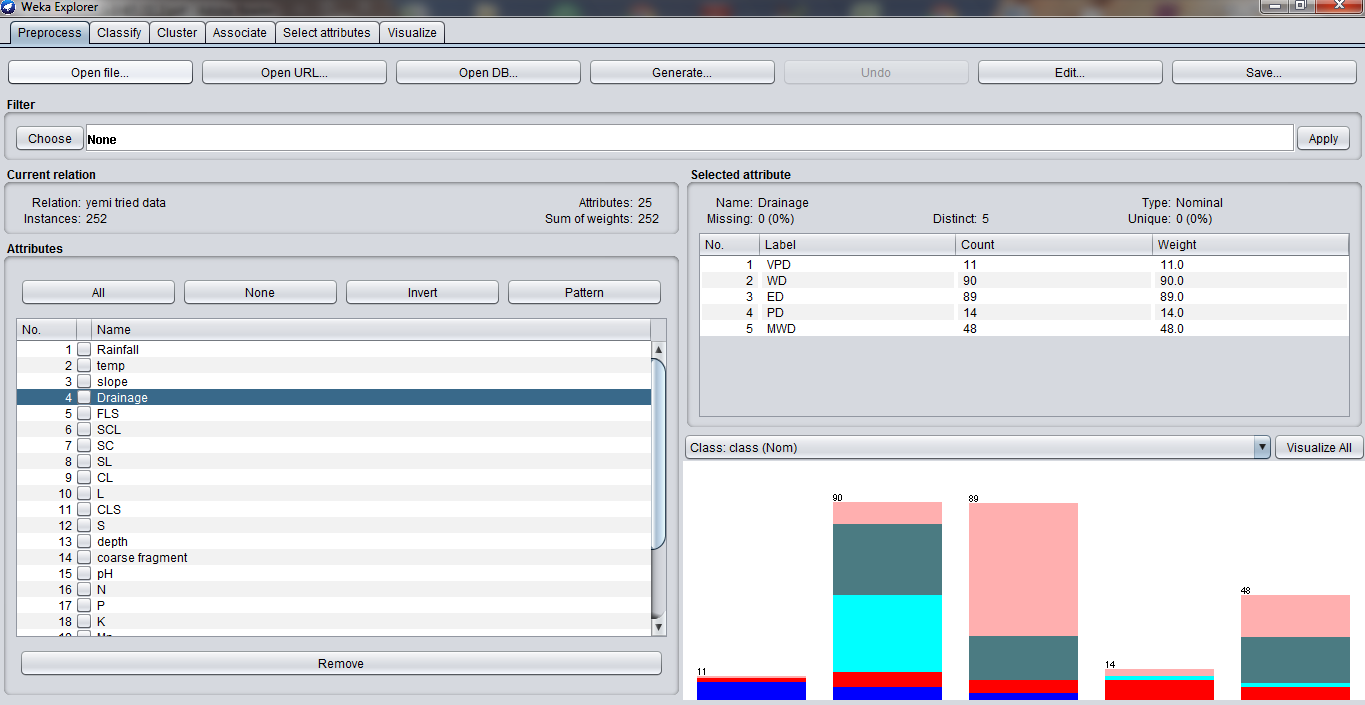 | Figure 4. WEKA Interface showing the Preprocessed Data |
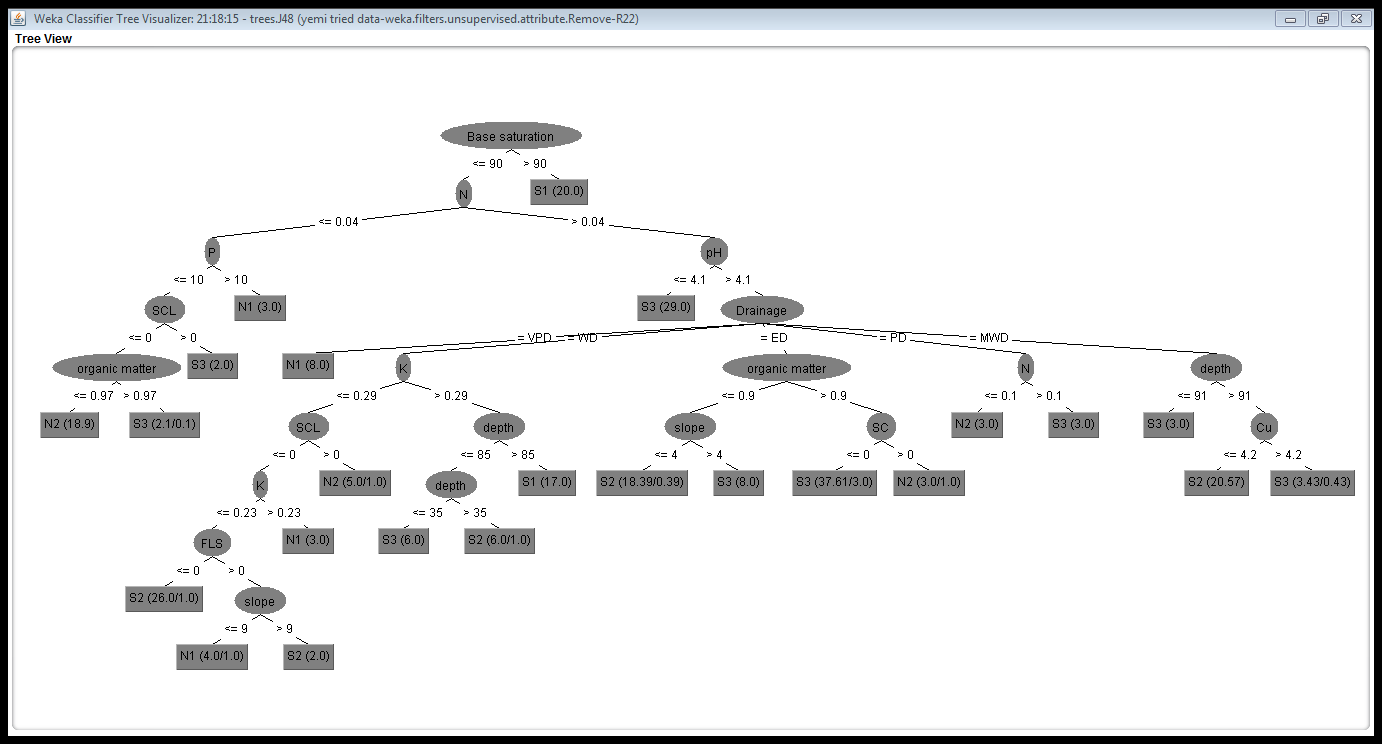 | Figure 5. Decision Tree with 23 Attributes (without Feature Selection) |
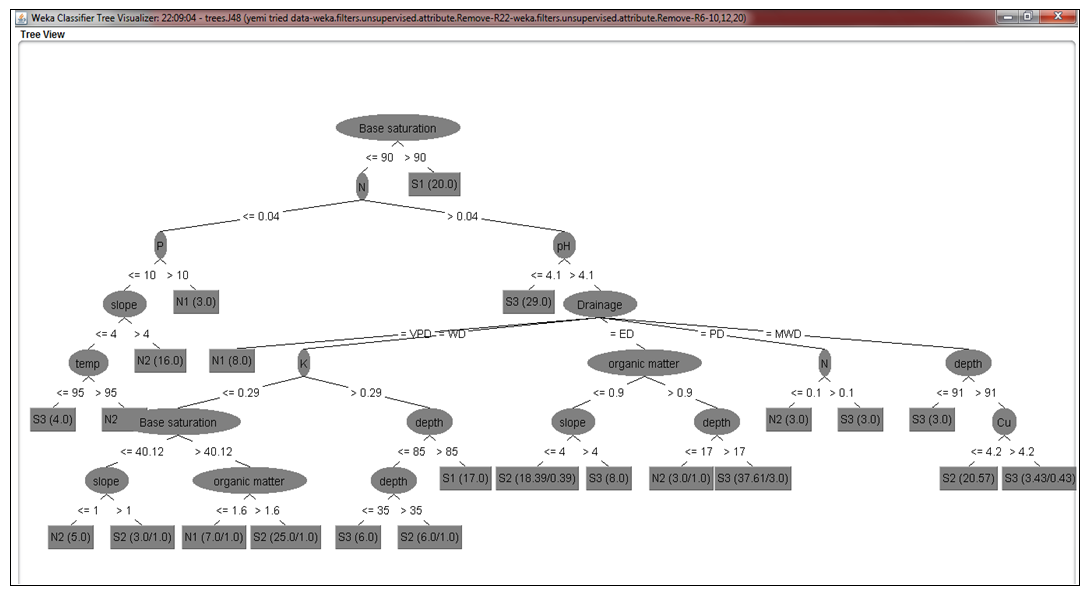 | Figure 6. Decision Tree with 16 Attributes (Decision Tree with filter-based feature selection) |
4.2. Knowledge Representation and Interpretation of Results
The preconditions are logically ANDed together. One rule is generated for each leaf. For the land suitability data, some of IF-THEN rules generated to classify suitability of land for cassava cultivation from the decision tree with 16 attributes are given as: IF base saturation <= 90 and N<=0.04 and P>10 THEN N1IF base saturation <= 90 and N>0.04 and pH>4.1 and drainage = VPD THEN N1IF base saturation <= 90 and N>0.04 and pH>4.1 and drainage = WD and K<=0.29 and base saturation>40.12 and Organic matter <=16 THEN N1IF base saturation <= 90 and N<=0.04 and P<=10 and slope >4 THEN N2IF base saturation <= 90 and N<=0.04 and P<=10 and slope <=4 and Temp >95 THEN N2IF base saturation >90 and N>0.04 and pH>4.1 and Drainage =PD and Organic matter <=0.9 and N<=0.1 THEN N2IF base saturation <= 90 and N<=0.04 and P<=10 and slope <=4 and Temp <=95 THEN S3IF base saturation <= 90 and N>0.04 and pH<=4.1 THEN S3IF base saturation >90 and N>0.04 and pH>4.1 and Drainage =ED and Organic matter <=0.9 and slope > 4 THEN S3IF base saturation >90 and N>0.04 and pH>4.1 and Drainage =MWD and depth >91 and Cu<= 4.2 THEN S2IF base saturation >90 and N>0.04 and pH>4.1 and Drainage =ED and Organic matter <=0.9 and slope <=4.0 THEN S2IF base saturation >90 and N>0.04 and pH>4.1 and Drainage =WD and K>0.29 and depth > 85 THEN S1IF base saturation >90 THEN S1
4.3. Evaluation of the Proposed Model based on Performance Metrics
The performances of the classifiers were evaluated using accuracy, sensitivity and specificity as stated earlier. The model had an accuracy of 87.3%, the sensitivity of 85.7% which measures the percentage of suitable land that are correctly identified as having the requirement for suitability, lastly, the specificity of the model was 96.5%, which is also known as true negative rate. It refers to the proportion of actual negative instances that are predicted to be negative.
5. Conclusions
In the light of this study, the aim of developing a model for land suitability assessment for cassava cultivation using predictive modelling was achieved. Having elicited knowledge on the factors required for the cultivation of cassava, formulated a predictive model and simulated the model on a digital machine, also evaluated the performance of the models. It can be concluded that, in order to accurately determine how suitable a land is for the cultivation of cassava, both soil and climatic factors should be considered.
References
| [1] | Olowojoba S.O., Kappo A.A., Ogbole J.O., Alaga A.T., Mohammed S.O., Eguaroje E.O. (2016). Land Suitability and Evaluation for the Production of Cassava in Akoko-Edo L.G.A. of Edo State using Geo-Technology Techniques. Greener Journal of Agricultural Sciences, 6 (2), 2276-7770. |
| [2] | Ambrose, A. Z (2016), Land Suitability Analysis for Cassava Cultivation in Southern Part of Adamawa State, Nigeria. Global Journal of Human-Social Science, 16(5): 2249-4600. |
| [3] | Shakoor M., Rahman K., Rayta S. N and Chakrabarty A. (2017). Agricultural Production Output Prediction Using Supervised Machine Learning Techniques. Institute of Electrical and Electronics Engineers (IEEE), 6(1): 94 -102. |
| [4] | Ramesh D. and Vardhan V.B. (2013). Data Mining Techniques and Applications to Agricultural Yield Data. International Journal of Advanced Research in Computer and Communication Engineering, 2(9): 3477-3480. |
| [5] | Dickey, D. A., (2012). “Introduction to machine learning with examples”, SAS Global Forum. Retrieved on: http://www.datascience.com/introduction to machine learning/ accessed on the 10th of March, 2018. |
| [6] | Van Rijmenam, M., (2013). From machine to crops to Animals: Big Data Turns Traditional farming Upside Down. Retrieved on: http://www.fertlizer.co.za/knowledge-center/technology/the-role-of-predictive- modelling-in-agriculture accessed on the 12th of April, 2018. |
| [7] | FAO. (2014). Food and Agriculture Organization of the United Nations - The State of food and Agriculture. FAO, Rome. |
| [8] | Oniya OO, Opadijo OO, Odedare KO, Oduyemi AT. (2009). Soil Suitability Analysis for Cultivation of Cassava in Ibarapa Central LGA: A GIS Approach. Japan: CIGR International Commission of Agricultural and BioSystems Engineering. p. 8. |
| [9] | Ogunkunle A. O., (2005). Soil Survey and Sustainable Land Management. Proceedings of the 29th Annual Conference of the Soil Science Society of Nigeria. |
| [10] | Carneiro, J.S., Leite R.C., Filho G.C, and Lima S.O. (2017). Agricultural Potential of Pasture Land in Southern Tocantins. J. Bioen. Food Science, 4(1): 50-60. |
| [11] | Gbadegesin A.S. (2010). Variation in soil properties on cassava production in the coastal area of Southern Cross River State, Nigeria. Journal of Geography and Geology, 3:94-103. |
| [12] | Kaur k., Ahluwalia P., and Singh H. (2016). Cassava: Extraction of Starch and Utilization of Flour in Bakery Products. Intl. J. Food. Ferment. Technol. 6(2): 351-355. |
| [13] | FAOSTAT (2014). World Production of Cassava. Rome, Italy: Food and Agricultural Organization of the United Nations. |
| [14] | Mokarram M, Hamzeh S, Aminzadeh F, Zarei AR. (2015). Using machine learning land suitability classification. West African Journal of Applied Ecology, 23(1): 63-73. |
| [15] | Fereydoon, F., Ali K, Azin R., Ghavamuddin Z., Hossein J. and Munawar I. (2014). Support Vector Machines Based-Modeling of Land Suitability Analysis for Rain-fed Agriculture. Journal of Geosciences and Geomatics, 2(4): 165-171. |
| [16] | Dahikar S.S and Rode S.V. (2014). Agricultural crop yield prediction using artificial neural network approach. International Journal of Innovative Research in Electrical, Electronics, Instrumentation and Control Engineering, 2(1): 40-56. |
| [17] | Adetunji, A.B., Ayinde, A.Q., and Akanbi C.O (2014). Predictive modeling for early maize planting months using j48 mining algorithm. American Journal of Scientific and Industrial Research, 5(2): 67-72. |
| [18] | Gholap J. (2012). Performance tuning of J48 algorithm for prediction of soil fertility. Asian Journal of Computer Science and Information Technology, 2(8): 251– 252. |
| [19] | Ogunde, A.O., and Olanbo, A.R. (2017). A Web-based Decision Support System for Evaluating Soil Suitability for Cassava Cultivation. Advances in Science, Technology and Engineering Systems Journal, 2(1): 42-50. |
| [20] | FAO (1976). Food and Agriculture Organization of the United Nations. FAO, Rome. |

 Abstract
 Reference
 Full-Text PDF
 Full-text HTML