José Gerardo Cárdenas Solis1, David Asael Gutíerrez Hernández1, Edgar Guevara2, R. Santiago-Montero1, María Trinidad Galván González1, Sergio Uribe López1, Rossana Rodríguez Montero1, J. M. Carpio1
1Tecnológico Nacional de México, Instituto Tecnológico de León, División de Estudios de Posgrado e Investigación, León, Guanajuato, México
2CONACYT- Universidad Autónoma de San Luis Potosí, Coordinación para la Innovación y Aplicación de la Ciencia y la Tecnología, San Luis Potosí, S.L.P., México
Correspondence to: David Asael Gutíerrez Hernández, Tecnológico Nacional de México, Instituto Tecnológico de León, División de Estudios de Posgrado e Investigación, León, Guanajuato, México.
| Email: |  |
Copyright © 2017 Scientific & Academic Publishing. All Rights Reserved.
This work is licensed under the Creative Commons Attribution International License (CC BY).
http://creativecommons.org/licenses/by/4.0/

Abstract
In this paper we present an analysis of data coming from a biological effect in a human body. The pupil reflex, as a reaction of a well-controlled light stimulus, is recorded with a digital camera configured to 30 frames per second. Ones the video is recorded; each frame is analysed, in order to register the diameter evolution with respect to the corresponding time of the taken frame. A vector of diameter changes and a vector of time are obtained. The correspondence between such vectors is plotted to identify the diameter behaviour along time. For this experiment, there were considered 6 individuals and two measurements for each one, one of them before breakfast and the other measurement 30 minutes after breakfast. Results indicate that, by means of computational ways, it is easy to mathematically characteristic a biological time series for a later reproduction for modelling purposes.
Keywords:
Pupil reflex, Biological time series, Mathematical approximation
Cite this paper: José Gerardo Cárdenas Solis, David Asael Gutíerrez Hernández, Edgar Guevara, R. Santiago-Montero, María Trinidad Galván González, Sergio Uribe López, Rossana Rodríguez Montero, J. M. Carpio, Polynomial Approximation of Time Series of Pupil Response to Controlled Light Stimuli, Advances in Computing, Vol. 7 No. 1, 2017, pp. 1-10. doi: 10.5923/j.ac.20170701.01.
1. Introduction
The pupil's response to light (dilatation and constriction) is controlled by the Ciliospinal center and the Edinger-Westphal nucleus, both branches of the Autonomous Nervous System (ANS). In a controlled environment with well-controlled and constant visual and luminous stimulus variables, the pupil may exhibit a random behaviour and this behaviour reflects the action of ANS [1], so the absence of response in pupil constriction to light indicate an afferent neuronal defect [2, 3].Pupillometry is a non-invasive, low cost and fast technique. It has been applied, for example, in the monitoring of the central cholinergic system [2]. Pupillometry consists in measuring the pupil's size and its behaviour. In previous investigations, according to references [4, 5]. The pupil, previously dilated, is stimulated by means of a single pulse of light to obtain a graph representing the behavior of the pupil upon contraction. Due to the characteristics of the camera, a four-parameter sigmoid profile curves adjustment is performed, which are accumulated in a database to later use this data to describe pupil behavior in people with diabetes [4] and Distinguish between clinically healthy and overweight groups of people, this, with the support of the k-means clustered.Thus, our interest in the short term is to be able to characterize groups of people with different characteristics between them and thus identify, for example, pathologies, neurological problems, physiological states, among others, by means of a reliable technique that allows us to parameterize Biological signals and extract information that helps us to reproduce or model mathematically a biological signal or biological time series of non-linear behavior, coming from different destinations.The study and analysis of time series is an important activity done in many scientific disciplines, like engineering, natural and biological sciences and industry. Generally, a characteristic that all the time series have on common is the high correlation between all the data points contented on them. This characteristic makes the difference between the kind of data under analysis. So, in this way, time series can be subjected to many mathematical and computational treatments like regression, trend seasonality and forecasting analyses that can be used to identify important factors or information that can represent a specific performance or a particular system or a special pattern that could exists within the data [6].The principal interest behind the time domain approach is based on the correlations and dependencies between the data points of the event, experiment or test under study in a time series. Techniques of time domain analysis use data points as parametric functions in order to get a mathematical or computational model of the system [7] that can be furthered repeatable for different purposes or applications.In biological time series, the correlation between data and time is not always a simple signal to be analysed. Working with the human world of non-lineal, non-periodical and no repeatable signals that the brain generates for any stimulus over the human body is a complex research that gives new information every day. This new information might then be used for expanding the acquired knowledge and understand, by this way, different topics in different fields of science.Biological time series data, by themselves, contain more information than data coming from well-controlled systems where an expected result is already predicted by different ways. Biological time series data cannot necessarily be evaluated with the commonly used methods of time series analysis, like autocorrelation and frequency domain techniques [8], instead, biological data are very sparse. Indeed, many time series consist of maybe a dozen quantities, measured at a handful of time points, and replicates are usually scarce [9]. This paucity of data, accompanied by minimal redundancy, immediately creates statistical challenges that have not been addressed in a systematic model of data treatment or in a specific way of computationally manipulation of biological data that can be always applied as a recipe that can always be followed.In this paper, we propose a methodology to extract information from the pupil reflex for future applications on medical diagnoses. This methodology requires of a combination of mathematical and statistical processes together to a computational analysis of the data to get an understandable meaning of the biological time series for researching purposes, in other words, we propose a method of extracting information from biological signals or time series that consists of the mathematical approximation of the signal to a polynomial function, which allows us to understand the signal acquisition, model and treat it mathematically for the purposes which our research suggests by performing actual tests on human bodies. The signals presented in this work come from stimulation of the pupil using 3 pulses of light with the intention of eliminating noise by situations beyond the control of the experiment, such as blinking and / or poor measurements.
2. Theoretical Description
For the development of this work some theoretical concepts must be considered. There are the following:
2.1. Hough Circle Transform
Hough circle transform is a technique for characteristics extraction that seek to find circular shapes of certain radius r in an image. This technique is based on the fact that a circle in an image is described by equation 1 where x and y are edge coordinates of the circular shape, a and b are the coordinates of the centroid of the shape and r is the radius of the same shape, as it is shown in [10] and [11].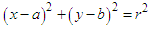 | (1) |
2.2. Wilcoxon Signed-Rank Test
The Wilcoxon signed-rank test is a non-parametric test that seek for differences between two groups of samples based on the magnitude of their ranges, examines the null hypothesis that both groups do not present a significant difference [12]. The test consists of:1. Get the differences between measures, differences equal to zero are eliminated and the number of elements decreases accordingly.2. Differences are taken as absolute values and are ranked starting from the smallest absolute difference assigned to this 1, in case of two or more differences were equal, the rankings are averaged to this absolute differences.3. Calculate the rank sum for the negative differences T- and for the positive differences T+.4. Select from T- and T+ the smallest value and take it as our test statistic T to prove our null hypothesis.The lower the value of T, the greater the value of evidence in favor of rejection of the null hypothesis [13].
2.3. Correlation Coefficient
The correlation coefficient is a measure of the independence between two variables x and y, and is given by equation 2, where  is the mean of all the
  and
and  is the mean of all the
  [14]. When the correlation is significant, the value of r is a way of representing its force [15].
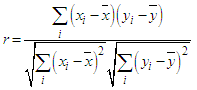 | (2) |
2.4. Least Squares
Least squares is a technique in which given a set of parried values we seek for a mathematical function that approximate to these values. This is achieved by minimizing the sum of the squares of the differences between the input data and the data generated by the proposed function. Equation 3 show how to calculate least squares where  is the input value and
  is the result of the evaluation of the proposed function [16].
 | (3) |
2.5. Mean Squared Error
The mean square error was calculated using equation 4 where n is the total number of points, x is the original value and  is the adjusted value.
 | (4) |
3. Experimental Setup and Results
For this experiment we used a pupilometer designed and developed in reference [17], which serves as an artificial vision system. This instrument has two arrays of leds, one of them in the infrared spectrum and the other one in red, within the visible spectrum. It has a webcam with which, in addition to recording the experiment, allows us to locate the instrument to have a better eye catching. All of this is controlled by a desktop application in which the lighting protocol is configured in addition to giving a real-time view of the experiment. Figure 1 shows a diagram of the artificial vision system.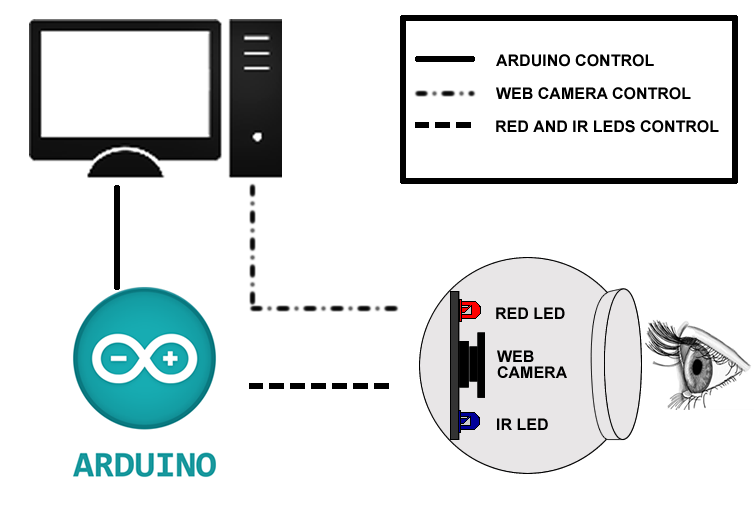 | Figure 1. Artificial vison system diagram |
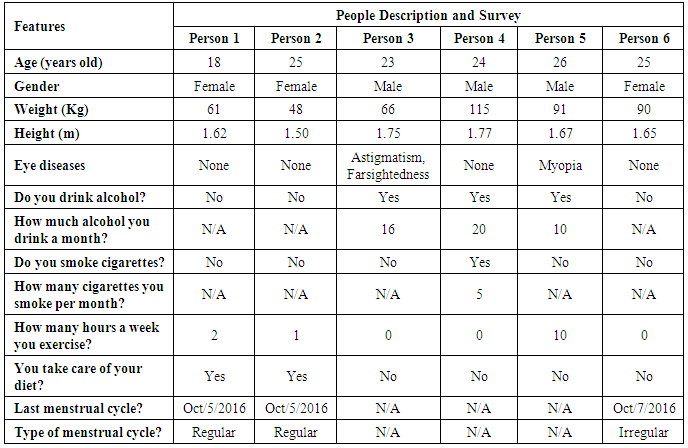
For this work, six individuals participate in the experiment, 3 masculines and 3 feminine, their average age is 23.5 years. They answered a brief questionnaire, where we ask about some habits and physiological processes that we suppose could influence the individual’s pupillary response as if they drink alcohol, smoke cigarettes, and if the women were in their period, these answers can help us to identify some factor that could affect the results of this experimentation, their answers are shown in table 1.Table 1. People Description for this Experiment
 |
| |
|
The experiment consists of stimulating the right eye’s pupil, with a protocol of illumination of three red pulses of light, each pulse has a duration of 2 seconds and a rest time between pulses of 2 seconds with infrared light illumination, we also record 2 second before the first pulse to calculate the Baseline Diameter (BD) and compare amplitudes. This lighting protocol is used following the recommendation of use long periods of illumination found in [18]. Samples taken from patients were performed under two conditions; Before their first meal and the second 30 minutes after eating food with the aim of comparing results, this samples were tagged as Sample 1 and Sample 2 respectively for everyone.Once the video of each experiment is obtained, it is processed frame by frame with the objective of measuring the change of the pupil diameter respect to the time during the experiment. To achieve this, first we extract one frame from the video (figure 2 A), then we convert it to grey scale next, to enhance the contrast we apply a Gaussian filter (figure 2 B and C), then we binarize the image (figure 2 D), after that we reverse the result and finally we fill the black holes of the resultant image (figure 2 E and F), that is to obtain a good result when we look for circular and bright shapes, then, through the circular transform of Hough, we proceed to find and identify this circular figures (figure 2 G), if there is more than one circle we select the centroid of the figure that is closest to the centre of the image in a 150 pixels area (figure 2 H).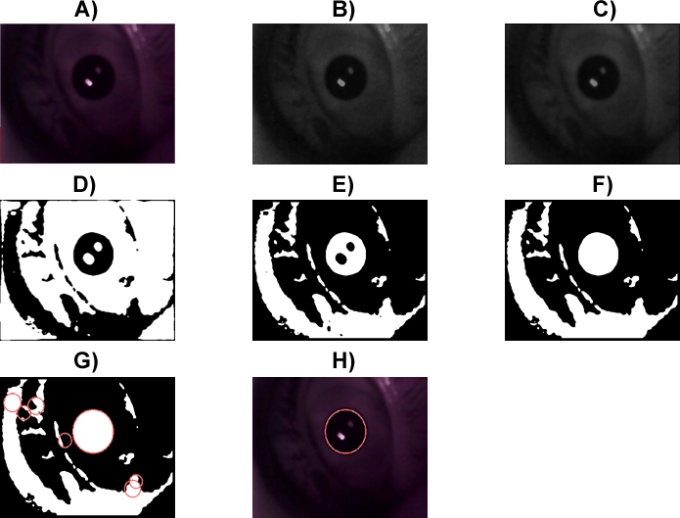 | Figure 2. Graphical representation of the methodology for pupil measurement |
These radios are stored in an array that at the end of the process will be saved in a text file. The results of pupil measurement are shown in Figure 3, on the other hand, in Figure 4 we can see a flow chart with the methodology used.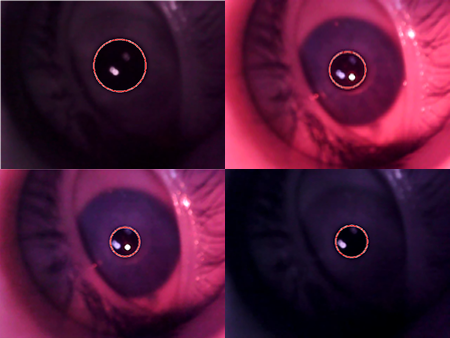 | Figure 3. Results of the methodology at different light wavelengths |
 | Figure 4. Flowchart of the methodology for pupil measurement |
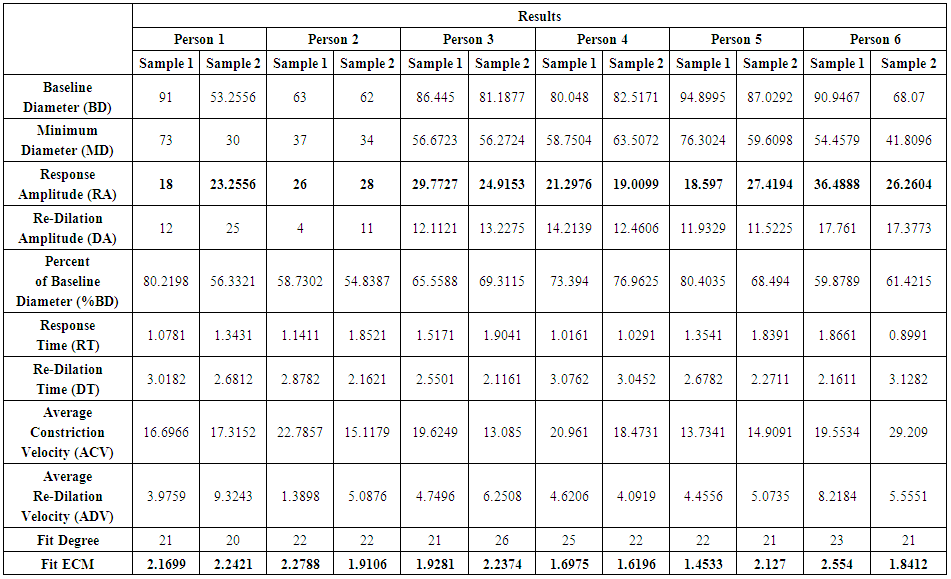
Once the text file with the pupil measurements is generated, features such as baseline diameter, minimum diameter, response amplitude, re-dilation amplitude, percentage of baseline diameter, response time, re-dilation time, average constriction velocity and average Re-dilation velocity, per [19]. These characteristics allow us to reduce the dimensionality of the problem, instead of comparing 104 average measurements per video, a standard of 9 characteristics is defined that completely describe the behavior of the pupil.To obtain a logical-mathematical understanding of the signal obtained and with the idea of being able to reproduce it for future technological applications, a polynomial was approximated as a function of time by means of the method of least squares. 3 types of simulated signals that approximate the behavior of the obtained signal and that could support the interpretation of the biological signal studied and from pupillary reaction to controlled stimuli were approached. These signals correspond to a periodic signal whose function is shown in equation 5, a sigmoidal signal according to equation 6, and an aperiodic signal represented in equation 7. | (5) |
 | (6) |
 | (7) |
Different degrees of polynomial approximation were evaluated, from grade 0 to grade 100. This interval was chosen because the samples had 104 points on average. The mean square error (MSE) was taken as the selection criterion, choosing the approximation that had the lowest MSE. The results of the approximations are shown in Figures 5 to 8.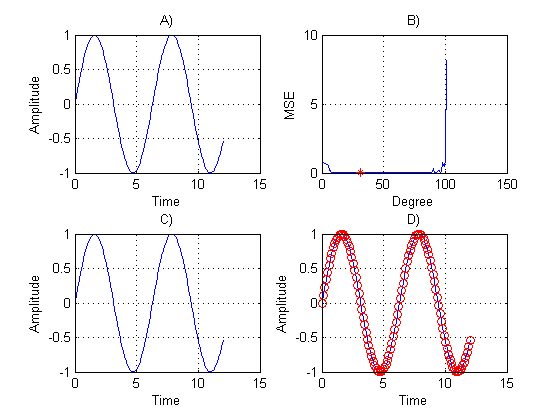 | Figure 5. Periodic signal (5). A) original data. B) MSE of each tested degree. C) Adjusted data to degree 31 with less MSE. D) Show how C) fits on A) |
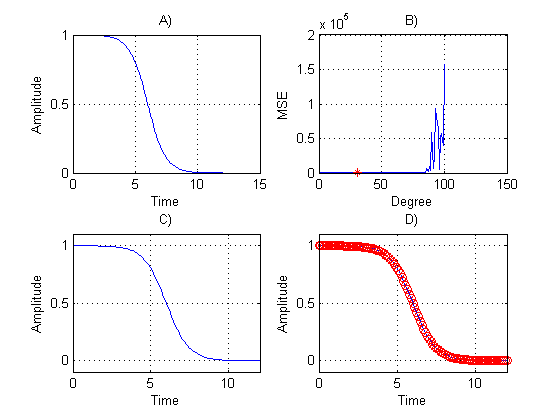 | Figure 6. Nonlinear signal (6). A) original data. B) MSE of each tested degree. C) Adjusted data to degree 31 with less MSE. D) Show how C) fits on A) |
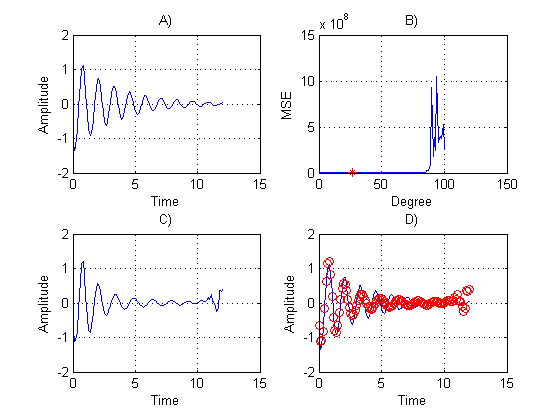 | Figure 7. Aperiodic signal (7). A) original data. B) MSE of each tested degree. C) Adjusted data to degree 27 with less MSE. D) Show how C) fits on A) |
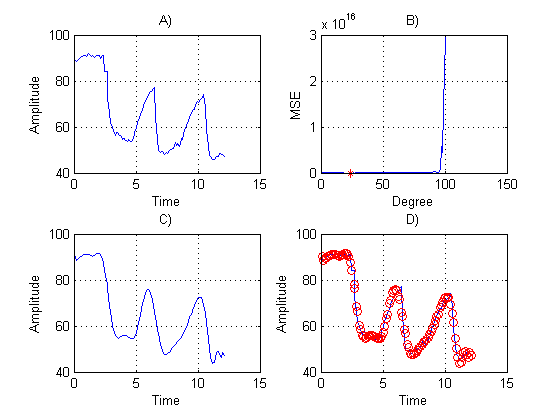 | Figure 8. Biological signal from person 6 sample 2. A) original data. B) MSE of each tested degree. C) Adjusted data to degree 23 with less MSE. D) Show how C) fits on A) |
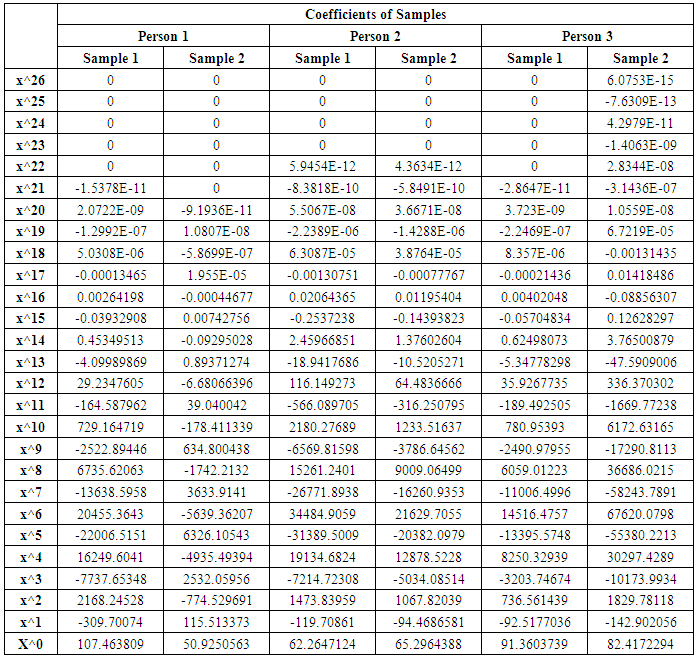
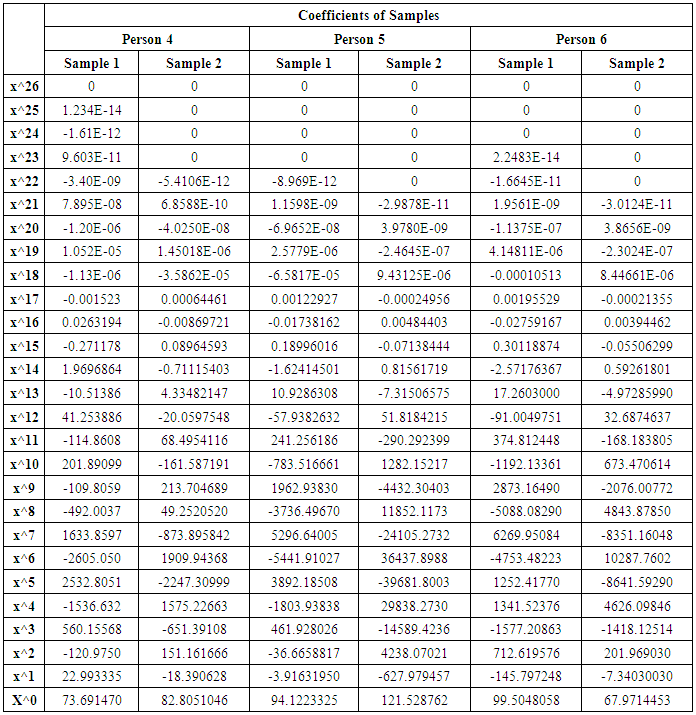
The coefficients obtained from each of the participants’ samples are shown in table 2, these represent the coefficients of a polynomial of the form shown in equation 8, and in table 2 are represented as column vector in which the first row represents  , the second row represent
  and so on. This form of representation was chosen by the length of the coefficients and the polynomials.
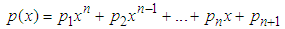 | (8) |
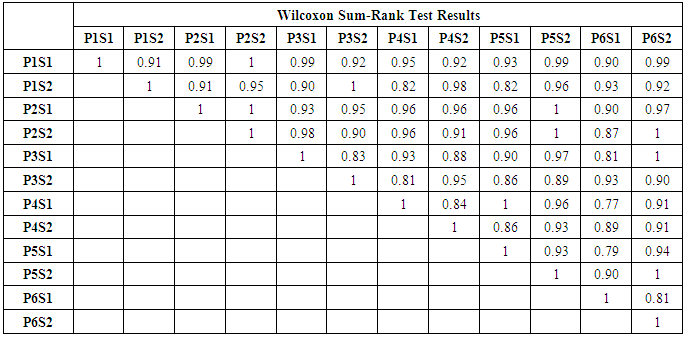
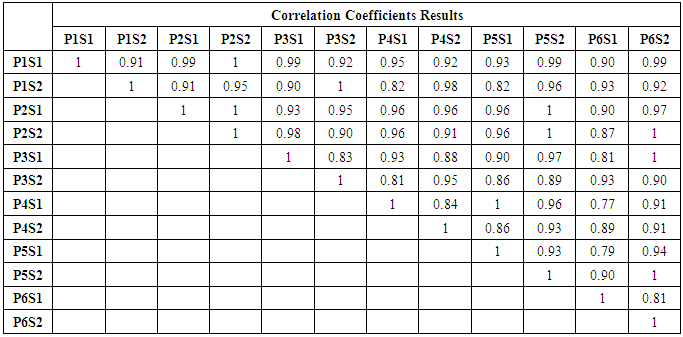
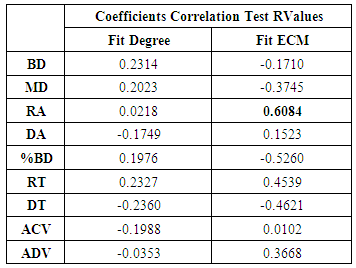
These coefficients obtained from the participants’ samples were compared using Wilcoxon rank sum tests with the aim of identifying significant differences between them using a significance level of 0.05, the P values obtained are shown in Table 3, as can be seen in this table there is no statistical evidence to reject the null hypothesis that there is not a significant difference between them. Also, these coefficients were compared with a coefficient correlation test as shown in Table 4, they shown a positive correlation. We compare the degree of the best approximation, the ECM of the same approximation versus the extracted characteristics of each sample with a coefficient correlation test, this to see if there exit any correlation between them, table 5 show the values compared in this test. Table 6 show the results of the coefficients correlation test in which Response Amplitude (RA) and ECM, shows a stronger correlation.Table 2. Coefficients of Samples Obtained from Least Squares (Persons 1 to 3)
 |
| |
|
Table 3. Coefficients of Samples Obtained from Least Squares (Persons 4 to 6)
 |
| |
|
Table 4. PValues from Wilcoxon Sum-Rank Test, in the Headers P is Person and S is Sample
 |
| |
|
Table 5. Correlation Coefficients of Samples
 |
| |
|
 | Table 6. Correlation Results between Extracted Characteristics and Fit Degree and Fit MSE |
Table 7. Coefficients Correlation Test Results from Table 5
 |
| |
|
4. Discussion
It was found that a biological time series obtained from the pupillary response to controlled light stimuli, which represents the photomotor reflex, can be approximated to a polynomial of degree 26 without losing the physiological properties that by its nature has. Other methods of data adjustment were not tested given the good results of the proposal. In tables 6 and 7 it was found that the amplitude of the response and the mean squared error of the fit have a relation between them, it means that, the greater the difference between base diameter and minimum diameter, called frequency amplitude, the mean square error is greater. This might suggest performing another type of mathematical treatment to lessen that error and improve results.We can also conclude that the method proposed in this work will be perfectly adapted to any biological time series response with the intention of modeling it for future interpretations.
ACKNOWLEDGEMENTS
Authors would like to acknowledge to CONACYT, TecNM, Instituto Tecnológico de León and PRODEP, for their support to this research. This work gets part of the postdoctoral project of David Asael Gutiérrez Hernández at CENID.
References
| [1] | L. Mesin, A. Monaco, and R. Cattaneo, “Investigation of Nonlinear Pupil Dynamics by Recurrence Quantification Analysis,” BioMed Research International, vol. 2013, Article ID 420509, 11 pages, 2013. doi:10.1155/2013/420509. |
| [2] | D.F. Fotiou, V. Stergiou, D. Tsiptsios, C. Lithari, M. Nakou, A. Karlovasitou. Cholinergic deficiency in Alzheimer's and Parkinson's disease: Evaluation with pupillometry. International Journal of Psychophysiology 73 (2009) 143–149. |
| [3] | David Asael Gutiérrez Hernández. Exploración neurológica por técnica óptica no invasiva en modelo de color RGB. Innovación y Desarrollo Tecnológico Revista Digital (2013), Volumen 5, Numero 1. |
| [4] | Sergio Uribe López, David Gutierrez, Julio Cesar Estrada Rico, Victor Manuel Zamudio, Luis Ernesto Mancilla Espinosa, Maria Trinidad Galván González and José Gerardo Cárdenas Solis (2017). Identification of parameters for the study of diabetes from light reflex with controlled stimulus. 27th International Conference on Electronics, Communications and Computers, Puebla, México. February 2017. In press. |
| [5] | Maria Trinidad Galvan Gonzalez, David Gutierrez, Edgar Guevara, Victor Zamudio, Carlos Lino, José Gerardo Cárdenas Solís and Sergio López (2017). Analysis of pupillary response after a stimulus of light to generate characteristical groups. 27th International Conference on Electronics, Communications and Computers, Puebla, México. February 2017. In press. |
| [6] | SHUMWAY, R. H. & STOFFER, D. S. (2000) Time series analysis and its applications, Springer Verlag. |
| [7] | MADSEN, H. (2008) Time series analysis, CRC Press. |
| [8] | BRILLINGER, D. R. (2001) Time series: data analysis and theory, Society for Industrial Mathematics. |
| [9] | Statistical Inference Methods for Sparse Biological Time Series Data Juliet Ndukum, Luís L Fonseca, Helena Santos, Eberhard O Voit, Susmita Datta BMC Syst Biol. 2011; 5: 57. Published online 2011 Apr 25. doi: 10.1186/1752-0509-5-57. |
| [10] | T. Atherton and D. Kerbyson, «Size invariant circle detection», Image and vision computing, vol. 17, pp. 795-803, 1999. |
| [11] | H. Liu, Y. Qian and S. Lin, «Detecting persons using Hough circle transform in surveillance video», VISAPP 2010 - International Conference on Computer Vision Theory and Applications, pp. 267-270, 2010. |
| [12] | W. Dubitzky, O. Wolkenhauer, K.-H. Cho and H. Yokota, Encyclopedia of Systems Biology, Springer, 2013. |
| [13] | D. D. W. W. M. I. and R. L. S. , Estadísitica matemática con aplicaciones Séptima Edición, Cengage Learning, 2010. |
| [14] | R. Fisher, Statistical Methods for Research Workers, 13th Ed., Hafner, 1958. |
| [15] | W. T. S. V. W. a. F. B. Press, Numerical Recipes in C, 2nd Ed., Cambridge University Press, 1992. |
| [16] | D. G. W. Douglas M. Bates, Nonlinear Regression Analysis and Its Applications, Wiley, 2007. |
| [17] | Gutiérrez Hernández D A, et al. Digital Measurement of the Human Pupil's Dynamics under Light Stimulation for Medical Applications and Research. American Journal of Biomedical Engineering. 2013; 3(6):143-147. |
| [18] | Ross, Brian H., ed. The Psychology of Learning and Motivation. Amsterdam: Academic Press, ©2014. |
| [19] | Canver, M., Canver, A., Revere, K., Amado, D., Bennett, J. and Chung, D. (2014). Novel mathematical algorithm for pupillometric data analysis. Computer Methods and Programs in Biomedicine, 113(1), pp.221-225. |

 Abstract
 Reference
 Full-Text PDF
 Full-text HTML