-
Paper Information
- Next Paper
- Paper Submission
-
Journal Information
- About This Journal
- Editorial Board
- Current Issue
- Archive
- Author Guidelines
- Contact Us
Advances in Computing
p-ISSN: 2163-2944 e-ISSN: 2163-2979
2013; 3(2): 11-21
doi:10.5923/j.ac.20130302.01
Graph-Based Image Segmentation Using Imperialist Competitive Algorithm
 Abstract
 Reference
 Full-Text PDF
 Full-text HTML
Hodais Soltanpoor, Majid VafaeiJahan, Mehrdad Jalali
Department of Computer Engineering, Islamic Azad University, Mashhad, Iran
Correspondence to: Majid VafaeiJahan, Department of Computer Engineering, Islamic Azad University, Mashhad, Iran.
| Email: |  |
Copyright © 2012 Scientific & Academic Publishing. All Rights Reserved.
Image processing includes several steps that segmentation is the most important step of the procedure. Segmentation is the phase in which inputs get separated into their components that assign long time. One of the most basic methods of segmentation is presented by graph theory. According to the theory, each node in a graph is a representative of a pixel in the picture and each edge joint's adjacent pixels. Weight corresponding to each edge is based on some properties of primary and terminal pixels of the edge. On the other hand, graph partitioning refers to graph nodes categorization to two or more parts based on certain criteria. Up to now image segmentation is performed by optimized techniques such as genetic algorithm, ant colony, … statistics and graph-based methods. In this article, to resolve the issue of image segmentation, input image converts to graph after initial pre-processing. It obtained graph is partitioned with imperialist competitive algorithm, and the amount of crossing edges optimizes through the graph. Afterwards, this graph applied to the image. Therefore, it divides into sections. Berkeley Segmentation Dataset images have been utilized in order to survey the resulting solution. Statistical results indicated that in approximately 90% of cases. The imperialist competitive algorithm has achieved better results.
Keywords: Imperialist Competitive Algorithm, Graph Partitioning Problem, Image Segmentation Problem
Cite this paper: Hodais Soltanpoor, Majid VafaeiJahan, Mehrdad Jalali, Graph-Based Image Segmentation Using Imperialist Competitive Algorithm, Advances in Computing, Vol. 3 No. 2, 2013, pp. 11-21. doi: 10.5923/j.ac.20130302.01.
Article Outline
1. Introduction
- Segmentation is one of the fundamental steps of image processing that divides images to separated regions so that each region is a set of connected adjacent pixels. The purpose of segmentation is to decompose an image to significant and convenient regions. Application of image segmentation includes medical images in locating tumors and other injuries, measuring tissue volume and diagnosis, as well as locating objects such as roads, jungles, etc. in satellite pictures, face recognition, finger detection and machine vision[1],[2]. So far, many techniques have been performed for image segmentation, including statistical, fuzzy clustering, optimization and graph-based methods[3]. Statistical methods are highly efficient but expensive. fuzzy clustering methods have good performance but its efficiency drastically reduces in images with noises[1].In optimization techniques, image segmentation is performed by evolutionary algorithm e.g. genetic algorithm, ant colony[4],[5], tabu search etc that each method has advantages and disadvantages of its own.Graph-based methods have been used effectively for image segmentation and are so efficient. In this procedure, the image models on a weighted undirected graph. Image pixels form graph nodes, and every adjacent node connect to each other by an edge, then it partitions to several parts according to certain criteria[6]. Among this criterion's different graph partitioning methods can be pointed such as minimum cut, normalized cut and isoperimetric cut and also optimization techniques, including genetic algorithm, ant colony, tabu search and simulated annealing.Graph partitioning has various applications in modeling in different issues, e.g. transport network, electrical circuit, internet network and Scheduling problem. The most important use of graph partitioning is in image segmentation [1].Graph partitioning problem is categorized as Np-Hard[7]. Since image segmentation can be reduced to graph partitioning[8] therefore it is also a NP-H problem. So a solution to graph partitioning issue can be applied for image segmentation as well.Purpose of this article is to compare graph partitioning methods and their performances in image segmentation.The second part discusses graph partitioning issue and the history. Third part is about image segmentation, and fourth part indicates graph-based image segmentation. Imperialist competitive algorithm (ICA) is introduced in fifth section. In the sixth part recommended methods, and problem-solving steps are represented and the final section reviews the results and recommendations.
2. Graph Partitioning Problem
- Graph partitioning refers to graph nodes categorization to two or more parts based on certain criteria e.g. nodes location, value (pixel density in image segmentation) or their connections. Graph cutting is used to partition the graph.Graph partitioning problem is defined as follows:An undirected graph
 is presumed.
  stands for set of nodes and
  for weighted edges. Graph partitioning divide the graph to
  nodes subsets as
  . So that: 1.
 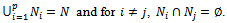 2.
2.  stands for total weight of nodes in
  3. Cut size means to minimize total weight of crossing edges through subsets.Each set
  is identified as a
  partitioning from
  (so each
  is a part of partition) if it meets first condition. Graph bisection is a two part partitioning. If a partitioning meets the second condition, it would be a balanced one (graph nodes separation to approximately equal sections)[9].Based on previous definitions, cost function is defined as follows:
 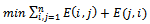 | (1) |
3. Image Segmentation
- In machine vision, segmentation is the process of portioning image to components and its purpose is to decompose an image to significant and convenient regions and also extract a specific object from image[1].Segmentation is the first and most significant step in image analysis (often motions to estimating or detecting boundaries or locating objects). Segmentation separates an image to components that each area is called a tissue. Each tissue can display an object, piece of it or a part of the background. Segmentation algorithm for monochrome images generally bases on one or two basic properties of grey level value: discontinuity and similarity. First method separate the image based on abrupt changes in grey level (points, edges, separate and distinct lines).While the second method is based on threshold, region growing, splitting and merging areas[16].
4. Graph-based Image Segmentation
- Graph-based image segmentation methods, show the problem as G (N,E) graph, so that each node in the graph is a representative of a pixel in the image and each edge joints adjacent pixels. Weight corresponding to each edge is based on some properties of primary and terminal pixels of the edges.In the first graph-based methods, a threshold and local measuring was used for calculating the segmentation. Zahn stated segmentation based on graph minimum spanning tree. This method is used both for clustering points and image segmentation. For image segmentation in graphs methods, weight value, is based on intensity difference but in point clustering methods, it is based on distance between points[17].Based on graph formulation there is two techniques for image segmentation: 1. Area-based methods: in this procedure each node indicates set of connected pixel in image. 2. Pixel-based method: in this system, each node is a representative of a pixel in image[18].Generally in area-based method e.g. watersheds an input image is got over-segmentation. This image is modeled by region adjacency graph that adjacent regions integrate to reduce the number of districts as long as a significant division is done. This method doesn’t perform appropriately in all cases in image segmentation for complicated image with detached objects.Pixel-based methods perform in very low levels and categorize pixels according to a preset similarity criterion. These methods create an undirected weighted graph from input image that each pixel considers as a graph node and each pair of connected pixels as weighted edge. This fact indicates the possible association of two pixels to an object. In the first estimate, the graph was considered as a complete one. Obviously this is not appropriate for high or medium resolution images. Due to this fact complete graph issue seems impossible for the matter. To simplify the problem edges are assumed just between pixels which are so close together. In pixel-based methods, segmentation criterion is according to similarity criterions. Generally these methods are based on graph partitioning with optimizing cut value instead of merging adjacent regions[18].
5. Imperialist Competitive Algorithm
- Imperialist competitive is a modern evolutionary algorithm in evolutionary calculation based on humans’ political-social developments. This algorithm begins with a random initial population which is called country. A number of countries, best in population, is selected as imperialist and the others are their colonies[19]. Imperialists attract colonies in a particular process. Entire power of each imperial depends on imperialist countries and their colonies.Imperialist competition begins with the advent of primary imperials. An imperialist would be omitted from competition if it cannot increase its power. So in this competition great imperialist become more powerful and weaker ones get demolished. imperialist need developing their colonies to fortify. Gradually the power of colonies converges to imperialist. Finally it leads to a united imperialist with colonies similar to imperialist in terms of its position[20].
6. ProposedMethod
- In this method, at first the image converts to a grayscale one, becomes minimized and a binary image. And then image graph is created and the difference between pixels illumination is calculated based on tetra neighborhood. After this stage ICA parameters is defined and the graph partitions. The output of this step is the input image that is separated to background and the object. All stages are explained in detail in the following sections:
6.1. Image Conversion to Graph Based on 4-connected Scheme
- In the first step, image becomes grayscale and minimized then changes to binary mode. After that, input matrix alternates to ICA from this image. As it is defined in fourth section, to create the graph of a image, each pixel is considered as a node in the graph. The graph which is designed for this problem has omitted column from left and right and rows from top and end of image which means omitting the sharp edges of the image and tetra neighborhood is created for the pixels. As it is shown below in 4-connected scheme of graph of image first rows of edges have tri neighborhood and the corners are bi neighbor. To resolve the bi or tri neighborhood problem, first and last rows and columns get omitted.The program is cellular. It is possible to save a matrix in each element of the cell instead of numbers. Matrix
 is the output and its layout is as follows:
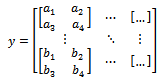 | (2) |
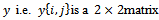 . This matrix represents pixel difference with its neighborhood. Figure 1 shows this content:
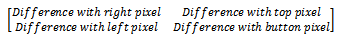 | Figure 1. pixel difference in 4-connected scheme |
 the dimension of matrix
  would be
 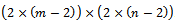 . It means:
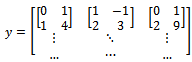 | (3) |
 is created as follows:
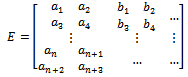 | (4) |
6.2. Initials the Empires
- Matrix
 is the input of the problem. This algorithm moves colonies and imperialists according to defined cost function on graph matrix. As mentioned before each element of matrix
  is a
is a  matrix. These vectors move unless the cost function becomes minimized.
6.3. Assimilation colonies
- In this phase the distance
 between each colony and emperor is calculated and the next location is achieved by multiplying this distance quantity and a random amount:
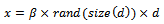 | (5) |
 cost amount is calculated and new location is saved.According to initial research
  amount for problems which have been solved by this algorithm was a number between 1 and 2. To implement image segmentation issue, best amount is 1.5.
6.4. Revolution
- In this step colonies are changed with probability of revolution which is revolutionary coefficient that here is 0.1; a colony is changed completely or with some preserving features (to save the variety and break local minimums).
6.5. Compute the Total cost of All Empires
- The total power of an empires is consist of the total cost of the imperialist country and also a percentage of the average of its colonial power. In this implementation 10% of colonial cost average considered effective in calculating the whole cost of empires.
6.6. Imperialistic Competition
- In this step the weakest imperial and colony are extracted. The weakest colony that has the most cost function is selected and transfer to other imperials by roulette wheel. The colony is transferred to any imperial that this wheel specifies its number. It is important to know that stronger imperials are more possible in this cycle. If the number of colonies in any imperial becomes invalid, it converts to a colony and the imperials numbers decrease.
6.7. Algorithm Stop Condition
- Two conditions are: 1. Number of decades 2. Number of imperials. Algorithm terminates by establishing each of these conditions. In first condition, algorithm adjourns if decades maximize. In this implementation maximum decades are 200. In second condition if imperial numbers decrease to one algorithm is met the termination condition. Maximum of imperials is defined as 50.
6.8. The Quality Measuring of Output Images
- Most of image processing is qualitative. Image resolution could be a standard for observer to discern the quality of images. The simplest and most widely quality standard is mean square error that is calculated by finding the mean square of pixel intensity of differences between original image and the distorted one with peak signal-to -noise ratio. These standards are used due to their simple calculation and suitability of mathematical optimization. However they have no homology with the visual quality[21],[22].
6.8.1. SSIM Criterion
- In[23] SSIM was introduced for evaluating the image quality standard. This method was designed to improve classic methods e.g. MSE and PSNR. In these standards human’s visual system is not considered; due to this fact all pixels have similar role. While pixel values effect differently on human’s vision according to their location in picture. The difference between SSIM and other methods is that perceptual errors are met by classic methods while this standard considers the distorted image as an image with changes in structural information. Structural information is an idea that image pixels are very affiliated, especially in close distances. These dependencies have significant information about structure of objects in visual scenes[24],[25].This criterion is measured on different frames of picture. Measurement between two frames
 and in
  size is as follows[25]:
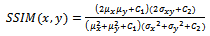 | (6) |
 respectively stand for mean of
  and
and  also
also  are their variances. The constants
  are calculated as follows:
 | (7) |
 Practically measurement of total quality of image is needed. Mean SSIM is calculated to achieve this goal:
  | (8) |
 is basis image and
  is the output image of every compared algorithm.
  are the contents of the
  local view and
  is the number of local views in image.If one of the compared pictures had been considered as an excellent quality image; MSSIM can be considered as measuring the quality of other image. If both are exactly the similar then
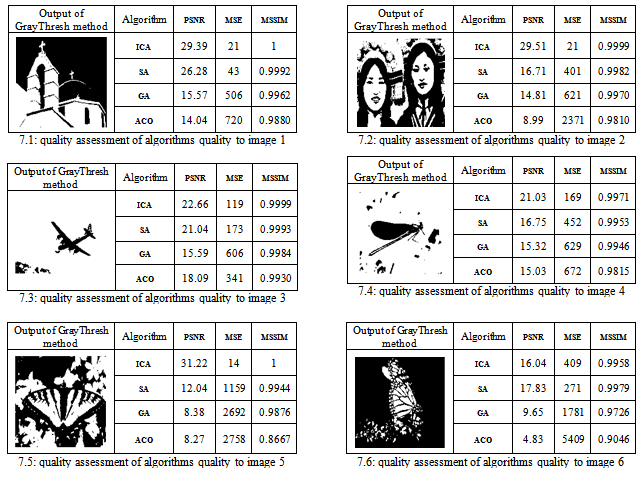
  [23].To use this criterion for comparing the output quality of recommended method with other studied algorithm, GrayThresh method is considered as basis. This technique provides the best threshold for converting image to binary mode. So background and object perfectly get separated. Thus it can be an appropriate standard to compare the outputs to discussed methods in this category.
6.9. Problem Solving Step
- Figure 2 shows a flowchart of the method in solving the problem.
7. Experimental Results
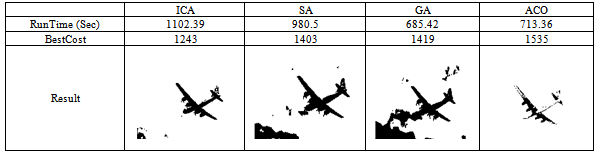
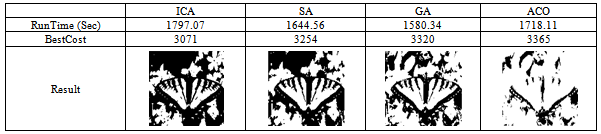
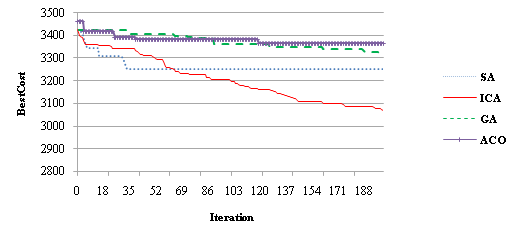
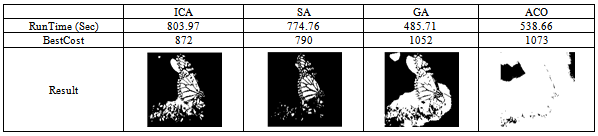
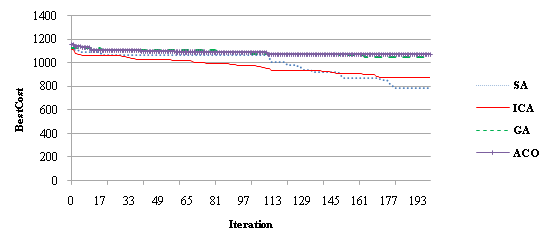
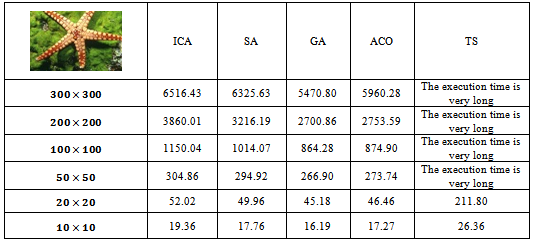
- In this section, the results of ICA are compared with ant colony, annealing simulation and genetic algorithm. The entire mentioned algorithms are implemented in system by 253GHz processor, core i5, 4GB RAM and in MATLAB program. Results chart are plotted in Excel software. Berkeley dataset image segmentation are used for program input that are shown in figure 3[26].
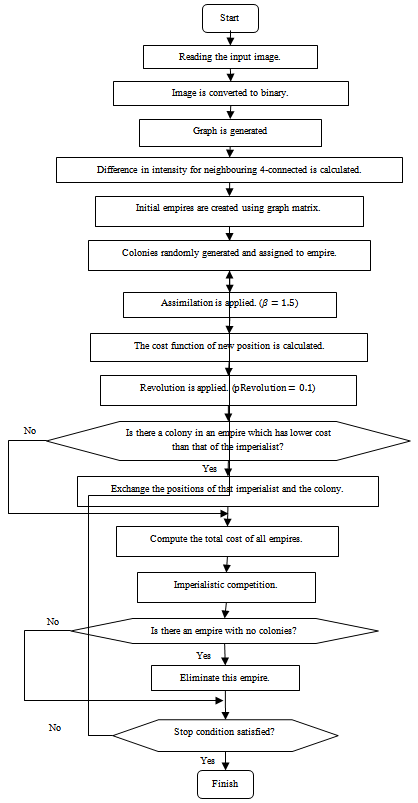 | Figure 2. Flowchart of resolving the image segmentation problem by graph partitioning based on ICA |
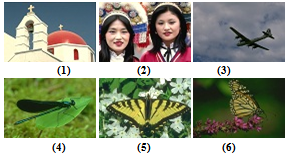 | Figure 3. Berkeley dataset |
|
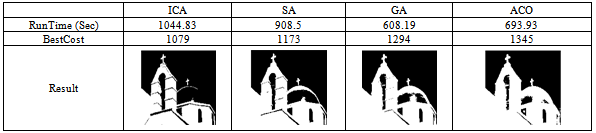
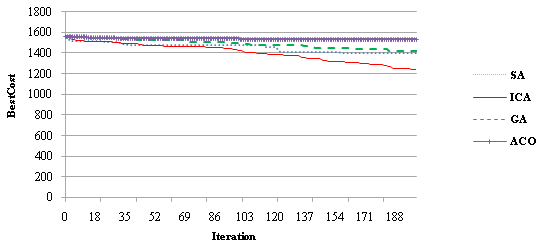
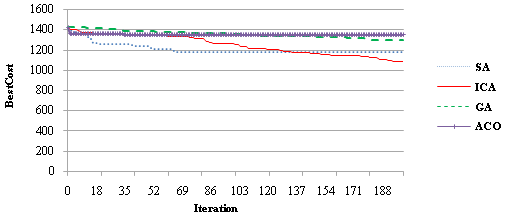 | Figure 4. comparing the different algorithm to find the best answer of each generation of image 1 |
|
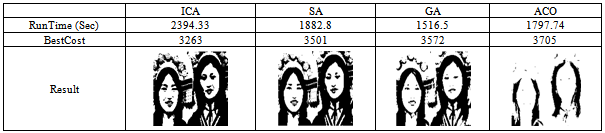
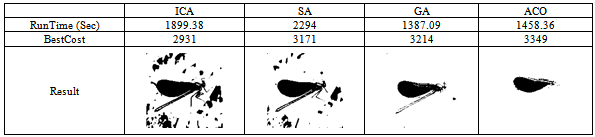
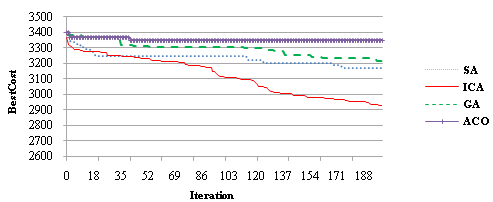
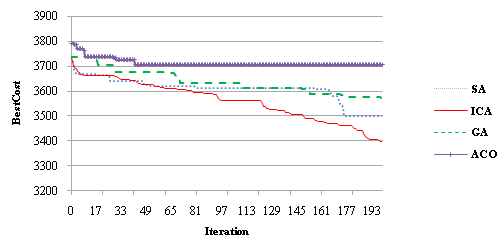 | Figure 5. comparing the different algorithm to find the best answer of each generation of image 2 |
|
 | Figure 6. comparing the different algorithm to find the best answer of each generation of image 3 |
|
 | Figure 7. comparing the different algorithm to find the best answer of each generation of image 4 |
|
 | Figure 8. comparing the different algorithm to find the best answer of each generation of image 5 |
|
 | Figure 9. comparing the different algorithm to find the best answer of each generation of image 6 |
|
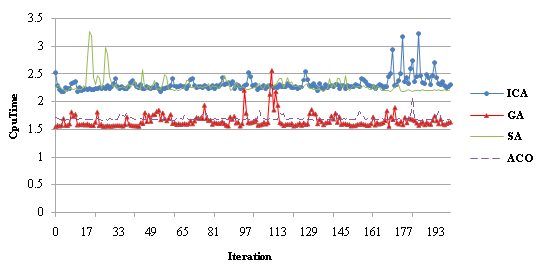 | Figure 10. time required for each algorithm implementation |
|
8. Conclusions, Recommendations and Future Tasks
- In this article, imperialist competitive algorithm for optimal graph partitioning was used and applied to the image. By comparing the results of this algorithm and other algorithms, it can be seen that the colonial competitive algorithm relative to other methods, although more time is spent, But the manufacturer has optimized the output image segmentation is more appropriate.In this article 4-connected scheme is used to create image graph. As future tasks, 8-connected on r-connected can be applied. In these methods image convert to binary mode that it can be considered as colored image. Better results in graph partitioning and its usages in image segmentation can be anticipated by composing ICA and chaos theory or other optimizing algorithms.