-
Paper Information
- Next Paper
- Paper Submission
-
Journal Information
- About This Journal
- Editorial Board
- Current Issue
- Archive
- Author Guidelines
- Contact Us
Advances in Computing
p-ISSN: 2163-2944 e-ISSN: 2163-2979
2012; 2(2): 1-8
doi: 10.5923/j.ac.20120202.01
A Novel Technology in Malaysian Agriculture
 Abstract
 Reference
 Full-Text PDF
 Full-Text HTML
Mohd. Hudzari Razali
Department of Agriculture Science, Faculty of Agriculture and Biotechnology, Universiti Sultan Zainal Abidin, Kampus Gong Badak, Kuala Terengganu, 21300, Terengganu, Malaysia
Correspondence to: Mohd. Hudzari Razali , Department of Agriculture Science, Faculty of Agriculture and Biotechnology, Universiti Sultan Zainal Abidin, Kampus Gong Badak, Kuala Terengganu, 21300, Terengganu, Malaysia.
| Email: |  |
Copyright © 2012 Scientific & Academic Publishing. All Rights Reserved.
This paper is to introduce the novel method of procedure and analysis in study the relationship of the mesocarp oil content with the colour skin of oil palm fruit with respect to it maturity. The Nikon digital camera and the Keyence machine vision were used to capture the FFB images with two different settings of natural environment and direct sunlight. The species of oil palm tree used for the experiments were Elaeis Oleifera and Elaeis Guineensis Jacq. The images from the Nikon digital camera were analysed for optical properties of Red, Green, Blue (RGB) and then convert to Hue value using developed graphical user interface (GUI). The Hue values will then be compared to the value obtained from Keyence machine vision. The images of oil palm FFB in plantation were captured with setting cameras parameter namely shutterspeed which set to 0.125 seconds, image sensor’s sensitivity (ISO) was set to Normal and white balance were calibrated using the standard white calibration CR-A74. The lighting intensity under oil palm canopy was simultaneously recorded and monitored using Extech Light Meter Datalogger. Using Analysis of Variance (ANOVA), the ratio of test statistic of F with F critical for experiments under natural environment of oil palm plantation indicated the best differences of the hue optical properties among different maturity level of unripe, ripe and overripe FFB. Using the SAS programming for statistical analysis, the Hue and Red color values were found had significant effect to distinguish the maturity level (fm) of FFB with Pr > F are showed less than 0.01. The Green and Blue color values were not significant effect to differentiate the FFB maturity level which indicated the value of Pr > F showed 0.0243 and 0.9938 respectively. The Hue and Blue color values were not interaction with different lighting condition and the maturity level which indicated Pr > F for ml*fm showed 0.0668 and 0.1667 respectively. From the ANOVA analysis, the Hue is the best color values to distinguish different maturity levels of FFB under direct sun lighting and natural environment conditions in oil palm plantation. From this experiment analysis, the technique is used for the application of the novel oil palm fruit bunch maturity detection system.
Keywords: Maturity Prediction Technique, Computational Illumination, Hue Optical Properties, Oil Palm Fruit Colour, Colour Vision
Article Outline
1. Introduction
- The evidence of the Almighty of Allah could be seen via His creations such as trees, mountains, animals and the earth. In Al-Quran, eighty three verse were mentioned about agriculture and it could be a kind of our worship to the creator of all creators; Allah Subhanahuwataala and refer to Imam Nawawi on Kitab Sahih, the best work or effort for the human being is agriculture[1]. The most agriculture crop production in Malaysia, oil palm (which is the most widely traded edible oil in the world[2]) was produced 17.7 million tonnes of palm oil on 4.5 million hectares of land in Malaysia for years of 2008. The production was less compared with Indonesia but still the largest exporter of palm oil in the world and currently accounts for about 55 % of world palm oil production and about 62% of world exports, it was occupied 8% and 22% of the world’s total production and exports of oils and fats, respectively[3]. Oil palm is normally monoceous; with both male and female flowers on the same tree. It produces bunches bearing thousands of fruits normally 200, and weigh between 10 and 40 kg per bunch[4]. Environmental factors like radiation from sunlight, temperature, water, humidity, nutrition and length of growing season affect plant growth and development[5]. The sunlight are filtered by oil palm leaf before it reaches the fruit surface. Under outdoor conditions, a surface's apparent color is a function of the color for the incident daylight, the surface reflectance and surface orientation, among several other factors[6].The first task to ensure quality in oil milling is to select a good quality FFB for processing which means the only right mature FFB should be harvested. Various techniques to gauge the ripeness of oil palm fruits have been developed such as percentage or number of harvested fruits per bunch[7], floatation technique[8], percentage detached fruits from the bunch[9]. These methods do not clarify oil quality and quantity. Kaida and Zulkifly[10] developed the application of microstrip sensor to determine the moisture content which will indicate or approximate the oil content of fresh mesocarp oil palm. This destructive method is not possible to be applied for tall palm trees age 10 years or above. Using non-destructive technique such as vision to determine the oil palm ripeness, Wan Ishak et al., used camera vision to categories six oil palm FFB[11]. Abdullah et al., used computer vision model in order to inspect and grade the oil palm fresh fruit bunches[12]. Balasundram et al., used camera vision to investigate the relationship between oil content in oil palm fruit and its surface color distribution[13]. Idris et al., use colorimeter and found a strong correlation between mesocarp oil content and color values[14]. Besides imaging objects in the visible (VIS) color region, some machine vision systems are also able to inspect these objects in light invisible to humans, such as ultraviolet (UV), near-infrared (NIR), and infrared (IR). The information received from objects in invisible light regions can be very useful in determining preharvest plant maturity, disease, or stress states. It is very useful in determining plant and vegetable variety, maturity, ripeness, and quality. Even though they have potential for detecting the fruit ripeness, their applications in the agricultural sector are limited because of the high cost of equipment investment and low operational speed.[15 and 16]. Advantages of using imaging technology for sensing are that it can be fairly accurate, non-destructive, and yields consistent results. At the moment there was no research carried out vision systems test on actual oil palm plantation for maturity recognition[17]. The advantage of predicting the oil palm fruit maturity in real time oil palm plantation will help harvesters to harvest the oil palm FFB at the correct maturity stage. This paper discusses the assessment of the color parameters to be used for determining the oil palm fruit maturity in real time basis application.
2. Methodology
- The experiment was conducted under two different conditions. In the first condition, the FFB images were captured under direct sunlight and in the second condition the FFB images were captured on its tree in an oil palm plantation. The source of light from the sun varied over the time, therefore the values of optical properties of FFB images from different stage of maturity were somehow fluctuated. The analyses of variance were carried out on the result of optical properties of R, G, B and Hue to determine the significance of relation between FFB skin color and maturity level.
2.1. Experimental Set-Up
- The NIKON Digital Camera with Nikon 3x Tele Converter TC-E3ED, Keyence vision system and Minolta color reader were the equipments used in this experiment to capture FFB image. In this experiment the image of FFBs were taken from twenty, sixteen and five year old palm trees. During the experiments, the camera was set to manual mode to make constant image output. The shutterspeed in the camera parameter and the vision were set to 1/8 with controlled exposure value. This parameter value was experimentally suitable for capturing FFB images during day light[17 and 18]. Before the FFB image in oil palm plantation can be captured, the automatic color balance on the Nikon camera needs to be disabled and calibrated manually by capturing the white color on white balance mode. For this study, the Minolta white color was used into white balance calibration of this camera. Figure 1 shows the calibration of Keyence camera before start the experiment. The term of white balance is if we can tell the camera which object in the room is white and supposed to come out white in the picture, the camera can calculate the difference between the current color temperature of that object and the correct color temperature of a white object, then shift all colors by that difference.
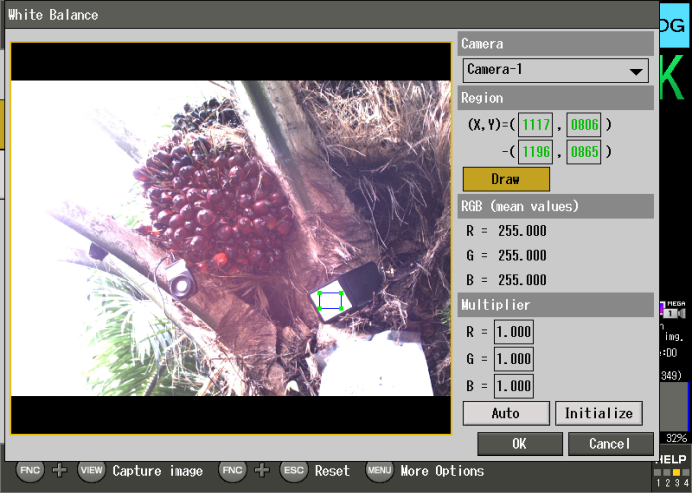 | Figure 1. The white balance setting on Keyence vision during experiment set up |
2.2. Simulation of Hue Value Determination
- The images captured were fed into the software and these images were analysed using RGB histogram module. Figure 2 shows the Hue digital value simulation model. The Hue value of the images obtained from RGB conversion value would then go through validation process by comparing the value obtained from Keyence vision. The histogram method which basically just a graphing of the frequency of each intensity of red, green, blue or luminance in an image is used. The Hue value was calculated from conversion using formula depicted as mentioned[19].
 | Figure 2. Algorithm flow chart of hue value simulation model |
2.3. Measurement of Optical Properties of R,G,B and Hue in Different Ripeness of FFB – An Overview
- The experiment to determine the optical properties of main categories of FFB namely unripe, underripe and ripe were conducted under two different settings. The first setting was the experiment of FFB at its natural environment of oil palm plantation and the second setting was the experiment of FFB fruitlet under direct sunlight. The species of oil palm tree used for the experiment were Elaeis Oleifera and Elaeis Guineensis Jacq. Figure 3 shows the image of FFB used in the experiment on natural environment setting and experiment under direct sunlight. Picture (A) shows unripe FFB under natural condition, Picture (B) shows ripe FFB under natural condition, Picture (C) shows overripe FFB under natural condition, for experiment on natural environment, Picture (D) shows ripe FFB under direct sunlight, Picture (E) shows unripe FFB under direct sunlight, Picture (F) shows overripe FFB under direct sunlight.The captured images were uploaded into the software for analysis as shown in Figure 4. The small circle on the FFB images indicate the point where one can click on it using mouse in order to get the pixel value of matured fruit. The size of the images captured was 461 X 613 image pixels. The analysis software was developed in order to automatically analyze image data, calculate result of an equation and finally produce graph in Excel[20].
3. Result and Discussion
- In this study, the developed graphical user interface software was used to convert the RGB of matured FFB image into Hue. The formula for converting RGB to Hue optical properties for matured FFB in outdoor condition is as follows[19];
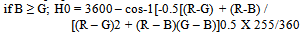 | (1) |
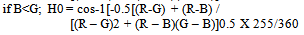 | (2) |
3.1. Result on Measurement of R, G, and B Optical Properties for Matured FFB in Outdoor Condition
- Figure 5 shows the graph of Hue correlation with the intensity in outdoor condition. The optical properties of matured FFB which was monitored in outdoor environment was almost constant with Hue Foptical properties. From the graph, the correlation of R2 is low. The variances of lighting intensity did not effect the Hue value, which were also stated by previous researchers[21 and 22]. This is due to the fact the Hue colorspace system separates the color information of an image from its intensity information. The Hue value of matured FFB was below than 70 and similar average was also found by Abdullah et al.[12] who tested under controlled condition.
 | Figure 3. Shows the image of FFB used in the experiment on natural environment setting (A-C) and experiment under direct sunlight(D-F) |
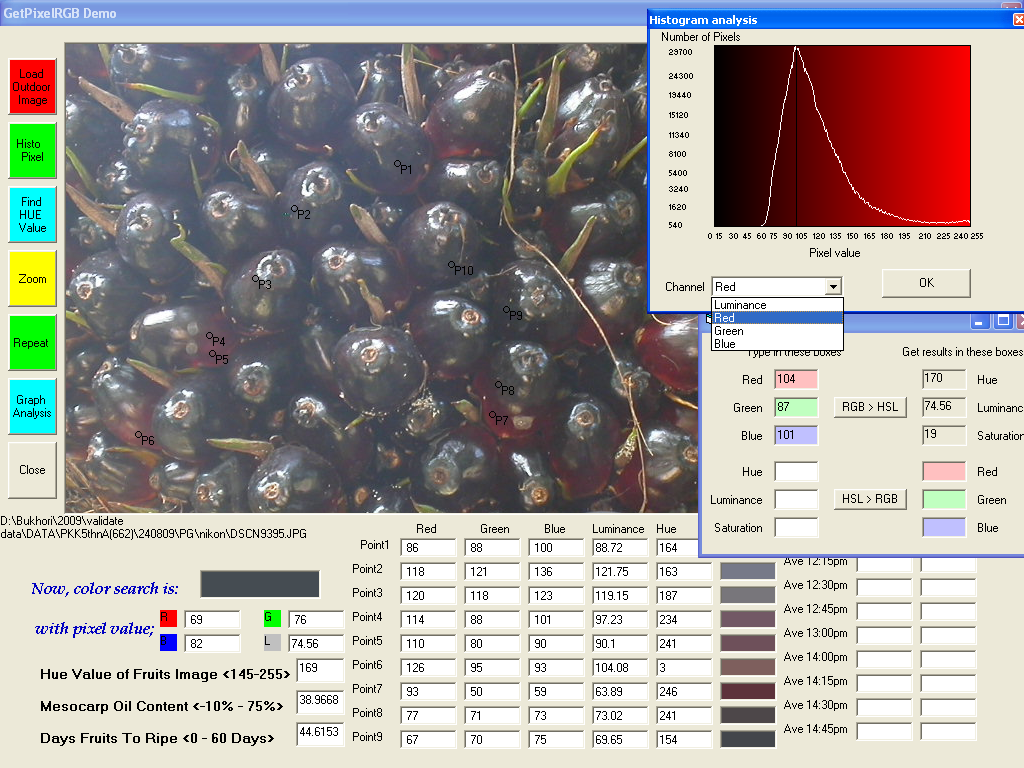 | Figure 4. Developed Software for Color Modeling Analysis |
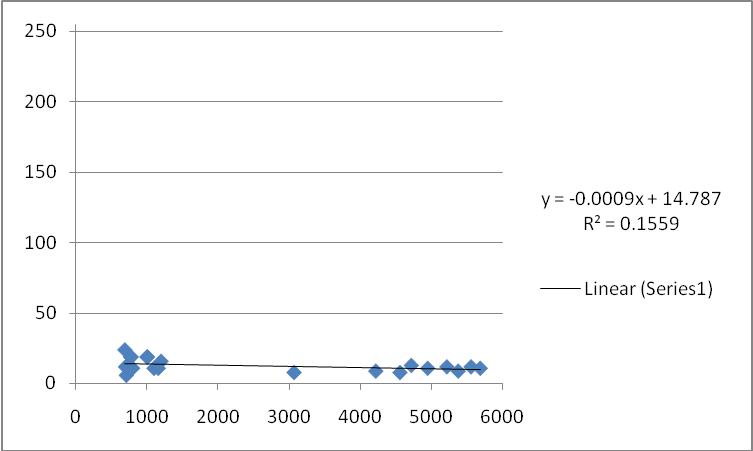 | Figure 5. Hue value for matured FFB in outdoor condition |
3.2. Result on Measurement of Optical Properties of R,G,B and Hue in Different Ripeness of FFB
- Regression analysis shows significant relationship between pixel value and intensity for FFB exposed to direct sunlight because R2 value was considered high. For the ripe FFB, R=0.0016x + 142.39 with R2=0.6255, G=0.002x + 82.916 with R2=0.5824 and B=0.002x + 86.729 with R2=0.5156. Blue band is the most significant parameter to that can be used in order to determine ripe Elaeis Guineensis when exposed to direct sunlight. The lowest R2 for Blue color component indicated the best color component for differentiation the ripe FFB in outdoor condition.For the unripe FFB for this species, R=0.0009x + 186.67 with R2 =0.5229, G=0.0015x + 125.1 with R2 = 0.4644 and B=0.0017x + 119.7 with R2=0.4405. The Blue band is the highest significant factor that can be used in order to determine the unripe fruit. The lowest R2 meant that the blue color component of FFB was less affected due to varying of the sunlight intensity. The correlation between pixel value and intensity for overripe FFB when exposed to direct sunlight. The fruit is overripe when R=0.0012x + 179.83 with R2=0.1804, G=0.002x + 104.54 with R2 = 0.5069 and B=0.0022x + 91.436 with R2=0.5485. Red band is the highest significant factor that can be used in order to determine the overripe fruit. The lowest R2 meant that the red color component of FFB was less affected due to varying of the sunlight intensity. The correlation regression (R2) values still higher for FFB exposed to direct sunlight than R2 for FFB in natural environment. However, this R2 value was not elevated enough to be used as the parameter to predict oil palm maturity because the good correlation between the light intensity and the RGB would produce high R2 value. Same problem was also reported by many researchers when facing light variance[11]. Many researchers prepared constant light source during the capturing of the FFB image in a controlled experiment in the laboratory and found that the FFB ripeness have significant correlation with the fruit color[11, 12, and 13].
3.2.1. Significant Analysis for Analysis in Direct Sunlighting
- The purpose of the analysis is to test the most significant optical properties component in order to determine the ripeness of FFB. Table 1, show the summary of significant optical properties for distinguishing the ripeness of FFB namely ripe, underripe and overripe. The means of each of the component of R, G, B and Hue for each categories of ripe, unripe and overripe FFB (Elais Guineensis Jacq.) were calculated by using ANOVA single factor analysis. From the result of ANOVA test, the hue value was highly significant in identifying the optical properties of each of the categories of FFB namely ripe, unripe and underripe. In general all the test showed that the F value is larger than F crititical value and hue was the highest followed by red, green and blue respectively.
3.3. Analysis of an Experiment for FFB under Natural Environment in Oil Palm Plantation
- The unripe FFB is determined when R=0.0613x + 40.3 with R2 = 0.3349, G=0.0685x + 38.404 with R2 = 0.3338 and B=0.0701x + 71.356 with R2=0.3662. Green color component is significant to predict unripe FFB because fruit at this stage shows lower value when regression analysis was done. The lowest R2 meant that the green color component of FFB was less affected due to varying of the sunlight. The FFB is ripe when R=0.0839x + 211.61 with R2=0.3838, G=0.1417x + 96.208 with R2= 0.2926 and B=0.1022x + 83.613 with R2= 0.2322. Blue color component is significant to predict unripe FFB because fruit at this stage shows lower value when regression analysis was done. The lowest R2 meant that the blue color component of FFB was less affected due to varying of the sunlight. The fruit is classified as overripe if R=-0.005x + 158.71 with R2=0.0009, G=0.033x + 91.72 with R2=0.0286 and B=0.05x + 104.69 with R2=0.0525. The low value of R2 indicates that there are no significant relationship between pixel value and intensity for ripe FFB. Red color component is significant to predict overripe FFB because fruit at this stage shows lower value when regression analysis was done. The lowest R2 meant that the red color component of FFB was less affected due to varying of the sunlight.The experiment conducted for FFB in outdoor environment showed that RGB values are totally influenced by the intensity. The higher the intensity of the sunlight, the higher the RGB value would be. Therefore the fruit which is exposed more to the sunlight would have higher RGB value. It can be seen that the R2 value is considered high which indicates strong correlation between pixel value and it maturity stage. This is one apparent problem when using the RGB as a colorspace as mentioned before.
3.3.1. Significant Analysis for Analysis in Natural Environment
- The purpose of the analysis is to test the most significant optical properties component of RGB in order to determine the ripeness of FFB. The significant of differences among optical properties of Hue on FFB images due to different lighting intensity in oil palm plantation were also predicted. Table 2 shows the summary table of significant optical properties for differentiating ripeness of FFB namely ripe, underripe and overripe.The hue value was highly significant in identifying the optical properties of each This is shown in Table 10. In general all the test showed that the F value is larger than F crititical value and hue was the highest followed by red, green and blue respectively.
|
3.4. Statistical Result for FFB Color Value Exposed to Direct Sunlight and Natural Environment
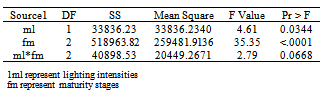
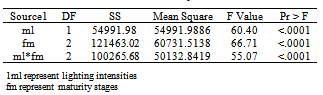
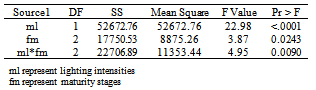
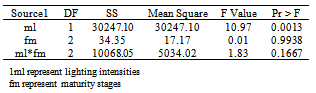
- The data obtained during the processing of images was analyzed using statitical data analysis software. The ANOVA single factor analysis was executed using SAS 9.1. Table 3,4, 5 and 6 show the ANOVA result analysis for the colors values of different maturity stages (namely unripe, ripe and overripe) with two lighting intensities (namely direct sun lighting and natural environment).
|
|
|
|
3.4.1. Means Table
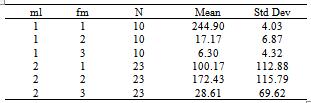
- Table 7 show the Mean table for the Hue color value to indicate the percentage of the range among different maturity level of FFB.
|
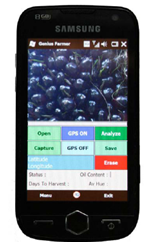 | Figure 6. Novel technology in maturity prediction system |
4. Conclusions
- Finding of the research stated that the optical property of digital image has significant relationship with FFB maturity stage. Hue has the highest optical properties, is a good mechanism for distinguishing maturity stage of oil palm fruits. The ratio of test statistic of F with F critical for experiment in natural environment of oil palm plantation indicated the best differences of the hue optical properties for among different maturity level of unripe, ripe and overripe FFB. The hue value was the best color digital component to differentiate the maturity level of FFB in real time oil palm plantation. The variances of lighting intensity were not affecting the Hue value of the target color which also stated by David, Gevers and Smeulders; because this color system separates the color information of an image from its intensity information[21 and 22]. The experiment conducted in an oil palm plantation had showed good result on significance of optical properties with maturity level. The extreme intensity of light happened during imaging of FFB under direct sunlight, was sheltered by oil palm leaf canopy. Protecting the tree from light is the main role played by an oil palm canopy and it is a fundamental requirement for crop growth, which was achieved up to 90% at maximum[5]. So, taking this into account, by using the application of photography from digital image, the maturity prediction based on the mesocarp oil content can run on real-time basis in oil palm plantation[17 and 24]. The suitable time for harvesting means the oil content produce at optimum quality with low fatty acid developed for benefit of mankind.
ACKNOWLEDGMENTS
- Thankful to Universiti Sultan Zainal Abidin and Universiti Putra Malaysia for providing the tools and sponsorship during conducting and presenting this research in IASTED International Conference on Computational Photography, Vancouver, Canada.
References
| [1] | Muhammad Fauzi Jumingan (2008), Jurnal Yayasan Dakwah Islamiah Malaysia, Bil 10, Jan. - Dis. 2008, No. 1 |
| [2] | Teoh C.H., (2002), The Palm Oil Industry In Malaysia: From Seed To Frying Pan Prepared For WWF Switzerland Hon. Advisor, Plantation Agriculture, WWF Malaysia |
| [3] | Malaysian Palm Oil Industry Performance (MPOIP, 2008), Global Oils & Fats Business Magazine VOL.6 ISSUE 1 (Jan-March), 2007 |
| [4] | Azis A.A., S.R.,Banjari ana Wan,O.W.E 1990. Morphological changes of the cellular component of the developing palm fruit (Tenera: Elaeis guineensis) PORIM Bulletin 21:30-34 |
| [5] | Md. Abdul Awal, (2005b), Image-Based Measurement of Leaf Area Index and Radiation Interception For Modelling Of Oil Palm, Unpublished PhD Dissertation, Universiti Putra Malaysia. |
| [6] | Shashi Buluswar (2002), Models for Outdoor Colour Vision, Doctoral Dissertation,University of Massachusetts, Amherst, USA |
| [7] | Ng and Southworth (1983). K.T. Ng and A. Southworth, Optimum time of harvesting. In: R.L. Wastle and D.A. Earp, Editors, Advances in oil palm cultivation, Incorporate Society of Planters, Kuala Lumpur (1983), pp.439–461. |
| [8] | Azis A.A, 1990. A Simple Floatation Technique to Gauge Ripeness of Oil Palm Fruits and Their Maximum Oil Content. In: Proc. Of 1989, International Palm Oil Development Conference, PORIM, Kuala Lumpur, p.87 – 91. |
| [9] | Turner, P.D and Gillibanks, R.A. (1974). Oil Palm Cultivation and Management. United Selangor Press, Kuala Kumpur, P.478 - 485 |
| [10] | Kaida Khalid and Zulkifly Abbas (1992), A Microstrip Sensor for Determination of Harvesting Time for Oil Palm Fruits, Journal of Microwave Power and Electromagnetic Energy,Vol.27 No.1, 1992 |
| [11] | Wan Ishak W. I., Mohd. Zohadie B., A.Malik A.H. (2000). Optical Properties for Mechanical Harvesting of Oil Palm. Journal of Oil Palm Research, Vol. 11, No. 2, pp. 38-45 |
| [12] | Abdullah M.Z., Lim C.G.And B.M.N. Mohd Azemi (2001), Stepwise Discriminant Analysis For Colour Grading Of Oil Palm Using Machine Vision System , Institution of Chemical Engineers Trans Icheme (pg.223-231), Vol 79 Part C |
| [13] | Balasundram S.K, Robert P.C, Mulla D.J (2006), Relationship Between Oil Content and Fruit Surface Color in Oil Palm Elaeis guineensis Jacq. Journal of Plant Sciences, Volume: 1, Issue: 3, pp. 217-227 |
| [14] | Idris O., M.Ashhar K., M.Haniff H. and M. Basri W. (2003), Colour Meter for Measuring Fruit Ripeness, MPOB Information Series (p. 195), ISSN 1511-7871 |
| [15] | Schatzki, T.F., Haff, R.P., Young, R., Can, I., Le, L.C. and Toyofuku, N. (1997), Defect detection in apples by means of X-ray imaging. Transaction ASAE, Vol 40(1), pp. 1407-1415. |
| [16] | Marks, J.S., Schmidt, J., Morgan, M.T., Nyenhuis, J.A. and Stroshine, R.L. (1998), Nuclear magnetic resonance for poultry meat fat analysis and bone chip detection. Industry summary for US Poultry and Egg Association. |
| [17] | W.I.W.Ishak and R.M Hudzari (2010). “Image Based modeling for oil palm fruit maturity prediction”. Journal of Food, Agriculture & Environment, Vol.8 (2): 469-476. 2010, WFL Publisher Ltd., Finland. |
| [18] | Mohd Hudzari Razali, Wan Ishak Wan Ismail, Abd. Rahman Ramli, Md. Nasir Sulaiman and Mohd. Haniff Harun (2009) "Development of Image Based Modeling for Determination of Oil Content and Days Estimation for Harvesting of Fresh Fruit Bunches," International Journal of Food Engineering, Vol. 5 : Iss. 1, Article 1. |
| [19] | Gonzalez, R. C. and Wintz, P.,(1987), Digital Image Processing, (pp. 207-214), Addison-Wesley, Reading, USA. |
| [20] | Mohd. Hudzari Razali, Wan Ishak Wan Ismail (2007a), Development Of Software Automation For Agriculture Vision System, World Engineering Congress, (pp. 99-103), Penang, Malaysia. |
| [21] | David Forsyth, (1990), A novel algorithm for color constancy, International Journal Computer Vision, 5, 5–36. |
| [22] | Theo Gevers and Arnold W.M. Smeulders (1999), Color-based object recognition. Pattern Recognition, 32,453–464. |
| [23] | Jeremy Miles and Mark Shevlin (2001) Applying Regression and Correlation: A Guide for Student and Researcher. SAGE Publication Ltd. 55 City Road London. |
| [24] | Mohd. Hudzari Razali,Wan Ishak Wan Ismail, Abd. Rahman Ramli, Md. Nasir Sulaiman, and Mohd. Haniff B. Harun (2011). “Technique on Simulation for Real Time Oil Palm Fruits Maturity Prediction”, African Journal of Agriculture Research. Vol 6(7): pp.1823-1830. |
| [25] | Mohd. Hudzari Razali,Wan Ishak Wan Ismail, Abd. Rahman Ramli, Md. Nasir Sulaiman, and Mohd. Haniff B. Harun (2011). “Prediction Model for Estimating Optimum Harvesting Time of Oil Palm Fresh Fruit Bunches”. Journal of Food, Agriculture & Environment, 9(3&4): pp. 570-575. |