Advances in Analytical Chemistry

p-ISSN: 2163-2839    e-ISSN: 2163-2847

2026;  14(1): 11-25

doi:10.5923/j.aac.20261401.02

Received: Oct. 14; Accepted: Nov. 3, 2026; Published: Nov. 13, 2026


Comparative Assessment and Optimization of Methyl Red and Methyl Orange Removal by Iron-Electrode Electrocoagulation Using Response Surface Methodology

Kom Blaise1, Benessoubo Kada Danièle2, Domga Richard3, Alang Michael Bong3, Anrakang Bogorta Pascaline1, Payang Gangou Raoul3, Inna Samomssa3, Tchamango Jiankam Serge Raul1, Bike Mbah Jean Baptiste3

1Department of Chemistry, Faculty of Sciences, University of Ngaoundere, Cameroun

2Department of Chemical Engineering, University Institute of Technology, University of Ngaoundere, Cameroon

3Department of Applied Chemistry, National School of Agro-Industrial Sciences, University of Ngaoundere, Cameroon

Correspondence to: Domga Richard, Department of Applied Chemistry, National School of Agro-Industrial Sciences, University of Ngaoundere, Cameroon.

Email:

Copyright © 2026 The Author(s). Published by Scientific & Academic Publishing.

This work is licensed under the Creative Commons Attribution International License (CC BY).
http://creativecommons.org/licenses/by/4.0/

Abstract

This work aims to optimize the removal of methyl red and methyl orange, two azo dyes, from water by electrocoagulation using iron electrodes. Azo dyes are recalcitrant organic pollutants whose discharge into aquatic environments poses serious public and environmental health risks, including mutagenicity, carcinogenicity, and disruption of aquatic ecosystems. Regulatory frameworks such as the European Union’s Industrial Emissions Directive and WHO effluent guidelines restrict dye concentrations in treated wastewater to below 1 mg/L (colour-causing compounds), making high-efficiency removal a critical treatment objective. A Central Composite Design (CCD) was implemented to simultaneously optimize the key operating parameters influencing removal efficiency: current intensity (0.5 to 2.5 A), initial pollutant concentration (25 to 100 mg/L) and pH (3 to 11). The results revealed that electrolysis time was a determining factor for dye removal. Significantly, the interactions between current intensity and solution pH, as well as between pH and electrolysis time, exhibited synergistic effects favoring removal efficiency. The optimization led to the establishment of distinct optimal operating conditions for each dye: a maximum removal efficiency of 94.78 % was achieved for methyl red with an intensity of 1.5 A, for a time lapse of 57 min, and a pH of 5.0 while for methyl orange, an optimal efficiency of 95.38 % was obtained at pH 4.7 after 58 min of electrolysis time, at a current intensity of 2.0 A. The experimentally validated removal efficiencies of 97.8 % (methyl red) and 98.5 % (methyl orange) exceed the >95 % threshold commonly cited as a benchmark for high-efficiency dye removal in the electrocoagulation literature, and bring final dye concentrations well within internationally permissible levels. This study demonstrates that systematic optimization of the electrocoagulation process enables the achievement of high removal efficiency for organic pollutant dyes, while emphasizing cost efficiency and environmental responsibility in wastewater management.

Keywords: Central Composite Design, Dyes, Electrocoagulation, Iron electrodes, Optimization, Removal efficiency

Cite this paper: Kom Blaise, Benessoubo Kada Danièle, Domga Richard, Alang Michael Bong, Anrakang Bogorta Pascaline, Payang Gangou Raoul, Inna Samomssa, Tchamango Jiankam Serge Raul, Bike Mbah Jean Baptiste, Comparative Assessment and Optimization of Methyl Red and Methyl Orange Removal by Iron-Electrode Electrocoagulation Using Response Surface Methodology, Advances in Analytical Chemistry, Vol. 14 No. 1, 2026, pp. 11-25. doi: 10.5923/j.aac.20261401.02.

1. Introduction

The textile manufacturing process requires a significant amount of water. Research indicates that for every kilogram of textile product produced, approximately 100-200 liters of wastewater are generated [1], [2]. Typically, around 30-40 % of the total water consumption occurs during the key chemical or dyeing operations, while the remaining 60-70 % is utilized during the washing phase [3]. Notably, about 60-70 % of the synthetic dyes employed in textile processing are azo dyes, which are favored for their stability and colorfastness on fabric due to their complex aromatic structures [4]. However, it is estimated that 10-15 % of these synthetic dyes are lost in the effluent [5]. The discharge of azo dyes into receiving water bodies poses serious risks to both public health and ecosystems. Azo dyes and their metabolites particularly aromatic amines produced during reductive cleavage of the azo bond have been identified as mutagenic and potentially carcinogenic to humans. Ecologically, even trace concentrations can inhibit photosynthesis in aquatic plants, reduce dissolved oxygen, and impair reproductive functions in aquatic organisms [2]. Regulatory standards in the European Union (Industrial Emissions Directive 2010/75/EU), WHO wastewater reuse guidelines, and many national discharge standards mandate effective color and organic pollutant removal before discharge, making high-efficiency dye removal technologies an environmental and public health priority.
Multiple approaches are used for wastewater treatment, including physical, chemical, and biological methods [6], [7], [8], [9], [10], [11], [12], [13], [14], [15], [16], [17]. While physical processes like adsorption and membrane filtration can be effective, they often fall short of meeting discharge regulations and can be quite expensive [18]. On the other hand, biological treatment methods tend to be slow to start and often require additional steps to address bio-persistent pollutants [19]. Chemical coagulation presents its own challenges, as it can worsen the concentration of certain dissolved materials and result in significant sludge production [20], [21]. In recent years, various advanced oxidation processes (AOPs) have gained attention, including ozonation [22], [23], [24], UV with hydrogen peroxide [2], and solar-TiO2 applications [18], as promising options for effective treatment. However, the cost-effectiveness of these methods remains a concern [25]. Because of this, there is an urgent need for an efficient, cost-effective, and environmentally friendly solution to treat and recycle textile wastewater.
Electro-Oxidation (EOx) methods present a compelling alternative for wastewater treatment, offering benefits such as shorter retention times, reduced reliance on harsh chemicals, lower labor costs, and minimized sludge production. Additionally, these methods are generally more cost-effective compared to Advanced Oxidation Processes (AOPs) [26], [27]. Within the various EOx techniques, Electro-coagulation (EC) stands out as both an affordable and efficient treatment option [28], [29]. Its widespread application can be attributed to its effectiveness in removing a diverse array of organic and inorganic contaminants. The method has been widely utilized for addressing a range of industrial wastewater types, including textile waste [30], pharmaceutical waste [31], municipal waste [32], drinking water [33], dairy waste [34], petroleum waste [35], and pulp and paper industry wastewater [36], [37]. Its effectiveness in treating textile wastewater, in particular, has been demonstrated, marking it as a straightforward, dependable, cost-efficient, and effective solution [26], [38]. Electrocoagulation is an electrochemical technique by which sacrificial anodes (iron or aluminum electrodes) are gradually solubilized in the water to be treated and serve as coagulant precursors [39]. When Fe is used as the electrode material, oxidation reactions on the anode produce iron hydroxide, Fe(OH)n, where n = 2 or 3. Two treatment mechanisms are available for Fe electrodes, where the first mechanism is for the production of Fe(OH)3 and the second mechanism is for the production of Fe(OH)2 [40], [41].
Mechanism 1
(1)
(2)
(3)
Overall
(4)
Mechanism 2
(5)
(6)
Cathode
(7)
Overall
(8)
Other monomeric and polymeric hydroxy-complexes such as Fe(OH)2+, Fe(OH)2+, Fe(OH)4 ̶, Fe(H2O)63+, Fe(H2O)5(OH)2+ may also be present depending on solution pH [42], [43], [44] recommended that both Fe2+ and Fe3+ ions exist in the EC reactor. Researchers also reported Fe(II) as a weak coagulant compared to Fe(III) due to its lower destabilization strength (lower positive charge) [44], [45]. As described in the solubility diagram, the minimum solubility of Fe(III) hydroxide occurs at a pH of 8 showing maximum removal capability of Fe electrodes.
Despite growing interest in electrocoagulation for dye removal, significant knowledge gaps remain regarding the simultaneous treatment of MR and MO in binary mixtures. While previous studies have achieved notable removal rates 97.19 % and 97.74 % for MO using Taguchi and response surface methods respectively [46], [47], and 99 % for ternary mixtures of MO, Congo red, and acid blue-113 [48] these studies did not comprehensively evaluate individual dye behavior within multi-component systems or systematically explore factor interactions beyond the experimental domain. Although [49] recently reported 100 % MO removal and 96.30 % MR removal in binary mixtures using central composite design, a systematic investigation of the optimal operational window, synergistic or antagonistic interactions between operating parameters, and the predictive modeling of removal efficiency across extended operational ranges remains unexplored.
The novelty of this work lies in the comparative and integrated optimization of methyl red and methyl orange removal using iron-electrode electrocoagulation, considering pH, current intensity, electrolysis time, and initial dye concentration simultaneously through a Central Composite Design. Electrocoagulation represents a promising approach for the removal of dyes from wastewater. Furthermore, Response Surface Methodology (RSM) has previously been employed to optimize the treatment of dye-contaminated water [50]. The developed models quantify the individual and interactive effects of these variables and enable the prediction and optimization of dye removal efficiency under optimal operating conditions. The present study aims to compare the removal efficiencies of different dyes, identify the individual and interaction effects of the main operating parameters, and determine the optimal treatment conditions for each dye under standardized operating conditions.

2. Materials and Methods

2.1. Materials

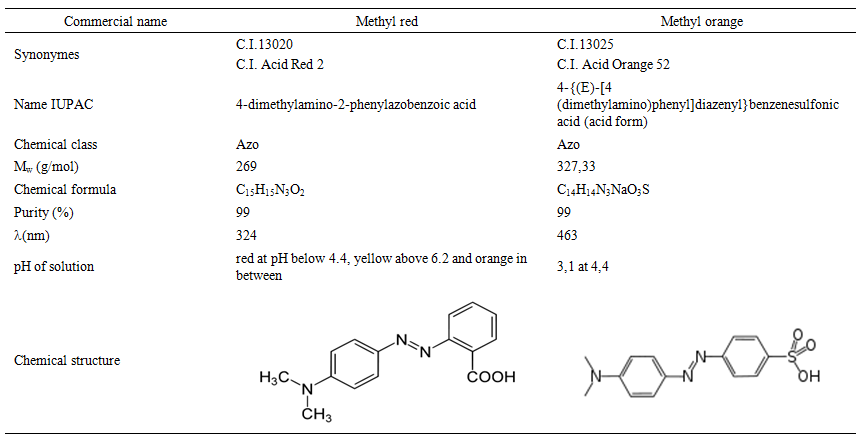
The chemicals used during this study were of analytical grade: Methyl Red and Methyl Orange were provided by Honeywell Fluka (Germany). Table 1 represents the physical, chemical properties and structures of the dyes used in this work. Sodium chloride (NaCl, 99 %) and sodium hydroxide (NaOH, 99 %) were supplied by Prolabo (France). chloride acid (HCl 37 %) were purchased from Sigma-Aldrich (Saint-Quentin Fallavier, France). We prepared all the test solutions with ultra-pure Milli-Q water (Millipore, resistivity > 18 MΩ cm).
Table 1. Physical and chemical properties and structure of the dyes used

2.2. Experimental

The initial solution of Methyl Red (MR) and Methyl Orange (MO), each at a concentration of 1,000 mg/L, was prepared by dissolving an appropriate amount of each dye in distilled water. Working solutions were then prepared by diluting the initial solutions to achieve the required initial concentrations. To ensure a reliable comparison of removal efficiencies, the two dyes were treated separately under identical operating conditions. This approach enabled the identification of differences in the removal behavior specific to each dye.
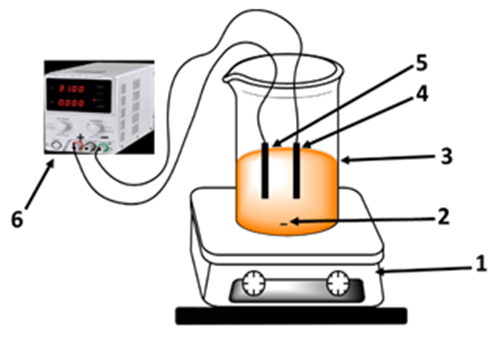
The electrochemical device used for the electrocoagulation process is shown in Figure 1. The experimental setup and electrode configuration are identical to those described in detail in [50] and are only briefly summarized here. Experiments were conducted in a 500 mL glass reactor fitted with two iron rod electrodes (length 12 cm, radius 0.5 cm) positioned 1.5 cm apart in a planar configuration. The volume of effluent to be treated was 400 mL. The reactor is first filled with the effluent to be treated to a volume of 400 mL and 1.5 g of NaCl is added to increase the conductivity of the effluent, and the magnetic bar is immersed (200 rpm). This speed was kept constant for all experiment.
Figure 1. Schematic of the experimental set-up of the electrocoagulation device. (1. Magnetic stirrer; 2. magnetic bar; 3. Electrolytic cell; 4. Cathode (iron); 5. Anode (iron); 6. D.C power supply)
Turbidity was measured after 15 minutes of settling and on the clear supernatant. HACH “2100 Turbidimeter” type device comprising an infrared diode with a wavelength of 890 nm and a reflected light detector used measuring turbidity. The measurement is based on absorption by suspended particles. The unit used for turbidity is the Nephelometric Turbidity Unit (NTU).
The electrode support was placed above the reactor to keep the electrodes stable, at the chosen distance, then connect the electrodes to the terminals of a direct current power supply (generator) therefore the maximum voltage and current intensity are respectively 30 V and 2.5 A. Finally the stirrer as well as the generator have been put on and manipulation were done for 60 min. Samples are collected after 10 min during the electrocoagulation experiment using a syringe. The volume of samples taken is 10 ml. Before carrying out the analyses, these samples are filtered using filter paper in order to eliminate unsettled flocs. It is important to clarify that the CCD optimisation was conducted separately for each dye: MR and MO removal efficiencies were modelled and optimised independently, using their respective absorbance wavelengths (324 nm for MR; 463 nm for MO) to quantify each dye individually within the binary solution.

2.3. Analytical Measurements

The different analyzes carried out during the experimental tests are as follows:
Current intensity: The influence of current intensity on dye removal efficiency was investigated by varying the applied current from 0.5 to 2.5 A.
pH: The pH (Hydrogen potential) of the samples taken are measured by a ″Hanna, HI2209 pH meter″ mini pH meter with a glass electrode containing a KCl solution of concentration 4 M.
Initial dye concentration: The influence of initial dye concentration on the removal efficiencies of MO and MR was evaluated by varying the concentration of each dye from 25 to 100 mg/L.
The voltage across the electrodes is recorded continuously. The initial pH was varied between 3 and 11 using HCl solution (1 N) and NaOH solution (1 N). Hydrogen potential (pH) measures the measures the basicity and acidity of our dye.
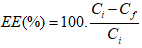
Elimination Efficiency (EE): Throughout the duration of the experimentations, samples at different intervals of time were taken. Before being analyzed by the UV-visible spectrophotometer, the samples underwent decantation for 30 minutes. The different samples of methyl red and methyl orange taken during the electrocoagulation treatment were analyzed by a ROHS Spectrophotometer Visible/UV spectrophotometer at wavelengths equal to 324 and 463 nm, corresponding respectively to the maximum absorbance of methyl red and methyl orange. The evolution of the concentration during the treatment was calculated from the calibration curve constructed from the standards, by application of the Beer–Lambert law. The elimination efficiency in percentage (EE) of the synthetic wastewater was calculated from the concentration change and defined by Eq. (9).
(9)
Where Ci and Cf are respectively the initial and final concentration en mol/L.

2.4. Optimization by Response Surface Methodology (RSM) Approach

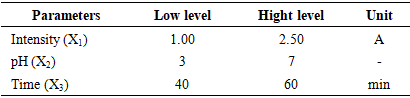
In this work, three main variables affecting the removal efficiency of our dyes were chosen, corresponding to X1 for the applied current I (A), X2 for the pH of the solution and X3 for the electrolysis time t (min). The central composite design allows for the evaluation of both linear and quadratic effects, as well as two-factor interactions, providing a comprehensive understanding of how these variables synergistically affect dye removal efficiency. Table 2 represents the levels and experimental range of independent variables for dye removal in this work which α = 1.
Table 2. Experimental level for removal of methyl red and methyl orange
     
The number of experiments to be carried out by the CCD is written in the form of the following Eq (10):
(10)
N is the number of experimental trials; n is the number of factors, and n0 is the central trials used to evaluate experimental errors. It resulted in 18 tests being carried out by using 4 central points. The response followed (Y) during this part is the elimination efficiency represented by Eq (9).
The design of the different experiments and the analysis of the results were done by the MiniTAB 18 software. The experimental response associated with the CCD was given by a quadratic polynomial model (Eq. 11):
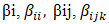
(11)
Y: is the predicted response, : the constant coefficient, : the coefficients of linear, interaction, and quadratic terms, respectively, : coded variables, error term. In order to assess the accuracy of the fitted model, the analysis of variance, the lack of fit, and the coefficient of determination R2 were carefully exploited. After that, 3D graphs were plotted to show the response surface, the interaction between factors, and their combined effect on the efficiency of the treatment [51].
2.5. Model Validation

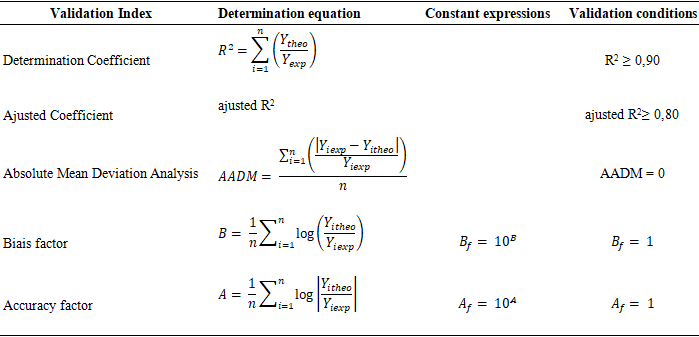
According to [52] the elevation of R² and the values of the Absolute Mean Deviation Analysis (AMDA) make it possible to verify the accuracy of the model. In fact, the R² must be close to 1, and the AMDA between the predicted and observed data must be as close to zero as possible. Added to these, the bias factor (𝐵f) and the accuracy factors (Af1 and Af2) also enable an empirical model to be validated. When these parameters are acceptable, it can be concluded that the model defines the true behaviour of the system and can therefore be used to make reliable predictions within the boundaries of the experimental domain (i.e., interpolation). It should be noted that predictions beyond the tested factor ranges (extrapolation) are not statistically supported by the model and should be treated with caution. The equations for the various validation parameters mentioned above are given in Table 3 below.
Table 3. Model validation criteria
     

3. Results and Discussion

3.1. Effect of Current Intensity

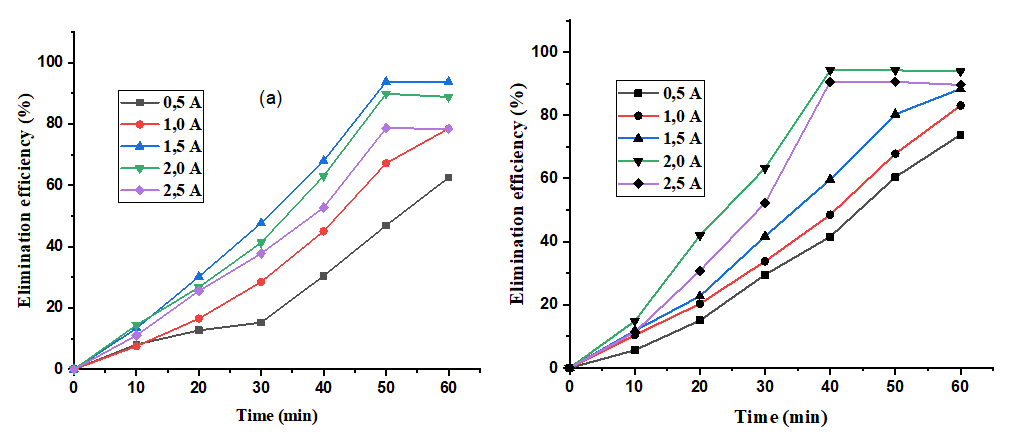
In order to study the current intensity of dye elimination by the EC process, electrolysis tests were conducted by varying the current intensities from 0.5 A to 2.5 A at different times. The results obtained are represented in Figure 2.
Figure 2. Effect of current intensity on the elimination of Methyl Red (a) and methyl orange (b) as a function of time. C = 50 mg/L, initial pH = 5, [NaCl] = 1.5 g/L Turb= 133 NTU
From Figure 2 (a and b), it is observed that current intensity has two distinct effects on the removal of Methyl Red and Methyl Orange. First, the removal efficiency increased with increasing intensity up to a certain time and tended to present a steady step. Figure 2a shows that the intensity curves I= 0.5A and 1A increase up to 60 minutes with low elimination rates 62.53 % and 78.49 %, respectively. On the other hand, for the current intensities of I= 1.5 A (93.74 %), I=2 A, (89.86%) and I=2.5 (78.62 %) we noticed a rapid increase of the removal efficiency after 50 min. After this time, they decrease slightly for the 1.5A, 2A and 2.5A intensity curves (93.68 %, 88.84 % and 78.43 %) for methyl red. In Figure 2b, the 0.5A, 1A and 1.5A intensity curves increase with a low elimination rate of 73.87%, 83.12% and 88.41% after 60 minutes. The intensity curves increase from 0 to 40 minutes with a rate of 94.28% and 90.64% elimination for the 2A and 2.5A intensity curves, then these curves decrease to 93.89% and 89.64% for the orange methyl.
The increased removal rate is consistent with a mechanism proposed in the literature [45] involving the production of ferric ions generated by the oxidation of iron electrodes, which undergo further reactions to produce iron hydroxide complexes which destabilize colloids and suspended particles. It should be noted that direct iron speciation analysis was not performed in this study; the involvement of specific Fe(II)/Fe(III) species is therefore inferred from established electrocoagulation theory and should be regarded as a mechanistic interpretation rather than a directly measured result. These complexes Fe(OH)3, Fe(H2O)4 (OH)2+, Fe(H2O)62+, Fe2(H2O)8(OH)42+ have a strong affinity for the dispersed particles, thus causing coagulation [53].
The decrease in elimination efficiency after 40 and 50 minutes for the intensities (2 A and 2.5 A) is because the gases released at the electrodes (oxygen at the anode and hydrogen at the cathode) can encroach at the top and cause the coagulated materials to float [54]. The release reactions of these two gases are (4) and (5). But it can also be explained by the overconsumption of electrical energy by secondary parasitic reactions, which can take place at higher current intensities. The two dominant parasitic reactions (Eq.14) and (Eq. 15):
(12)
(13)
(14)
(15)
The intensity of the current is a very important parameter for electrocoagulation, but the effect of pH should not be neglected because it allows us to see under what conditions this treatment can be favorable. In the remainder of this work, the effect of the pH of the solution was studied.

3.2. Effect of pH

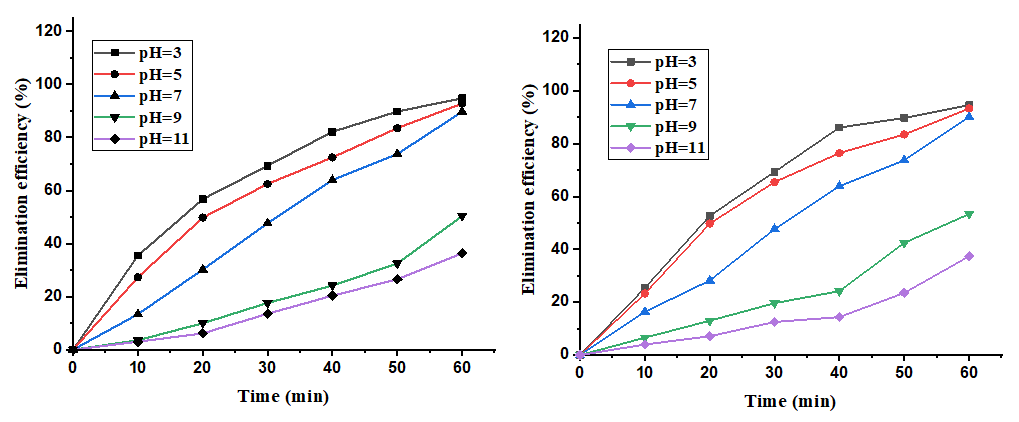
To study the effect of the initial pH on the kinetics of electrocoagulation of the dyes with iron electrodes, a test with different pH values, namely 3, 5, 7, 9 and 11, was done, and the results are shown in Figure 3.
Figure 3. Effect of pH on the elimination of Methyl Red (a) and Orange (b) as a function of time. C = 50 mg/L, I = 1.5A, NaCl = 1.5g/L, Turb = 133NT
Removal efficiency is associated with decreasing pH over time. Two distinct phenomena are observed. The curves have the same appearance when the pH is between 3 and 7, but also the same phenomenon is observed for the curves whose pH is between 9 and 11. The efficiency of elimination of 94.81%, 92.76%, 89.68%, 50.38% and 36.37% at pH 3, 5, 7, 9 and 11, respectively. The same observation was obtained using methyl orange. The elimination efficiency of 94.58%, 93, 31% and 90.12% at pH 3, 5 and 7, respectively. Authors attributed that to the partial dissolution of Fe3+ ions and the release of OH-, the interest in the dyes increased their elimination in solution [55]. In contrast, a low elimination rate at high pH (9-11) values is due to the existence of iron hydroxides on which the dye molecules will adsorb [56].
Under acidic conditions (pH = 4-5), the performance of electrocoagulation (EC) in treating MO dye was found to be the most effective, aligning with findings from previous studies [28]. This effectiveness may stem from the enhanced breakdown of the complex structure of MO under acidic conditions [57]. Additionally, [5] highlighted the significance of acidic pH for MO degradation, noting a lack of color removal under basic conditions due to the formation of Fe(II) hydroxide at elevated pH levels. In another study, [1] reported achieving 100% color removal and 89.7% chemical oxygen demand (COD) removal for MO dye using conventional EC at an initial pH of 5.
The effect of the pH of the solution made it possible to see that electrocoagulation process is optimal in an acidic environment. As the effect of the initial concentration of the dyes is also reported as an influential parameter in the EC process. Thus, in the following part, we are going to study the effect of the initial concentration on the removal of organic pollutants in our study.

3.3. Effect of Initial Concentration

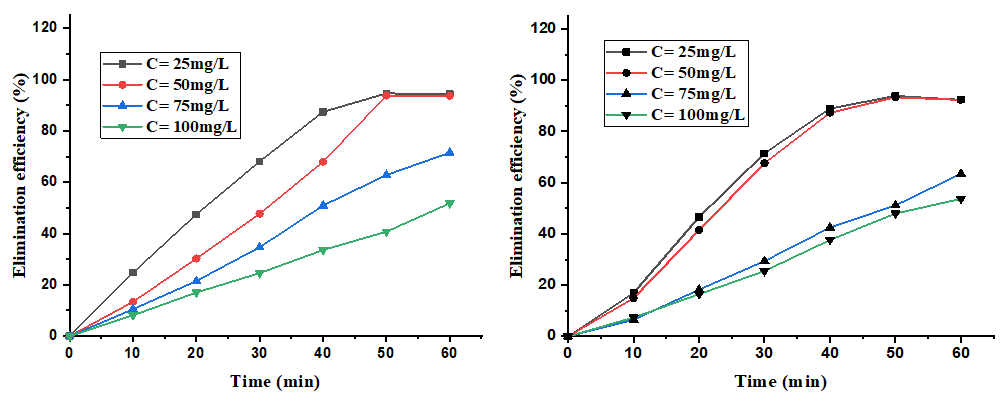
The concentrations were varied with values ranging from 25 to 100 mg/L while the other parameters were kept constant. The results are represented in Figure 4.
Figure 4. Effect of initial concentration on the elimination of Methyl Red (a) and orange (b) as a function of time. I = 1.5A, pH = 5, NaCl = 1.5g/L, Turb = 133NTU
Removal efficiency is associated with the decrease in initial concentration over time. The phenomena observed on the different curves show that they increase as a function of time. The curves have the same appearance for concentrations between 25 and 50 mg/L. The same as for the curves of 75 and 100 mg/L. The removal efficiency is 94.57%, 93.74%, 71.52% and 51.77% at the initial concentration of 25, 50, 75 and 100 mg/L for methyl orange. The same observation was obtained using methyl orange. The removal efficiency is 93.87% and 93.33% for the initial concentration of 25 and 50 mg/L.
The high elimination rate at low concentrations is attributable to the dominance of iron monomers over pollutants in the environment. It is important to distinguish between removal percentage and mass removal when interpreting these results. At 100 mg/L initial concentration, although the removal percentage is lower (~50 % at t = 60 min), the absolute mass of dye removed (~50 mg/L) is substantially greater than that removed from a 25 mg/L solution (~23 mg/L at ~90 % removal). The apparent decrease in removal percentage at higher concentrations reflects the fact that the quantity of coagulant generated (controlled by current intensity and electrolysis time) remains constant, while the pollutant load increases so the ratio of coagulant to dye becomes less favourable. This observation also reveals that an initial concentration of 50 mg/L represents a practical optimum, balancing high removal percentage with substantial mass removal a noteworthy finding with implications for process design. But also, it is because the water molecules react at the cathode by releasing electrons to form gas and hydroxide ions. The accumulation of the latter at the cathode can create a physical barrier between the particles, which have become more numerous, to coagulate and the electrodes, thus reducing efficiency [58].
Researchers have indicated that this effect arises from the insufficient amount of flocs and the depletion of their adsorption capacity when faced with higher concentrations of contaminants [59].

3.4. Statistical Analysis with the Central Composite Design (CCD)

3.4.1. Experimental Results
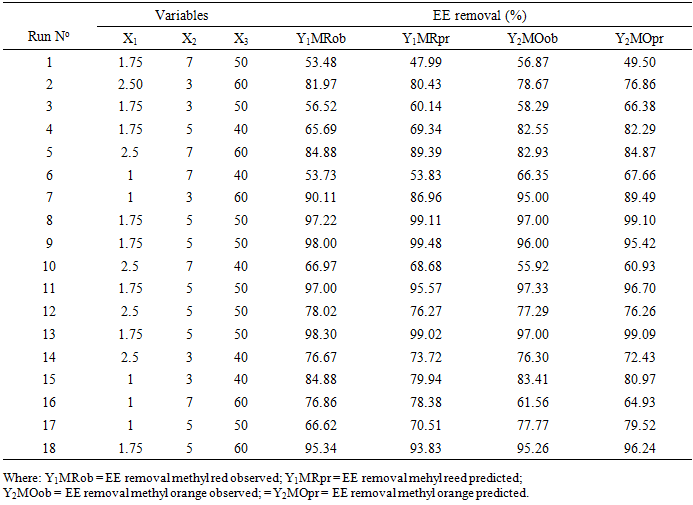
Tables 4 represent the different results obtained during our experimental matrix with the central composite design (CCD) to show the elimination efficiency (Y response) by the electrocoagulation process for methyl red and methyl orange.
Table 4. Experimental and theoretical results for the elimination of methyl red and methyl orange
     
The removal percentage of methyl red ranges between 53.48 % and 98.30 % and that of methyl orange between 55.92 % and 97.33 %. Table 5 presents the analysis of variance (ANOVA) results for methyl red and methyl orange, respectively.
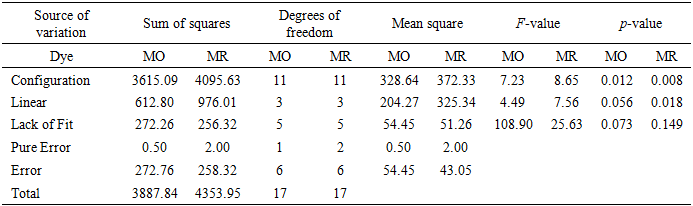
Table 5. ANOVA for methyl orange (MO) and methyl red (MR) removal by electrocoagulation process
     
From the data obtained from the ANOVA for our two dyes, the F values (8.65 and 7.23), respectively for methyl red and methyl orange, given in Table 5, which represent the results of the ANOVA for red methyl removal and orange methyl by the electrocoagulation process, the model equations are highly significant (p = 0.008 and 0.012, respectively). The coefficient of determination (R2) measures the proportion of total variations in the dependent variables that can be explained by the model predictions. From this analysis, the model is considered valid with a statistical truth percentage R2 of 94.07 % and 92.88 % for methyl red and methyl orange, respectively. This indicates that 94.07 % and 92.88 % of the variability observed in the data can be explained by the elimination of color. However, these values also mean that only 5.93 % and 7.12 % of the data could not be explained by the model, which is statistically significant at 95 % confidence level. The adjusted coefficients of determination, adjusted R-square of 83.19 % and 80.12 % for methyl red and methyl orange, respectively were also significant because it is greater than 80 %. The bias and accuracy factors for methyl red are 1.004 and 1.010, respectively, and those for methyl orange are 1.003 and 1.009, respectively. The model can be used to identify optimal operating conditions within the experimental domain and predict the discoloration efficiency of Methyl Red and Methyl Orange depending on the factors.
The second-degree polynomial mathematical model was describing the elimination of Methyl Red (Eq. 16) and Methyl Orange (Eq.17). The equation of the quadratic model thus allowed us to bring out these answers in the following way:
(16)
(17)
Where Y1 (%) et Y2 (%) are the removal percentages of methyl red and methyl orange, X1, X2, X3 are the current percentage current intensity, solution pH and electrolysis time, respectively.
From equation Y1, the intensity and the pH of the solution have a negative effect on the response, as well as their quadratic effects, with the exception of the electrolysis time and the interactions between variables, which have a positive effect. The negative effect of current intensity at higher levels can be attributed to excessive bubble generation and electrode passivation, which disrupt floc formation and reduce treatment efficiency [60]. The negative quadratic effect of pH suggests an optimal pH range exists, beyond which either insufficient coagulant formation or resolubilization of hydroxide precipitates occurs [61]. The positive effect of electrolysis time is expected, as longer treatment duration allows for more complete coagulant generation and enhanced pollutant-coagulant contact.
From the Y2 equation, all variables have a negative effect on the response, except for the electrolysis time and the interactions between current intensity and pH, pH and electrolysis time, and current intensity and electrolysis time. This pattern suggests that Methyl Orange exhibits different removal behavior compared to Methyl Red, likely due to differences in molecular structure and ionization state. The positive interaction terms reveal synergistic effects, where parameters work cooperatively when properly balanced for instance, moderate current at optimal pH generates the ideal speciation of Fe(OH)n complexes for effective dye removal. This complex interdependency emphasizes that electrocoagulation parameters must be optimized collectively rather than individually to maximize removal efficiency while minimizing energy consumption.
3.4.2. Response and Diagram Contour Surface
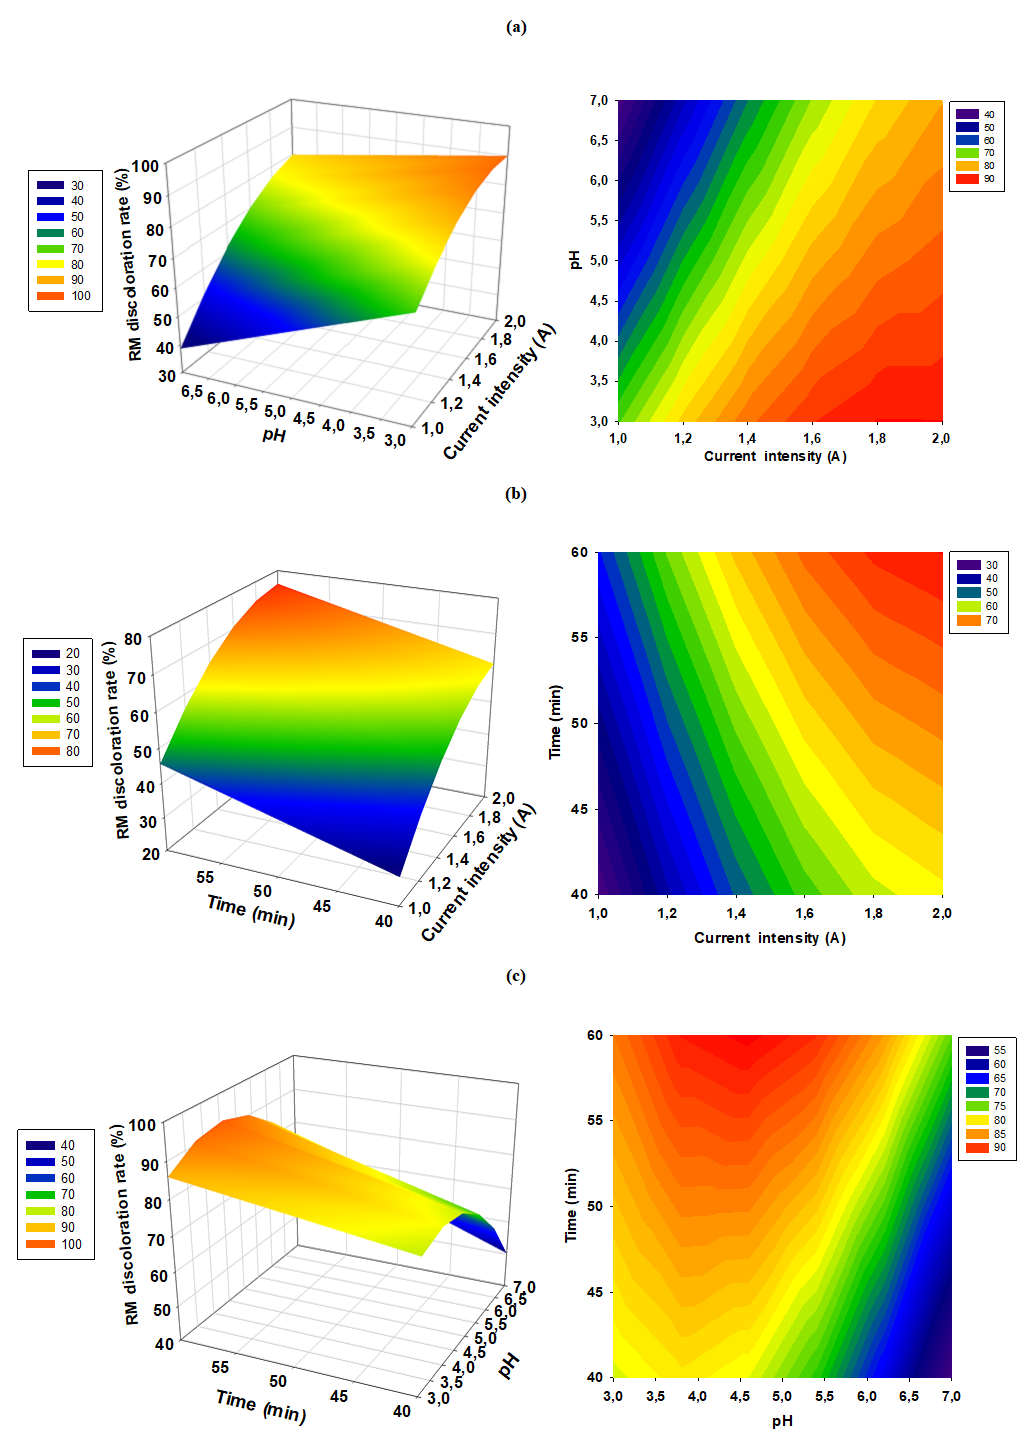
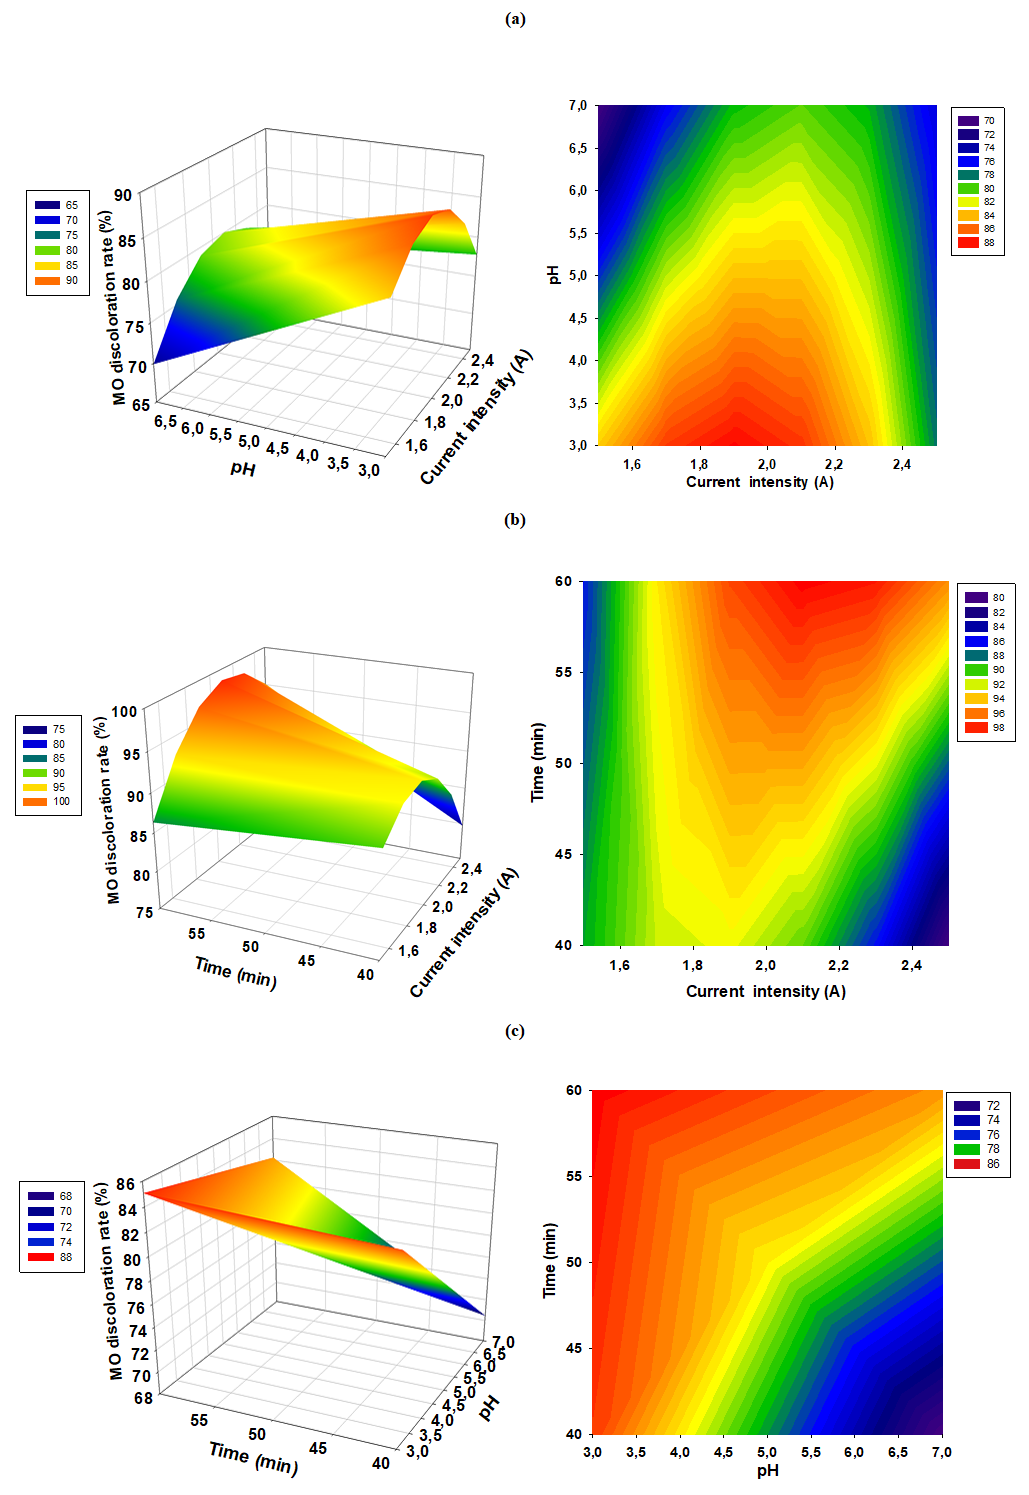
In this section, the mathematical models (Eq 16 and 17), which were used to plot the response surface curves, are represented as a function of two variables, while the other remains constant at its central level. Thanks to these curves, it may be possible to explain the influence of independent variables and their interactions on the response. The curves in Figures 5a-c and 6a-c show the effects of interactions between variables on the removal efficiency of methyl red and methyl orange, respectively. The response curves thus show that the oxidation of organic compounds depends on two variables. In all cases, it can observe the same trend of their influence on the elimination efficiency.
Figure 5. 3D response surface and contour plots showing interaction, (a) current intensity and pH, (b) current intensity and electrolysis time, (c) pH and electrolysis time for red methyl
The figure above shows the interactions that exist between the different variables for methyl red. From Figure 5a, it can be seen that increasing the current intensity from 1 to 1.5 A as the pH of the solution increases from 3 to 5, the Y response also increases. The elimination rate is around 98 % when the pH is between 4.5 and 5.5 and the current intensity is between 1.4 and 1.6 A. By increasing the pH and the intensity simultaneously, up to the pH value = 5, a maximum elimination efficiency value of 97.8 % is obtained. When these different variables have reached the optimal threshold, the elimination rate decreases. This is explained by the fact that high intensities can cause parasitic reactions, as explained before.
From Figure 5b, it can be seen that increasing the current intensity from 1 to 1.5 A when the electrolysis time increases from 40 to 60 min, the Y response also increases. Conversely, the response decreases when the current increases from 1.5 to 2A. We therefore deduce that the elimination efficiency of the treatment increases with the intensity of the current. Indeed, the maximum elimination rate of methyl red is obtained when the current reaches 1.5 A. This is due to the rapid formation of iron hydroxides in the medium, which thus promotes high floc production. At the same time, the electrolysis time also has a significant effect on the removal efficiency because the electrolysis time is continuously linked to the current intensity. Both factors increase at the same time. We deduce that there is a strong interaction between the two factors (current intensity and electrolysis time).
The same phenomena are observed in Figure 5c, which represents the interaction between the pH of the solution and the electrolysis time.
Figure 6. 3D response surface and contour plots showing interaction, (a) current intensity and pH, (b) current intensity and electrolysis time, (c) pH and electrolysis time for orange methyl
The Figure 6a above shows the interactions that exist between the different variables for methyl orange. From Figure 6a, it can be seen that increasing the current intensity from 1.5 to 2.0 A. As the pH of the solution increases from 3 to 5, the Y response also increases. The removal rate is around 98 % when the pH is between 4.5 and 5.5 and the current intensity is between 1.5 and 2.0 A. By increasing the pH and the intensity simultaneously, up to the pH value = 5, a maximum discoloration value of 98.5 % is obtained. When these two variables have reached their optimal threshold, the elimination rate decreases. This is explained by the fact that high intensities can cause parasitic reactions.
From Figure 6b, it can be seen that increasing the current intensity from 1.5 to 2.0 A when the electrolysis time increases from 40 to 60 min, the Y response also increases. Conversely, the response decreases when the current increases from 2.0 to 2.5 A. We therefore deduce that the effectiveness of the treatment increases with the intensity of the current. Indeed, the maximum elimination rate of methyl orange is obtained when the current reaches 2.0 A. This is due to the rapid formation of iron hydroxides in the medium which thus promotes high floc production. At the same time, the electrolysis time also has a significant effect on the removal efficiency because the electrolysis time is continuously linked to the current intensity. Both factors increase at the same time. We deduce that there is a strong interaction between the two factors (current intensity and electrolysis time).
The same phenomenon is observed in Figure 6c, which represents the interaction between the pH of the solution and the electrolysis time.
3.4.3. Determination of the Optimal Conditions
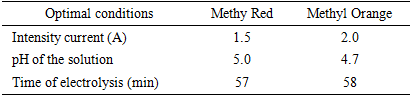
According to the model analysis, the optimal conditions for the elimination of methyl red correspond to a current intensity of 1.5 A, pH of the solution 5.0 and 57 min of electrolysis; those of methyl orange are: current intensity of 2.0 A, pH of the solution 4.70 and 58 min of electrolysis. From the optimal conditions obtained, three experiments were carried out, and the average eliminations during the electrocoagulation treatment were 97.8 % for methyl red and 98.5 % for methyl orange. In conclusion, this quadratic model really makes it possible to describe the elimination of our two dyes during treatment in the experimental framework of the range studied.
Table 6. Optimal conditions for Methyl red and Methyl orange
     
These results demonstrate significant improvements compared to previous optimization studies. [62] and Amor and [2] achieved removal rates of 97.19 % and 97.85 respectively for methyl orange using Taguchi and response surface methods, while our study achieved 98.5 % removal with additional insights into factor interactions. Although [16] reported 100 % MO removal and 96.30 % MR removal in binary mixtures using central composite design, our work provides several novel contributions: (1) comprehensive predictive models that quantify both individual and synergistic effects of operating parameters, (2) systematic identification of optimal conditions for each dye in binary systems with experimental validation (97.80 % and 98.50 % vs. predicted 94.78 % and 95.38 %), demonstrating excellent model accuracy, (3) detailed analysis of interaction effects revealing that pH-current and pH-time interactions significantly influence removal efficiency, and (4) determination of distinct optimal conditions for each dye (pH 5.0 for MR vs. pH 4.7 for MO), reflecting genuine differences in the electrocoagulation behaviour of each dye within the shared matrix. Since each dye was tracked independently by UV-visible spectrophotometry at its specific wavelength (324 nm for MR; 463 nm for MO), these distinct optima are not an artefact of the binary system but represent the true individual response of each dye to the operating parameters consistent with their different molecular structures, charge characteristics, and pKa values. Furthermore, our quadratic models enable prediction beyond the experimental domain, facilitating scale-up design and operational flexibility for industrial applications.
In conclusion, this quadratic model not only accurately describes the elimination of our two dyes during treatment in the experimental framework of the range studied, but also provides superior predictive capability and mechanistic insights compared to previous studies, bridging the gap between laboratory optimization and practical implementation requirements. The achieved removal efficiencies 97.8 % for MR; 98.5 % for MO are highly significant. While no single universally mandated numerical limit for individual synthetic dyes in effluents exists, a removal rate exceeding 95 % from environmentally relevant concentrations is widely considered the benchmark for “high-efficiency removal” in the electrocoagulation literature [28], [45]. The present results exceed this threshold for both dyes, confirming the practical environmental relevance of the optimized process.

4. Conclusions

This work aimed studying the elimination of methyl red dye and methyl orange present in wastewater by the electrocoagulation technique with iron electrodes. To achieve this, the operating parameters affecting the elimination of methyl red and methyl orange were studied. The effect of the current intensity made it possible to obtain an effective elimination of 93.74 % (1.5A) for methyl red and a rate of 94.28 % (2A) for methyl orange. The second parameter (the effect of pH), on the other hand, made it possible to see that the elimination is effective in an acidic environment (pH 3). And finally, the last parameter (the effect of the initial concentration) showed that the elimination efficiency is maximum for small concentrations. To improve the removal efficiency of these dyes, modelling was carried out using response surface methodology. It appears from this modelling that the electrolysis time is an important factor for the elimination of our dyes, and also made it possible to understand the significant influence of the intensity-pH interaction on the elimination of methyl red and methyl orange. Optimization using CCD yielded experimental removal efficiencies of 98.5% and 97.8%, with predicted values of 95.38% and 94.78%, for MO and MR, respectively. The corresponding optimal conditions were a current intensity (A) of 2.0 and 1.5, a pH of 4.7 and 5.0, and a time of electrolysis (min) of 58 and 57 for MO and MR, respectively. Additionally, the energy consumption and sludge generation associated with the optimised conditions were not assessed, and the long-term electrode stability under continuous operation was not examined. These factors are important for evaluating the true economic and environmental cost of the process at industrial scale. Future research should prioritise: (i) validation of the optimised process on real textile effluents with multi-component dye mixtures; (ii) assessment of energy efficiency and specific electrode consumption under optimised conditions to underpin techno-economic analysis; (iii) characterisation and valorisation strategies for the iron-dye sludge generated; (iv) investigation of electrode fouling and long-term operational stability; and (v) coupling of electrocoagulation with complementary post-treatment steps (e.g., membrane filtration or advanced oxidation) to achieve complete mineralisation of recalcitrant aromatic intermediates, in line with evolving regulatory requirements for micropollutant control in discharged effluents.

Highlights

v Degradation of two azo dyes by electrocoagulation.
v Central Composite Design (CCD) was implemented to optimize the key operating parameters.
v The electrolysis time was a determining factor for dye removal.
v A maximum removal efficiency of 97.80 % was achieved for methyl red.
v A maximum removal efficiency of 98.50 % was achieved for methyl orange.
v The optimum parameters allowing optimal degradation have been obtained.

Funding Statement

This work was self-funded by the authors.

CrediT Authorship Contribution Statement

Kom Blaise: Manuscript preparation and result analysis, Benessoubo Kada Danièle: Manuscript editing and result analysis, Domga Richard: Conceived the original idea, carried out experiments, results analysis and manuscript preparation, Alang Michael Bong: Result analysis and manuscript preparation, Anrakang Bogorta Pascaline: Manuscript editing and result analysis, Payang Gangou Raoul: Carried out experiments and manuscript preparation, Inna Samomssa: Work supervisor, Tchamango Jiankam Serge Raul: Work supervisor, Bike Mbah Jean Baptiste: Work supervisor.

Declaration of Competing Interest

The authors declare that they have no conflict of interest.

ACKNOWLEDGEMENTS

The authors thank the Department of Applied Chemistry of the National School of Agro Industrial Sciences of the University of Ngaoundere in Cameroon for putting in our disposition, specific materials that helped us in the course of our research.

References

[1]  S. Venkata Mohan, Y. Vijaya Bhaskar, and P. N. Sarma, “Biohydrogen production from chemical wastewater treatment in biofilm configured reactor operated in periodic discontinuous batch mode by selectively enriched anaerobic mixed consortia,” Water Res., vol. 41, no. 12, pp. 2652–2664, Jun. 2007, doi: 10.1016/j.watres.2007.02.015.
[2]  Md. Rashid Al-Mamun, Md. Shofikul Islam, Md. Rasel Hossain, S. Kader, Md. Shahinoor Islam, and Md. Zaved Hossain Khan, “A novel and highly efficient Ag and GO co-synthesized ZnO nano photocatalyst for methylene blue dye degradation under UV irradiation,” Environ. Nanotechnol. Monit. Manag., vol. 16, p. 100495, Dec. 2021, doi: 10.1016/j.enmm.2021.100495.
[3]  P. A. Carneiro, M. E. Osugi, J. J. Sene, Marc. A. Anderson, and M. V. B. Zanoni, “Evaluation of color removal and degradation of a reactive textile azo dye on nanoporous TiO2 thin-film electrodes,” Electrochimica Acta, vol. 49, no. 22, pp. 3807–3820, Sep. 2004, doi: 10.1016/j.electacta.2003.12.057.
[4]  A. Benhadji, M. Taleb Ahmed, and R. Maachi, “Electrocoagulation and effect of cathode materials on the removal of pollutants from tannery wastewater of Rouïba,” Desalination, vol. 277, no. 1, pp. 128–134, Aug. 2011, doi: 10.1016/j.desal.2011.04.014.
[5]  L. Gomathi Devi, S. Girish Kumar, K. Mohan Reddy, and C. Munikrishnappa, “Photo degradation of Methyl Orange an azo dye by Advanced Fenton Process using zero valent metallic iron: Influence of various reaction parameters and its degradation mechanism,” J. Hazard. Mater., vol. 164, no. 2, pp. 459–467, May 2009, doi: 10.1016/j.jhazmat.2008.08.017.
[6]  R. Domga et al., “Batch equilibrium, kinetic and thermodynamic studies on adsorption of methylene blue in aqueous solution onto activated carbon prepared from Bos indicus gudali bones,” Chem. J., vol. 1, no. 6, pp. 172–181, 2015.
[7]  R. Domga, F. Togue-Kamga, C. Noubactep, and J.-B. Tchatchueng, “Discussing porosity loss of Fe0 packed water filters at ground level,” Chem. Eng. J., vol. 263, pp. 127–134, 2015.
[8]  R. Domga, F. Togue-Kamga, and J. B. Tchatchueng, “Mathematic analysis of porosity loss in granular metallic iron (Fe0) water filter,” Int J Emerg. Eng Res Technol, vol. 5, pp. 28–35, 2017.
[9]  C. Tcheka, R. P. Chicinas, A. Maicaneanu, P. N. Fotsing, H. Moussout, and R. Domga, “Tetra-n-butylammonium bromide (TBAB) modified Cameroonian local clay material for adsorption of crystal violet dye from aqueous solution,” Submitt. Adv. Mater., vol. 2, pp. 1–16, 2018.
[10]  R. Domga et al., “Synthesis of animal activated carbon from gudali (bos inducus) bones and its adsorption for chromium (vi) in aqueous solution,” Int. J. Eng. Res. Sci. Techology, vol. 7, no. 1, pp. 1–15, 2018.
[11]  A. Tsafam, R. Domga, J. M. D. Dikdim, and F. Nyounaï, “Adsorption of Cr (VI) Onto Clay Modified by Sodium Chloride and Clay Modified by Aluminum Hydroxide of Karewa (North Cameroon),” vol. 4, no. 1.
[12]  A. Daouda, A. T. Honorine, N. G. Bertrand, D. Richard, and D. Domga, “Adsorption of rhodamine B onto orange peel powder,” Am. J. Chem., vol. 9, no. 5, pp. 142–149, 2019.
[13]  A. Daouda, Y. Kidwe, D. Richard, D. Domga, and H. Massai, “Adsorption of Cu<sup>2+</sup> and Cr<sup>6+</sup> in Aqueous Solution by a Thermally Modified Biosorbent Based on Cotton Cakes,” Am. J. Phys. Chem., vol. 8, no. 4, p. 66, 2019, doi: 10.11648/j.ajpc.20190804.11.
[14]  L. El Hammari et al., “Optimization of the adsorption of lead (II) by hydroxyapatite using a factorial design: Density functional theory and molecular dynamics,” Front. Environ. Sci., vol. 11, p. 1112019, Mar. 2023, doi: 10.3389/fenvs.2023.1112019.
[15]  F. E. Tabaght et al., “Synthesis, characterization, and biodegradation studies of new cellulose-based polymers,” Sci. Rep., vol. 13, no. 1, p. 1673, Jan. 2023, doi: 10.1038/s41598-023-28298-5.
[16]  R. Domga, R. T. Doumbi, B. Kom, B. S. Nen-Oure, L. C. M. Waffo, and E. N. Guillaume, “Simultaneous removal of methyl orange and methyl red dyes by electrocoagulation process in aqueous medium using central composite design.,” Sustain. Chem. Environ., p. 100298, 2025.
[17]  D. Richard et al., “A new model for analyzing porosity loss in metallic iron packed-beds for water treatment,” J Mater Env. Sustain Res, vol. 5, no. 4, pp. 38–50, 2025.
[18]  M. S. Islam, K. N. McPhedran, S. A. Messele, Y. Liu, and M. Gamal El-Din, “Isotherm and kinetic studies on adsorption of oil sands process-affected water organic compounds using granular activated carbon,” Chemosphere, vol. 202, pp. 716–725, Jul. 2018, doi: 10.1016/j.chemosphere.2018.03.149.
[19]  “Biological Fixed Film - Choi - 2013 - Water Environment Research - Wiley Online Library.” Accessed: Nov. 06, 2026. [Online]. Available: https://onlinelibrary.wiley.com/doi/abs/10.2175/106143013X13698672321904.
[20]  M. Panizza and G. Cerisola, “Direct And Mediated Anodic Oxidation of Organic Pollutants,” Chem. Rev., vol. 109, no. 12, pp. 6541–6569, Dec. 2009, doi: 10.1021/cr9001319.
[21]  “Physico‐Chemical Processes - Pourrezaei - 2010 - Water Environment Research - Wiley Online Library.” Accessed: Nov. 06, 2026. [Online]. Available: https://onlinelibrary.wiley.com/doi/abs/10.2175/106143010X12756668800852.
[22]  Md. S. Islam, J. Moreira, P. Chelme-Ayala, and M. Gamal El-Din, “Prediction of naphthenic acid species degradation by kinetic and surrogate models during the ozonation of oil sands process-affected water,” Sci. Total Environ., vol. 493, pp. 282–290, Sep. 2014, doi: 10.1016/j.scitotenv.2014.05.138.
[23]  N. Sun et al., “Advanced Analytical Mass Spectrometric Techniques and Bioassays to Characterize Untreated and Ozonated Oil Sands Process-Affected Water,” Environ. Sci. Technol., vol. 48, no. 19, pp. 11090–11099, Oct. 2014, doi: 10.1021/es503082j.
[24]  A. S. Pereira, M. S. Islam, M. Gamal El‐Din, and J. W. Martin, “Ozonation degrades all detectable organic compound classes in oil sands process‐affected water; an application of high‐performance liquid chromatography/obitrap mass spectrometry,” Rapid Commun. Mass Spectrom., vol. 27, no. 21, pp. 2317–2326, Nov. 2013, doi: 10.1002/rcm.6688.
[25]  S. Irki, D. Ghernaout, and M. W. Naceur, “Decolourization of Methyl Orange (MO) by electrocoagulation (EC) using iron electrodes under a magnetic field (MF),” Desalination Water Treat., vol. 79, pp. 368–377, Jun. 2017, doi: 10.5004/dwt.2017.20797.
[26]  G. Danaei et al., “National, regional, and global trends in fasting plasma glucose and diabetes prevalence since 1980: systematic analysis of health examination surveys and epidemiological studies with 370 country-years and 2.7 million participants,” The Lancet, vol. 378, no. 9785, pp. 31–40, 2011.
[27]  M. Meshref et al., “Understanding the similarities and differences between ozone and peroxone in the degradation of naphthenic acids: Comparative performance for potential treatment,” Chemosphere, vol. 180, pp. 149–159, 2017.
[28]  J. N. Hakizimana et al., “Electrocoagulation process in water treatment: A review of electrocoagulation modeling approaches,” Desalination, vol. 404, pp. 1–21, 2017, doi: 10.1016/j.desal.2016.10.011.
[29]  T. Dong, Y. Zhang, M. S. Islam, Y. Liu, and M. Gamal El-Din, “The impact of various ozone pre-treatment doses on the performance of endogenous microbial communities for the remediation of oil sands process-affected water,” Int. Biodeterior. Biodegrad., vol. 100, pp. 17–28, 2015.
[30]  J. Vidal, L. Villegas, J. M. Peralta-Hernandez, and R. Salazar Gonzalez, “Removal of Acid Black 194 dye from water by electrocoagulation with aluminum anode,” J. Environ. Sci. Health Part A, vol. 51, no. 4, pp. 289–296, 2016.
[31]  C. E. Barrera Díaz and N. González-Rivas, “The use of Al, Cu, and Fe in an integrated electrocoagulation-ozonation process,” J. Chem., 2015.
[32]  A. R. Makwana and M. M. Ahammed, “Continuous electrocoagulation process for the post-treatment of anaerobically treated municipal wastewater,” Process Saf. Environ. Prot., vol. 102, pp. 724–733, 2016.
[33]  M. Kobya, E. Demirbas, and F. Ulu, “Evaluation of operating parameters with respect to charge loading on the removal efficiency of arsenic from potable water by electrocoagulation,” J. Environ. Chem. Eng., vol. 4, no. 2, pp. 1484–1494, 2016.
[34]  J. Akansha, P. V. Nidheesh, A. Gopinath, K. V. Anupama, and M. S. Kumar, “Treatment of dairy industry wastewater by combined aerated electrocoagulation and phytoremediation process,” Chemosphere, vol. 253, p. 126652, 2020.
[35]  M. Nasrullah, A. W. Zularisam, S. Krishnan, M. Sakinah, L. Singh, and Y. W. Fen, “High performance electrocoagulation process in treating palm oil mill effluent using high current intensity application,” Chin. J. Chem. Eng., vol. 27, no. 1, pp. 208–217, 2019.
[36]  R. Sridhar, V. Sivakumar, V. P. Immanuel, and J. P. Maran, “Treatment of pulp and paper industry bleaching effluent by electrocoagulant process,” J. Hazard. Mater., vol. 186, no. 2–3, pp. 1495–1502, 2011.
[37]  P. Asaithambi, “Studies on various operating parameters for the removal of COD from pulp and paper industry using electrocoagulation process,” Desalination Water Treat., vol. 57, no. 25, pp. 11746–11755, 2016.
[38]  V. Khandegar and A. K. Saroha, “Electrocoagulation for the treatment of textile industry effluent – a review,” J. Environ. Manage., vol. 128, pp. 949–963, 2013.
[39]  B. Kom et al., “Elimination of phosphate ions by coupling adsorption/electrocoagulation processes using activated carbon from Hyphaene thebaica kernels and iron electrodes,” Am. J. Chem., vol. 15, no. 4, pp. 89–101, 2025, doi: 10.5923/j.chemistry.20251504.02.
[40]  M. Y. A. Mollah, R. Schennach, J. R. Parga, and D. L. Cocke, “Electrocoagulation (EC) – science and applications,” J. Hazard. Mater., vol. 84, no. 1, pp. 29–41, 2001.
[41]  S. Zodi, O. Potier, F. Lapicque, and J. P. Leclerc, “Treatment of the textile wastewaters by electrocoagulation: Effect of operating parameters on the sludge settling characteristics,” Sep. Purif. Technol., vol. 69, no. 1, pp. 29–36, 2009.
[42]  W. L. Chou, C. T. Wang, and K. Y. Huang, “Effect of operating parameters on indium (III) ion removal by iron electrocoagulation and evaluation of specific energy consumption,” J. Hazard. Mater., vol. 167, no. 1–3, pp. 467–474, 2009.
[43]  S. Irki, D. Ghernaout, and M. W. Naceur, “Decolourization of methyl orange (MO) by electrocoagulation (EC) using iron electrodes under a magnetic field (MF),” Desalination Water Treat., vol. 79, pp. 368–377, 2017.
[44]  M. B. Sasson, W. Calmano, and A. Adin, “Iron-oxidation processes in an electroflocculation (electrocoagulation) cell,” J. Hazard. Mater., vol. 171, no. 1–3, pp. 704–709, 2009.
[45]  S. Garcia-Segura, M. M. S. G. Eiband, J. V. de Melo, and C. A. Martínez-Huitle, “Electrocoagulation and Advanced Electrocoagulation Processes: A General Review about the Fundamentals, Emerging Applications and Its Association with Other Technologies,” J. Electroanal. Chem., vol. 801, pp. 267–299, 2017, doi: 10.1016/j.jelechem.2017.07.047.
[46]  H. A. Salman, M. Y. Younis, H. R. Khalid, and A. A. Khadom, “Removal of methyl orange dye from simulated wastewater by electrocoagulation technique using Taguchi method: kinetics and optimization approaches,” React. Kinet. Mech. Catal., 2022, doi: 10.1007/s11144-022-02269-9.
[47]  A. T. M. Ali and R. H. Salman, “Enhancing the removal of methyl orange dye by electrocoagulation system with nickel foam electrode optimization with surface response methodology,” J. Ecol. Eng., vol. 25, no. 12, pp. 26–38, 2024, doi: 10.12911/22998993/193587.
[48]  A. Sugha and M. S. Bhatti, “Optimization of electrocoagulation removal of a mixture of three azo dyes: spectrophotometric colour characteristics for best operating conditions,” RSC Adv., vol. 15, p. 6492, 2025.
[49]  R. Domga, Removal of the methylene blue using activated charcoal derived from the pyrolysis of Gudali (Bos indicus) bones. Generis Publishing, 2025.
[50]  R. Domga et al., “Simultaneous removal of methyl orange and methyl red dyes by electrocoagulation process in aqueous medium using central composite design,” Sustain. Chem. Environ., vol. 13, p. 100298, 2025.
[51]  L. C. M. Waffo et al., “Investigation on Tenofovir Removal from Water by Electro-Fenton Process: Optimization of the Mineralization using Box-Behnken Design,” Biointerface Res. Appl. Chem., vol. 13, no. 6, 2023, doi: 10.33263/BRIAC136.522.
[52]  D. Baş and İ. H. Boyacı, “Modeling and optimization I: Usability of response surface methodology,” J. Food Eng., vol. 78, no. 3, pp. 836–845, Feb. 2007, doi: 10.1016/j.jfoodeng.2005.11.024.
[53]  S. Tchamango, O. Kamdoum, D. Donfack, D. Babale, and E. Ngameni, “Comparison of Electrocoagulation and Chemical Coagulation in the Treatment of Artisanal Tannery Effluents,” Niger. J. Technol., vol. 35, no. 1, p. 219, 2015, doi: 10.4314/njt.v35i1.29.
[54]  M. Eyvaz, M. Kirlaroglu, T. S. Aktas, and E. Yuksel, “The effects of alternating current electrocoagulation on dye removal from aqueous solutions,” Chem. Eng. J., vol. 153, no. 1–3, pp. 16–22, 2009, doi: 10.1016/j.cej.2009.05.028.
[55]  S. R. Tchamango, K. Wandji Ngayo, P. D. Belibi Belibi, F. Nkouam, and M. B. Ngassoum, “Treatment of a dairy effluent by classical electrocoagulation and indirect electrocoagulation with aluminum electrodes,” Sep. Sci. Technol., vol. 56, no. 6, pp. 1128–1139, 2021, doi: 10.1080/01496395.2020.1748889.
[56]  S. Aoudj, A. Khelifa, N. Drouiche, M. Hecini, and H. Hamitouche, “Electrocoagulation process applied to wastewater containing dyes from textile industry,” Chem. Eng. Process. Process Intensif., vol. 49, no. 11, pp. 1176–1182, 2010, doi: 10.1016/j.cep.2010.08.019.
[57]  S. Merouani, O. Hamdaoui, F. Saoudi, M. Chiha, and C. Pétrier, “Influence of bicarbonate and carbonate ions on sonochemical degradation of Rhodamine B in aqueous phase,” J. Hazard. Mater., vol. 175, no. 1, pp. 593–599, Mar. 2010, doi: 10.1016/j.jhazmat.2009.10.046.
[58]  M. Khedher, M. Mossad, and H. K. El-Etriby, “Enhancement of Electrocoagulation Process for Dye Removal Using Powdered Residuals from Water Purification Plants (PRWPP),” Water. Air. Soil Pollut., vol. 228, no. 8, 2017, doi: 10.1007/s11270-017-3478-2.
[59]  N. M. A. Ghalwa, A. M. Saqer, and N. B. Farhat, “Removal of Reactive Red 24 dye by clean electrocoagulation process using iron and aluminum electrodes,” J. Chem. Eng. Process Technol., 2016.
[60]  J. N. Hakizimana et al., “Electrocoagulation process in water treatment: A review of electrocoagulation modeling approaches,” Desalination, vol. 404, pp. 1–21, 2017, doi: 10.1016/j.desal.2016.10.011.
[61]  S. Garcia-Segura, M. M. S. G. Eiband, J. V. de Melo, and C. A. Martínez-Huitle, “Electrocoagulation and advanced electrocoagulation processes: A general review about the fundamentals, emerging applications and its association with other technologies,” J. Electroanal. Chem., vol. 801, pp. 267–299, 2017, doi: 10.1016/j.jelechem.2017.07.047.
[62]  S. H. Abbas, Y. M. Younis, K. H. Rashid, and A. A. Khadom, “Removal of methyl orange dye from simulated wastewater by electrocoagulation technique using Taguchi method: kinetics and optimization approaches,” React. Kinet. Mech. Catal., vol. 135, no. 5, pp. 2663–2679, Oct. 2022, doi: 10.1007/s11144-022-02269-9.